. 2017 Sep;5(3):328-354.
doi: 10.1017/nws.2017.10. Epub 2017 Jun 29.

Forward reachable sets: Analytically derived properties of connected components for dynamic networks

Affiliations

Forward reachable sets: Analytically derived properties of connected components for dynamic networks

Benjamin Armbruster et al. Netw Sci (Camb Univ Press). 2017 Sep.

Abstract

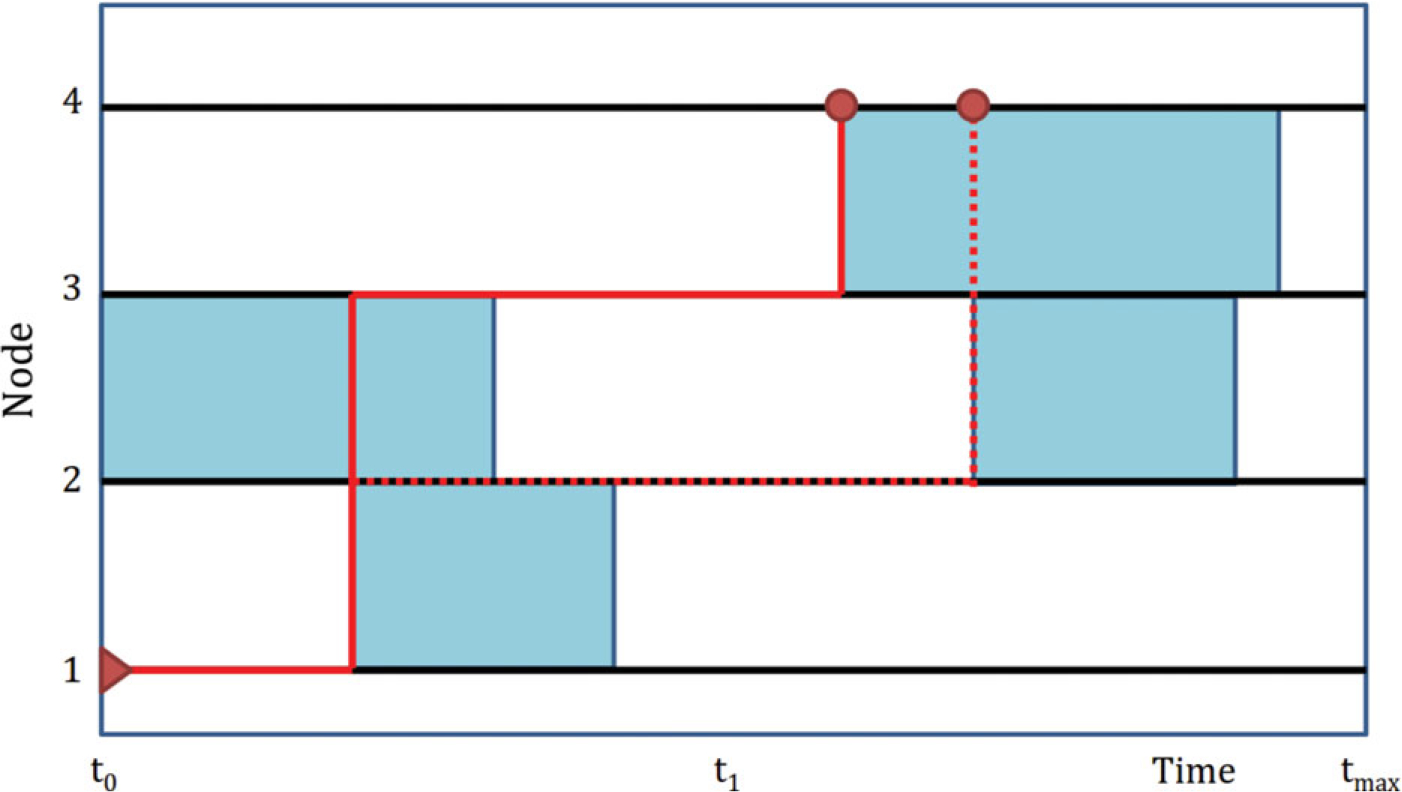
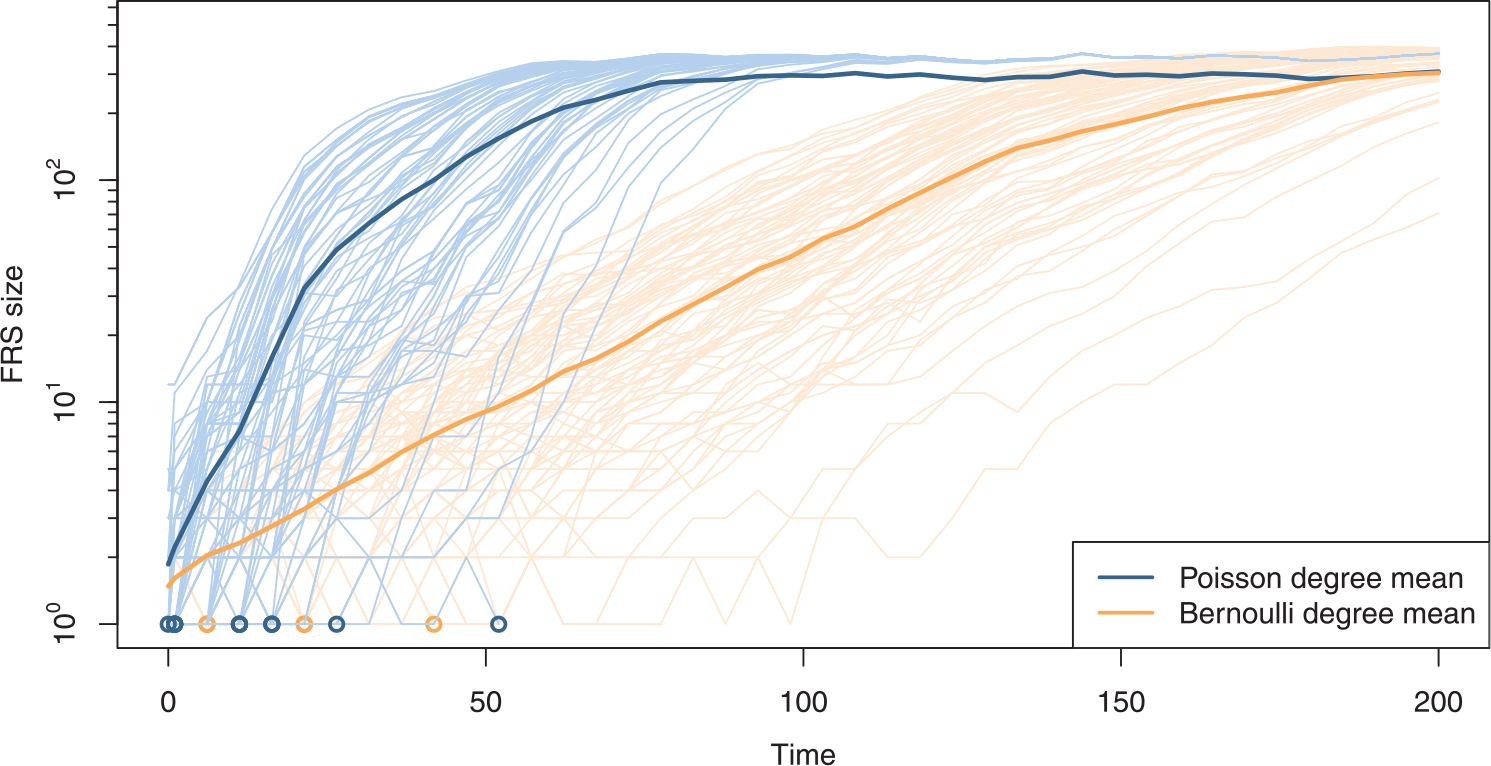
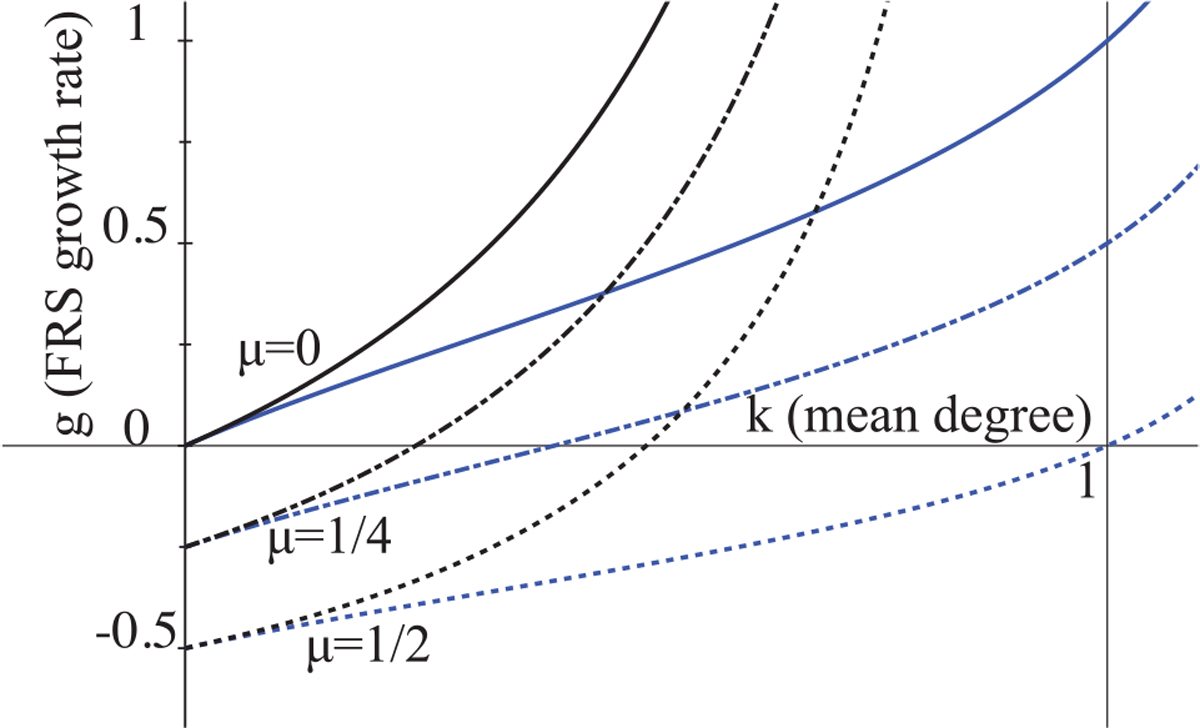
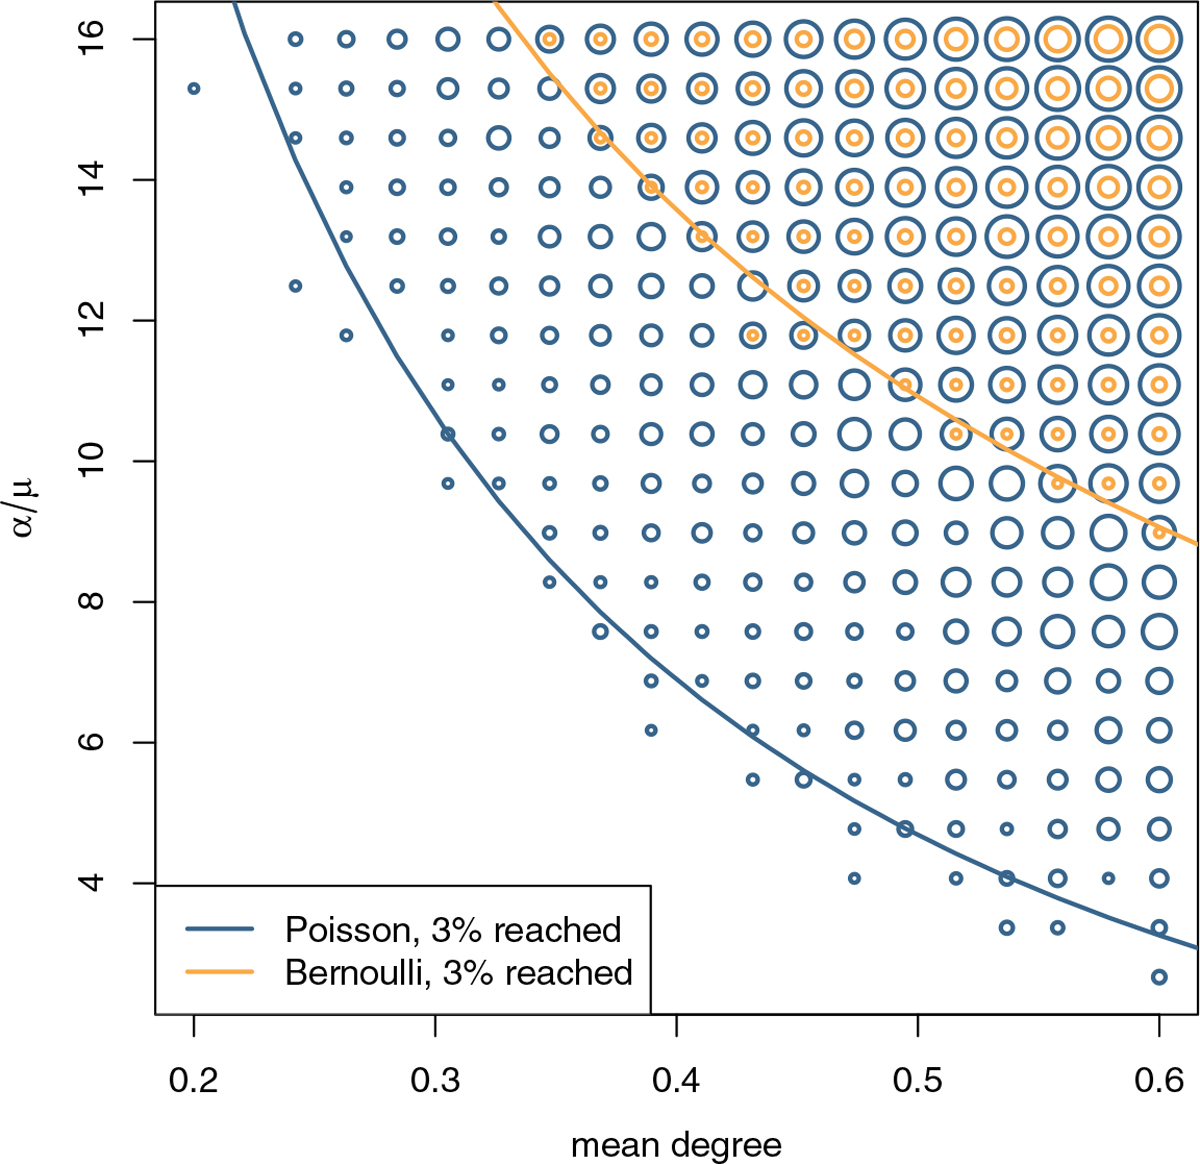
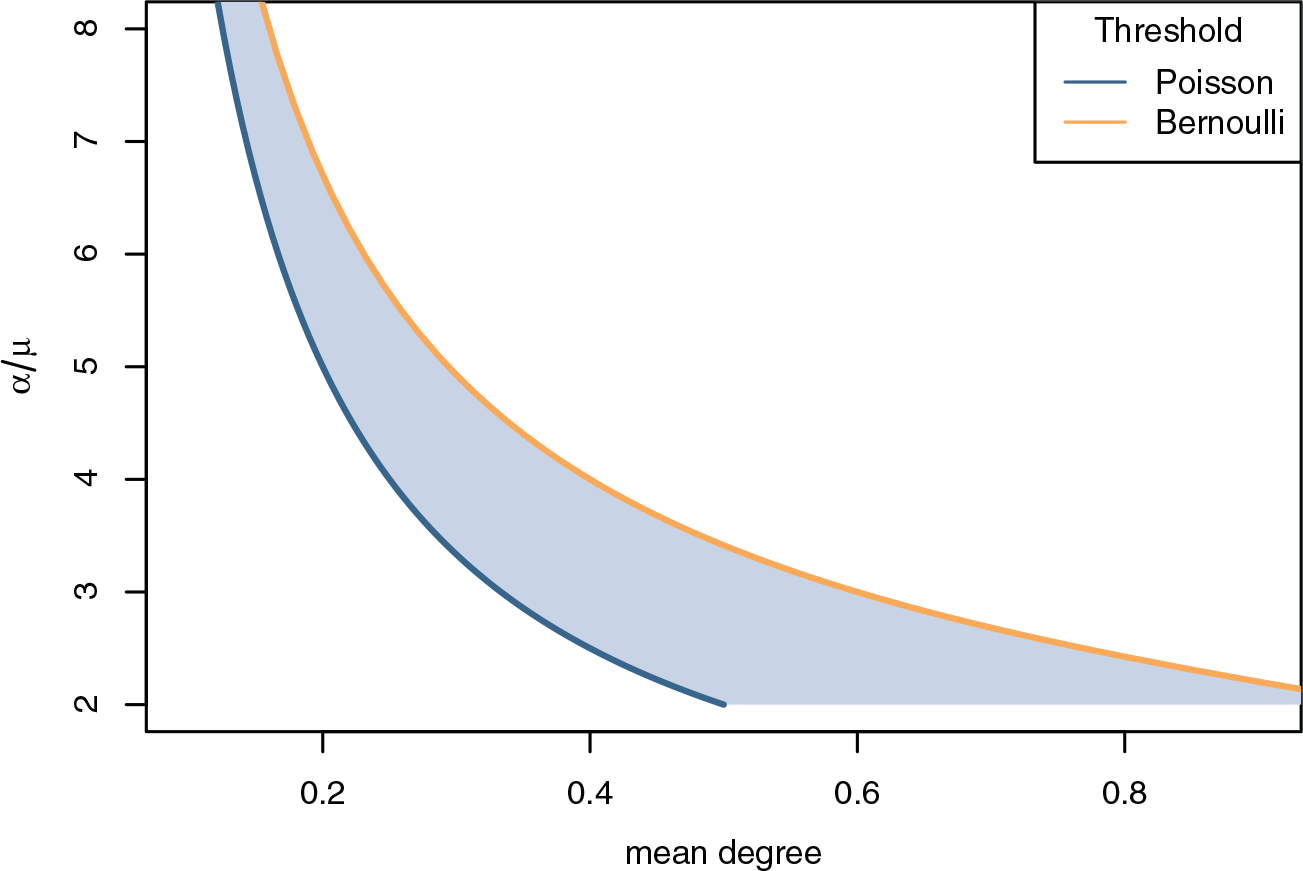
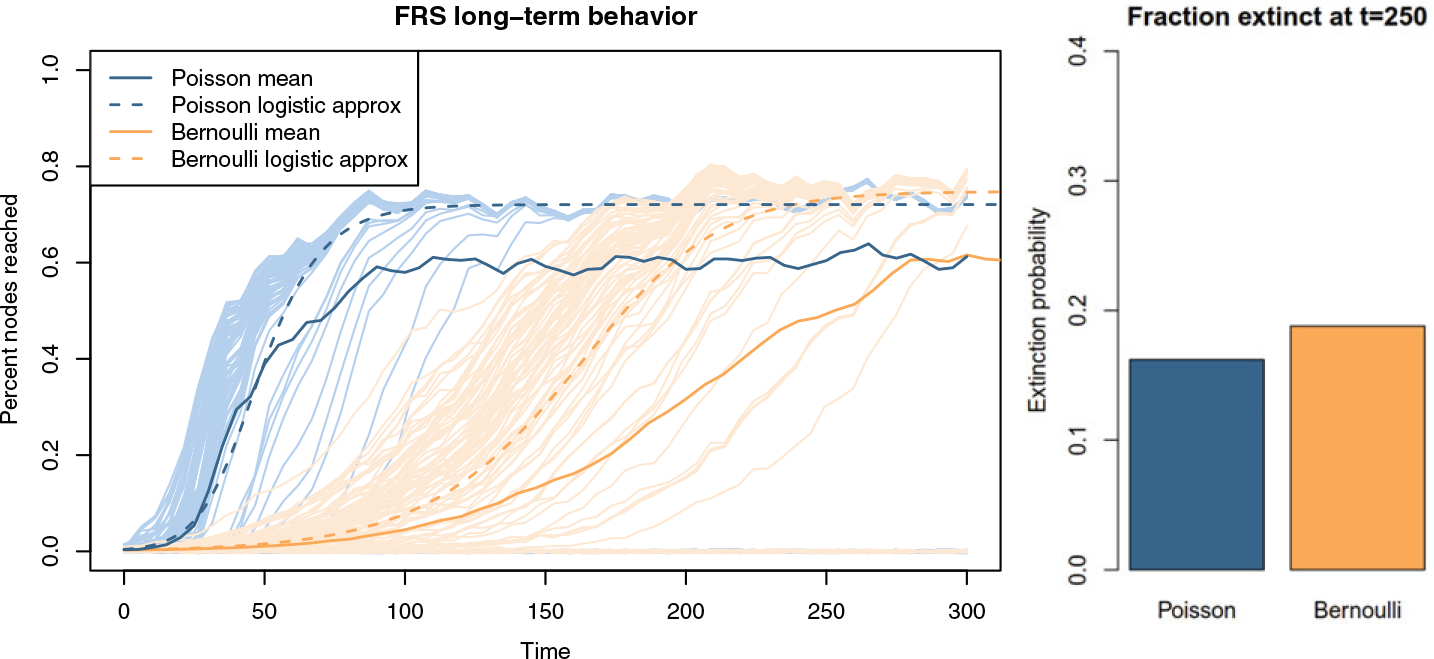
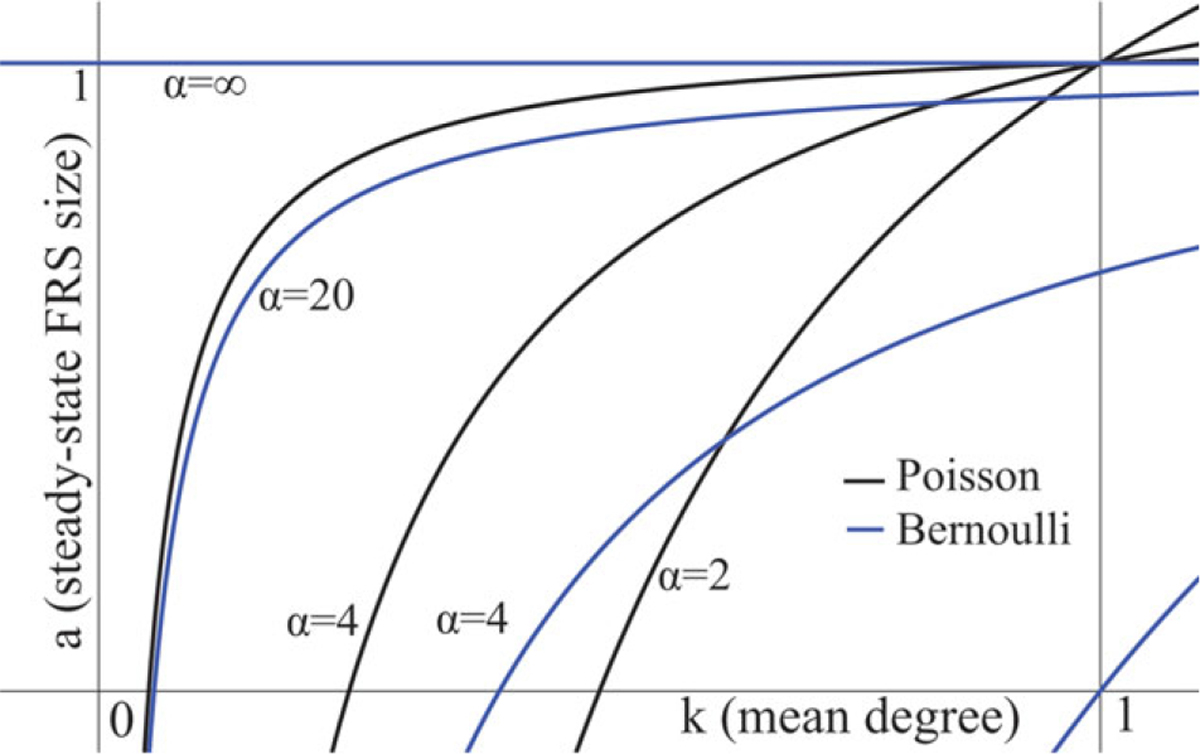
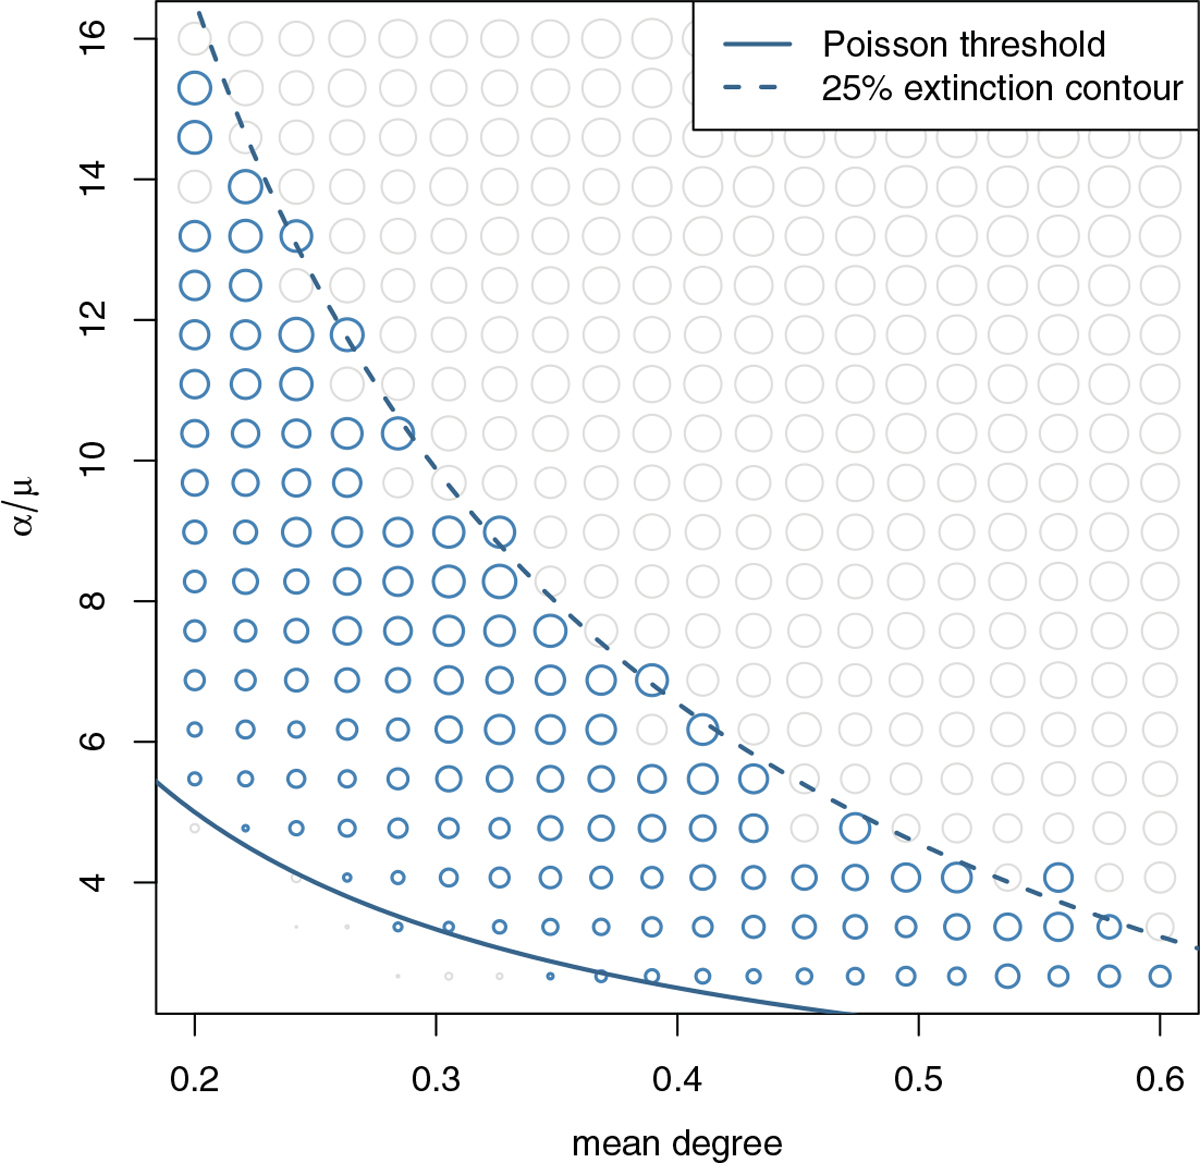
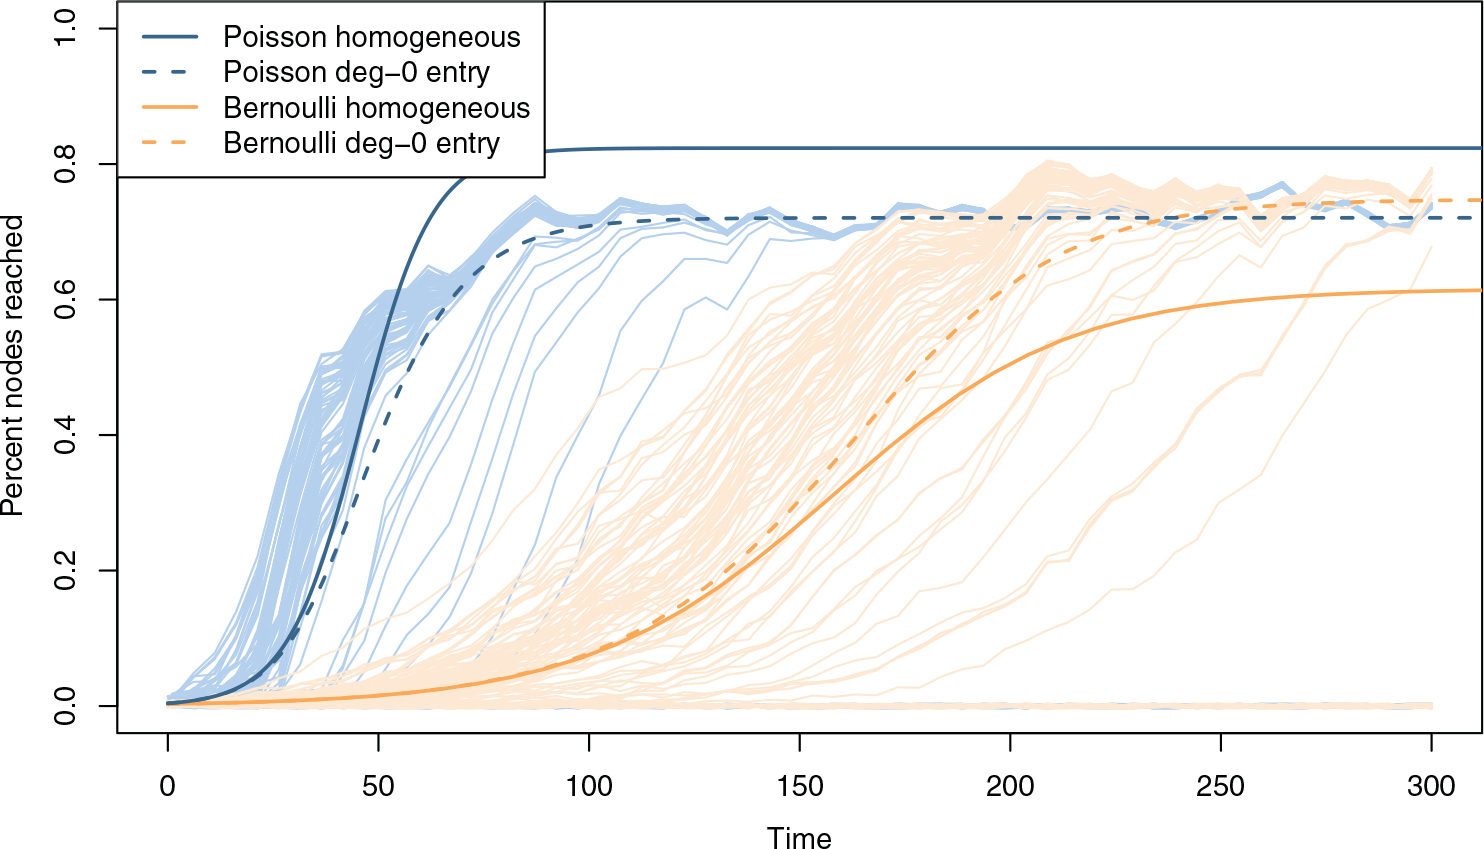
Formal analysis of the emergent structural properties of dynamic networks is largely uncharted territory. We focus here on the properties of forward reachable sets (FRS) as a function of the underlying degree distribution and edge duration. FRS are defined as the set of nodes that can be reached from an initial seed via a path of temporally ordered edges; a natural extension of connected component measures to dynamic networks. Working in a stochastic framework, we derive closed-form expressions for the mean and variance of the exponential growth rate of the FRS for temporal networks with both edge and node dynamics. For networks with node dynamics, we calculate thresholds for the growth of the FRS. The effects of finite population size are explored via simulation and approximation. We examine how these properties vary by edge duration and different cross-sectional degree distributions that characterize a range of scientifically interesting normative outcomes (Poisson and Bernoulli). The size of the forward reachable set gives an upper bound for the epidemic size in disease transmission network models, relating this work to epidemic modeling (Ferguson, 2000; Eames, 2004).

Keywords: dynamic network; epidemic size; network transmission; networks; reachability; reachable set.


Figures

Fig. 1.
Fig. 1.
Forward reachable path: The black horizontal lines represent nodes, and the blue shaded regions represent active edges. The red line is a forward reachable path from node 1 to 4, within [t0, tmax]. There is a path even though the cross-sectional network at t1 has no active connecting edges. The dotted path also connects node 1 to 4, but takes a longer time.
Fig. 2.
Fig. 2.
Growth of the active forward reachable set (FRS) for network parameters k = 0.5, α = 1/6, μ = 1/40, and network size 500. The thin blue lines show the FRS trajectories starting at different initial nodes on a single simulated network with Poisson degree distribution; the lighter orange lines, for Bernoulli. The circles along the bottom represent FRS extinctions, and the thick lines are for the corresponding mean FRS sizes.
Fig. 3.
Fig. 3.
Growth rate, g. Black lines are for the Poisson case and blue lines for the Bernoulli case. Here, α = 1 and we show μ = 0, 1/4, 1/2. For other α values, scale g and μ accordingly.
Fig. 4.
Fig. 4.
Comparison of the FRS growth rate across simulated networks with different parameter values. The size of the circles represent the mean FRS size at t = 30, which we can us as a proxy measure of the exponential growth rate. We only show circles for FRS sizes >3%. The two lines highlight the theoretic contours of equal growth rate.
Fig. 5.
Fig. 5.
Growth threshold. Above the threshold, growth is positive. There is a range of parameters (the blue shaded region) with positive growth for Poisson, but not for Bernoulli degree networks. Note α/μ < 2 is not possible (Section 2.1).
Fig. 6.
Fig. 6.
Long-term behavior of the active forward reachable set for a simulated network with parameters k = 0.5, α = 1/6, μ = 1/40, and network size 500 (the same as in Figure 2). The non-logged y-axis shows the logistic growth curve; the mean-field logistic approximations match up with the persistent FRS size. The different trajectories show the FRS growth for different starting nodes. At equilibrium, the FRS size distribution is bimodal, with the lower mode showing the extinction probability (right panel). All the trajectories that persist eventually converge to an active FRS of the same size.
Fig. 7.
Fig. 7.
Mean-field equilibrium forward reachable set size for μ = 1. Black lines are for the Poisson case and blue lines for the Bernoulli case. Lines are shown for α = 2, 4, 20, ∞.
Fig. 8.
Fig. 8.
The persistent FRS size, plotted as circle size, across different network parameter values at equilibrium. The band of blue circles shows the region where extinction probability is between 25% and 75%. In the lower left corner, the FRS goes extinct for most initial nodes. In the upper right, the FRS will grow to the persistent size most of the time.
Fig. 9.
Fig. 9.
Comparing the persistent FRS size from the homogeneous model (Section 5) versus the adjusted degree-0 entry model (Appendix 7.7). For network parameters k = 0.5, α = 1/6, μ = 1/40, and network size 500 (the same simulations as in Figure 2), the homogeneous model shows higher equilibrium FRS size for Poisson degree networks than Bernoulli. However, in the degree-0 entry model, and in our simulations (thin lines), the equilibrium prevalence for both are nearly the same.

References

    1. Baggaley RF, Garnett GP, & Ferguson NM (2006). Modelling the impact of antiretroviral use in resource-poor settings. PLoS Medicine, 3(4), e124. - PMC - PubMed
    1. Banks HT, Broido A, Canter I, Gayvert K, Hu S, Joyner M, & Link K (2011). Simulation Algorithms for Continuous Time Markov Chain Models. Raleigh, NC: Tech. rept. North Carolina State University.
    1. Bauch C, & Rand DA (2000). A moment closure model for sexually transmitted disease transmission through a concurrent partnership network. Proceedings of the Royal Society B: Biological Sciences, 267(1456), 2019–2027. - PMC - PubMed
    1. Bender-deMoll S, & Morris M (2015). tsna: Tools for Temporal Social Network Analysis (Version 0.2.0). Comprehensive R Archive Network (CRAN). Retrieved from https://cran.r-project.org/web/packages/tsna/index.html.
    1. Britton T, & Trapman P (2014). Stochastic epidemics in growing populations. Bulletin of Mathematical Biology, 76(5), 985–996. - PMC - PubMed

LinkOut - more resources