. 2022 Aug 24:2022:5173761.
doi: 10.1155/2022/5173761. eCollection 2022.

Comprehensive Analysis of N6-Methyladenosine RNA Methylation Regulators in the Diagnosis and Subtype Classification of Acute Myocardial Infarction

Affiliations

Comprehensive Analysis of N6-Methyladenosine RNA Methylation Regulators in the Diagnosis and Subtype Classification of Acute Myocardial Infarction

Xianpei Wang et al. J Immunol Res. .

Abstract

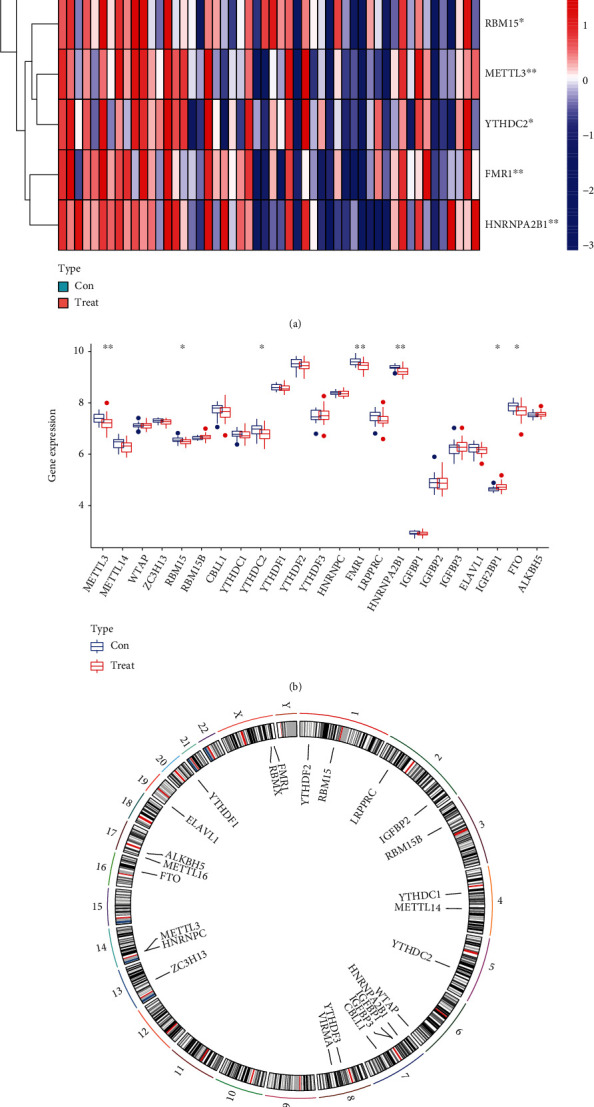
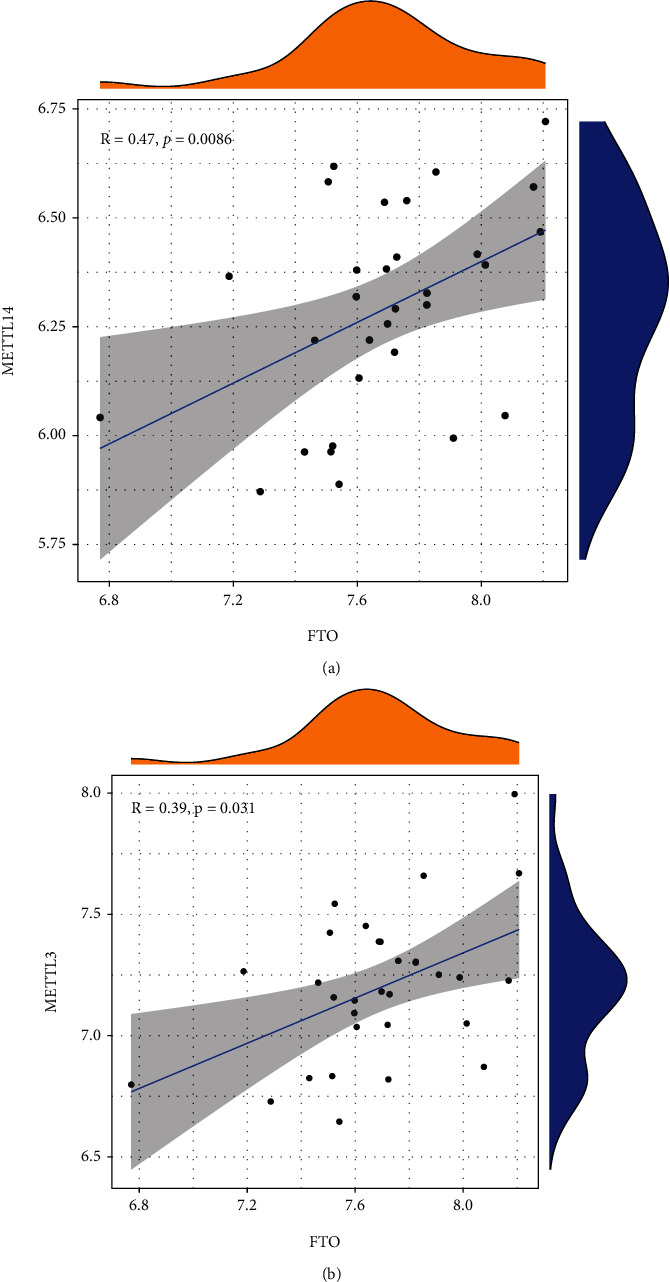
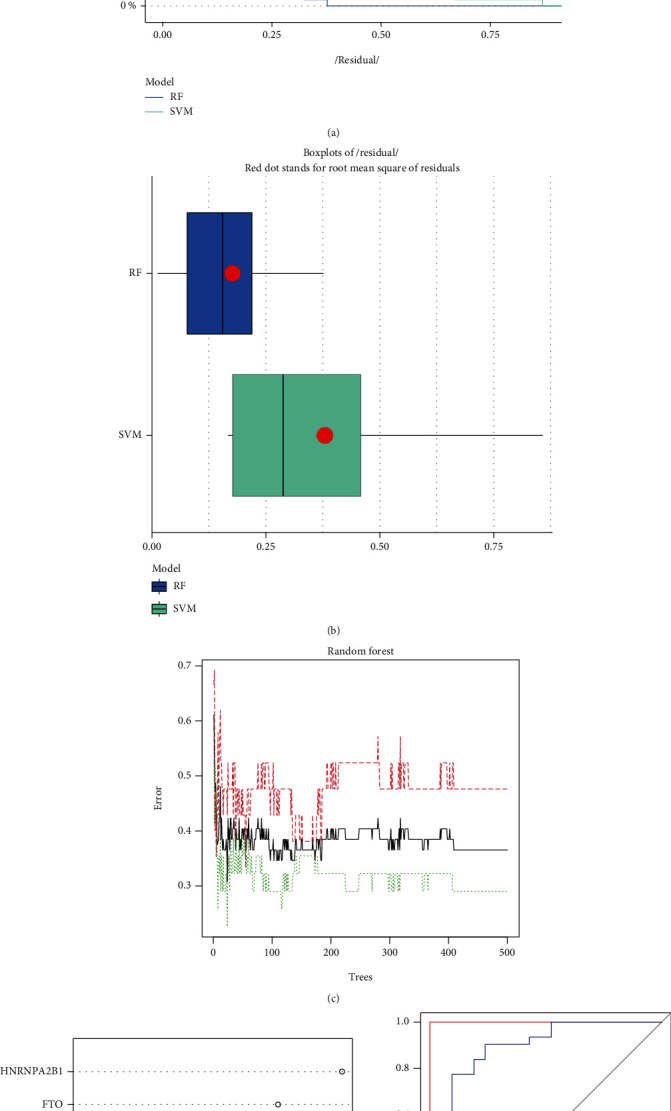
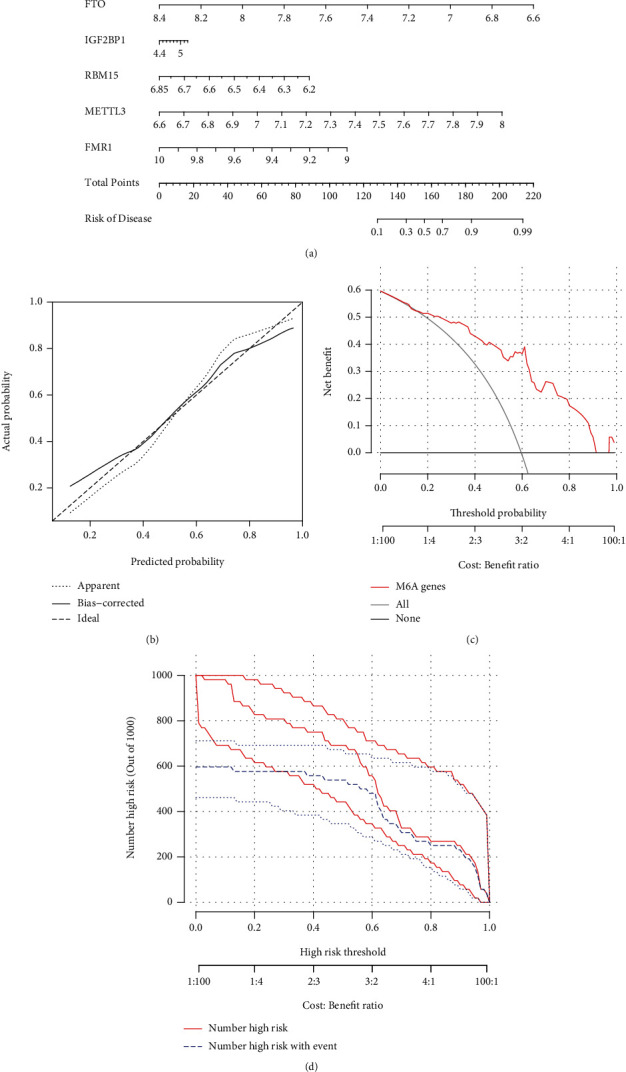
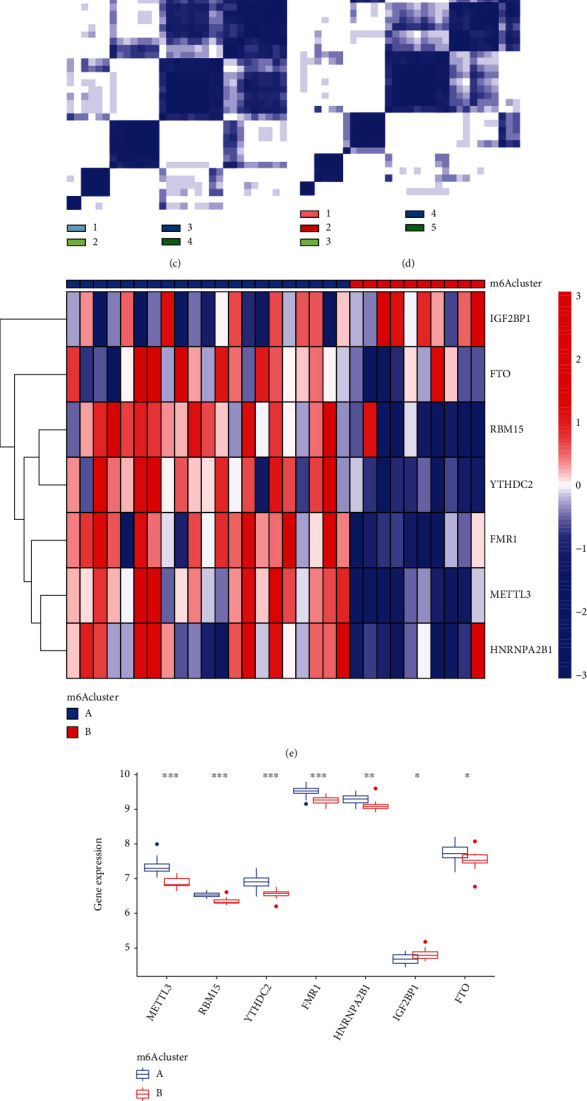
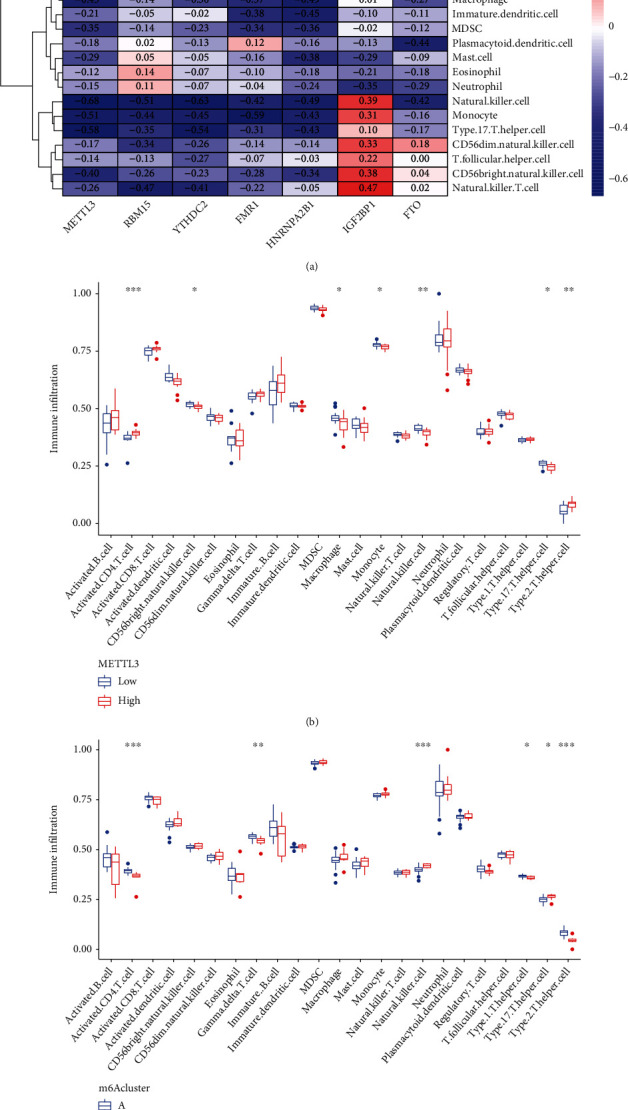
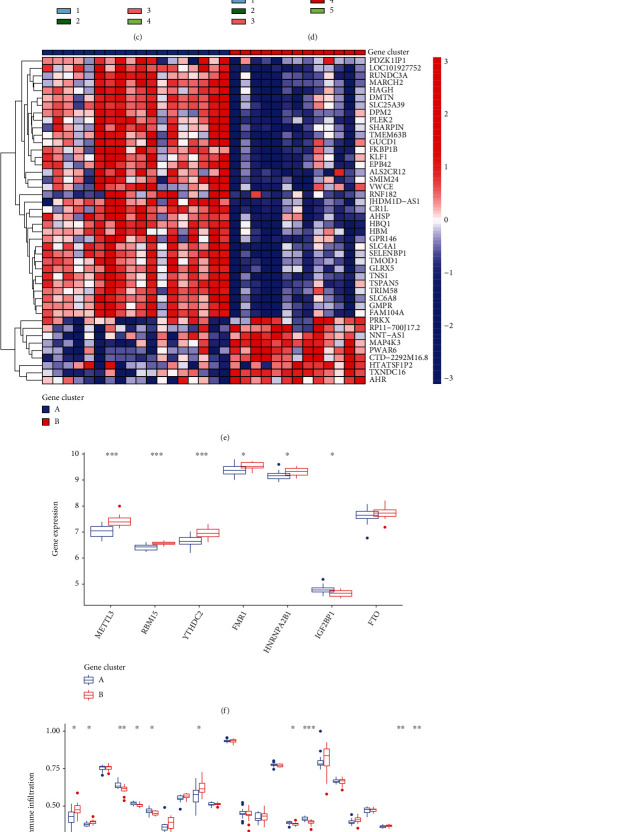
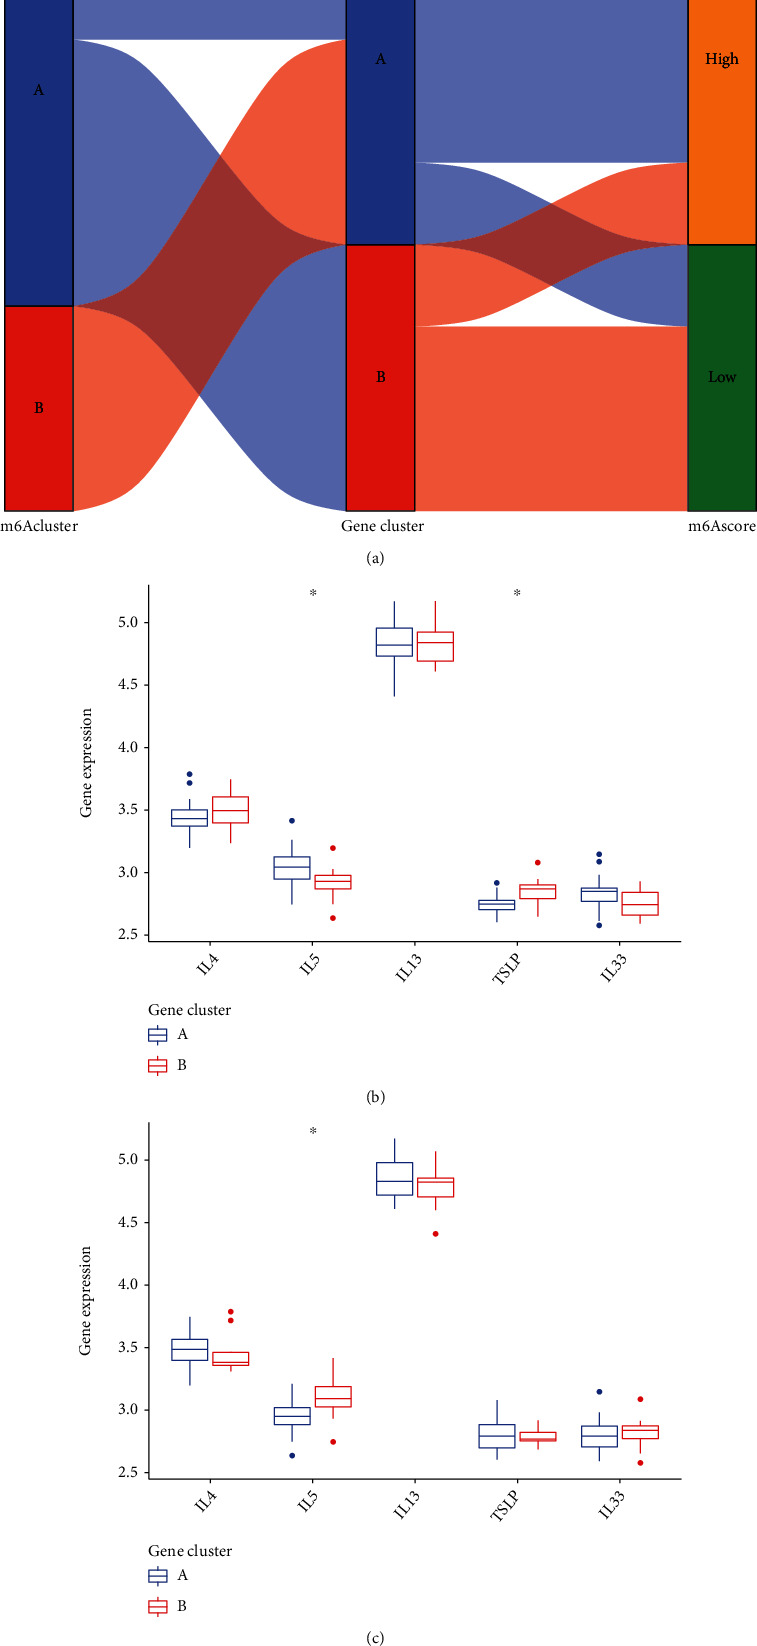
Acute myocardial infarction (AMI) is still a huge danger to human health. Sensitive markers are necessary for the prediction of the risk of AMI and would be beneficial for managing the incidence rate. N6-methyladenosine (m6A) RNA methylation regulators have been confirmed to be involved in the development of various diseases. However, their function in AMI has not been fully elucidated. The purpose of this study was to determine the expression of m6A RNA methylation regulators in AMI as well as their possible functions and prognostic values. The GEO database was used to get the gene expression profiles of patients with and without AMI, and bioinformatics assays of genes with differently expressed expression were performed. We establish two separate m6A subtypes, and relationships between subtypes and immunity were studied. In this study, we identified IGF2BP1, FTO, RBM15, METTL3, YTHDC2, FMR1, and HNRNPA2B1 as the seven major m6A regulators. A nomogram model was developed and confirmed. The consensus clustering algorithm was conducted to categorize AMI patients into two m6A subtypes from the identified m6A regulators. Patients who have activated T-cell activities were found to be in clusterA; they may have a better prognosis as a result. Importantly, we found that patients with high METTL3 expressions had an increased level of Activated.CD4.T.cell and Type.2.T.helper.cell, while having a decreased level of CD56bright.natural.killer.cell, Macrophage, Monocyte, Natural.killer.cell, and Type.17.T.helper.cell. Overall, a diagnostic model of AMI was established based on the genes of IGF2BP1, FTO, RBM15, METTL3, YTHDC2, FMR1, and HNRNPA2B1. Our investigation of m6A subtypes may prove useful in the developments of therapy approaches for AMI.


Conflict of interest statement

The authors declare no conflicts of interest.

Figures

Figure 1
Figure 1
A comparison of the landscape of the m6A regulators that are dysregulated in AMI samples with normal samples. (a) A heat map comparing the levels of expression of the seven m6A regulators in samples from patients with AMI and normal patients. (b) Histogram comparing the dysregulated levels of the seven m6A regulators found in AMI samples with normal samples. (c) Locations on each chromosome of the 26 different m6A regulators.
Figure 2
Figure 2
m6A regulators in AMI's correlation with one another. (a, b) Associations between erasers and writers in AMI.
Figure 3
Figure 3
The development of both the RF model and the SVM model. (a) For the purpose of illustrating the residual distribution of the SVM and RF models, the reverse cumulative distribution of residual was presented. (b) Boxplots of residual were presented in order to illustrate the residual distribution of both models. (c) The correlation between the total number of decision trees and the error rate. (d) In light of the RF model, the significance of the seven m6A regulators is shown. (e) ROC curves showed that both the RF model and the SVM model were accurate.
Figure 4
Figure 4
The diagnostic model of AMI that was developed using the random-forest method is presented in graphical form. (a) A nomogram model was constructed based on the seven candidates for m6A regulators. (b) Abilities of the nomogram model to make accurate predictions as shown by the calibration curve. (c) Patients suffering from AMI may benefit from decisions made using the nomogram model. (d) Evaluation of the clinical impact of the nomogram model using the clinical impact curve.
Figure 5
Figure 5
Clustering according to a consensus of the seven important RNA m6A regulators in AMI. (a–d) Consensus matrices of the seven significant m6A regulators for k = 2–5. (e) Heat map depicting the expression levels of the seven important m6A regulators in both clusterA and clusterB. (F) Histogram comparing the dysregulated levels of the seven important m6A regulators in clusterA and clusterB. (g) The PCA of the seven key m6A regulators reveals a striking dissimilarity in the transcriptomes of the two m6A patterns.
Figure 6
Figure 6
Comparison of the ssGSEA scores. (a) Infiltrating immune cells and the seven major m6A regulators have been found to have a correlation with one another. (b) Differences in the quantity of immune cells invading the tissue between groups with high and low levels of METTL3-associated protein expression. (c) Different patterns of immune cell infiltration were seen in clusterA and clusterB.
Figure 7
Figure 7
Consensus clustering of the 44 m6A-related DEGs in AMI. (a–d) Consensus matrices of the 44 m6A-related DEGs for k = 2–5. (e) Heat map depicting the expression of the 44 m6A-related DEGs that are members of gene clusterA and clusterB. (f) Histogram depicting the dysregulated levels of the 7 important m6A regulators between gene clusterB and gene clusterA. (g) A comparison of gene clusterA and gene clusterB reveals distinct patterns of immune cell infiltration. (h) Score differences on the m6A test between clusterB and clusterA. (i) Score differences on the m6A test comparing gene clusterB to gene clusterA.
Figure 8
Figure 8
The potential ability of m6A patterns in screening AMI. (a) The link between m6A scores, m6A gene patterns, and m6A patterns is illustrated using the Sankey diagram. (b) The levels of five important factors were shown to be significantly different between clusterA and clusterB. (c) Comparison between gene clusterB and gene clusterA with regard to the dysregulated levels of five important factors.

References

    1. Mosterd A., Hoes A. W. Clinical epidemiology of heart failure. Heart . 2007;93(9):1137–1146. doi: 10.1136/hrt.2003.025270. - DOI - PMC - PubMed
    1. Sinnenberg L., Givertz M. M. Acute heart failure. Trends in Cardiovascular Medicine . 2020;30(2):104–112. doi: 10.1016/j.tcm.2019.03.007. - DOI - PubMed
    1. McMurray J. J., Pfeffer M. A. Heart failure. The Lancet . 2005;365(9474):1877–1889. doi: 10.1016/S0140-6736(05)66621-4. - DOI - PubMed
    1. Anderson J. L., Morrow D. A. Acute myocardial infarction. The New England Journal of Medicine . 2017;376(21):2053–2064. doi: 10.1056/NEJMra1606915. - DOI - PubMed
    1. Gulati R., Behfar A., Narula J., et al. Acute myocardial infarction in young individuals. Mayo Clinic Proceedings . 2020;95(1):136–156. doi: 10.1016/j.mayocp.2019.05.001. - DOI - PubMed

MeSH terms