. 2022 May 16;23(2):e00208-21.
doi: 10.1128/jmbe.00208-21. eCollection 2022 Aug.

Student Attitudes Contribute to the Effectiveness of a Genomics CURE

David Lopatto  1 Anne G Rosenwald  2 Rebecca C Burgess  3 Catherine Silver Key  4 Melanie Van Stry  5 Matthew Wawersik  6 Justin R DiAngelo  7 Amy T Hark  8 Matthew Skerritt  9 Anna K Allen  10 Consuelo Alvarez  11 Sara Anderson  12 Cindy Arrigo  13 Andrew Arsham  14 Daron Barnard  15 James E J Bedard  16 Indrani Bose  17 John M Braverman  18 Martin G Burg  19   20 Paula Croonquist  21 Chunguang Du  22 Sondra Dubowsky  23 Heather Eisler  24 Matthew A Escobar  25 Michael Foulk  26 Thomas Giarla  27 Rivka L Glaser  3 Anya L Goodman  28 Yuying Gosser  29 Adam Haberman  30 Charles Hauser  31 Shan Hays  32 Carina E Howell  33 Jennifer Jemc  34 Christopher J Jones  35 Lisa Kadlec  36 Jacob D Kagey  37 Kimberly L Keller  38 Jennifer Kennell  39 Adam J Kleinschmit  40 Melissa Kleinschmit  41 Nighat P Kokan  42 Olga Ruiz Kopp  43 Meg M Laakso  44 Judith Leatherman  45 Lindsey J Long  46 Mollie Manier  47 Juan C Martinez-Cruzado  48 Luis F Matos  49 Amie Jo McClellan  50 Gerard McNeil  51 Evan Merkhofer  52 Vida Mingo  53 Hemlata Mistry  54   55 Elizabeth Mitchell  23 Nathan T Mortimer  56 Jennifer Leigh Myka  57 Alexis Nagengast  55   58 Paul Overvoorde  59 Don Paetkau  60 Leocadia Paliulis  61 Susan Parrish  62 Stephanie Toering Peters  63 Mary Lai Preuss  64 James V Price  43 Nicholas A Pullen  45 Catherine Reinke  65 Dennis Revie  66 Srebrenka Robic  67 Jennifer A Roecklein-Canfield  68 Michael R Rubin  69 Takrima Sadikot  70 Jamie Siders Sanford  71 Maria Santisteban  72 Kenneth Saville  73 Stephanie Schroeder  64 Christopher D Shaffer  74 Karim A Sharif  75 Diane E Sklensky  5 Chiyedza Small  76 Sheryl Smith  77 Rebecca Spokony  78 Aparna Sreenivasan  79 Joyce Stamm  80 Rachel Sterne-Marr  27 Katherine C Teeter  81 Justin Thackeray  82 Jeffrey S Thompson  83 Norma Velazquez-Ulloa  84 Cindy Wolfe  85 James Youngblom  86 Brian Yowler  87 Leming Zhou  88 Janie Brennan  89 Jeremy Buhler  90 Wilson Leung  74 Sarah C R Elgin  74 Laura K Reed  91
Affiliations

Student Attitudes Contribute to the Effectiveness of a Genomics CURE

David Lopatto et al. J Microbiol Biol Educ. .

Abstract

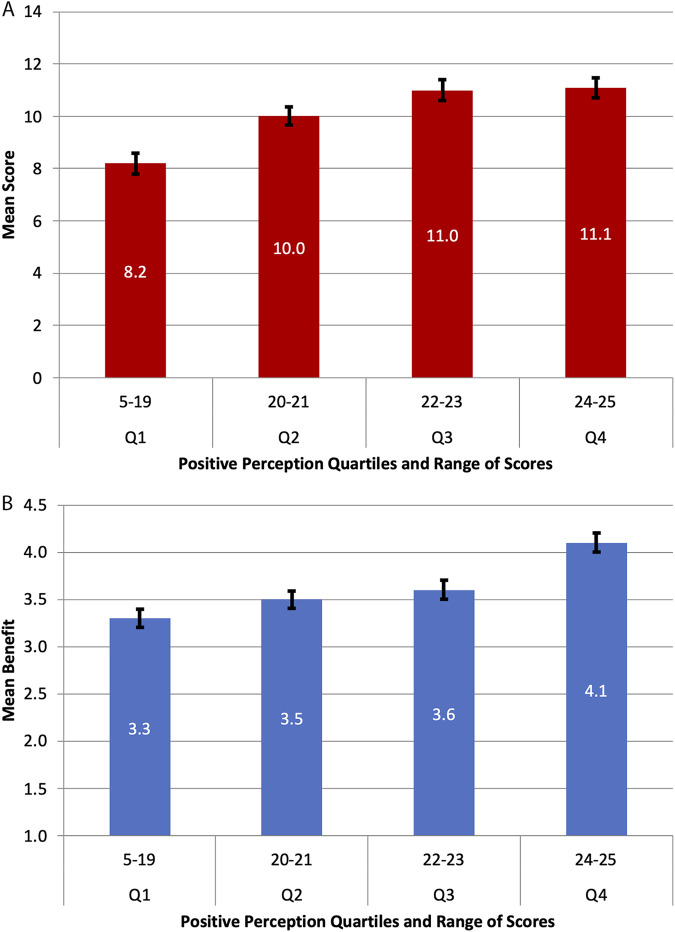
The Genomics Education Partnership (GEP) engages students in a course-based undergraduate research experience (CURE). To better understand the student attributes that support success in this CURE, we asked students about their attitudes using previously published scales that measure epistemic beliefs about work and science, interest in science, and grit. We found, in general, that the attitudes students bring with them into the classroom contribute to two outcome measures, namely, learning as assessed by a pre- and postquiz and perceived self-reported benefits. While the GEP CURE produces positive outcomes overall, the students with more positive attitudes toward science, particularly with respect to epistemic beliefs, showed greater gains. The findings indicate the importance of a student's epistemic beliefs to achieving positive learning outcomes.

Keywords: CUREs; active learning; bioinformatics; genomics; undergraduate education.


Conflict of interest statement

The authors declare no conflict of interest.

Figures

FIG 1
FIG 1
Positive perceptions of science scores differentiate outcome measures. (A and B) The postcourse positive perceptions of science scores were grouped into quartiles to examine the postcourse quiz scores (A) and the postcourse self-reported mean benefits derived from the student survey (B). For each figure, the x axis shows the four quartiles with the range of perceptions scores shown below the bars. (A) A one-way between-groups ANOVA test was performed using the mean quiz scores grouped by positive perceptions quartiles. The result yielded a significant difference between groups (F = 39.1; df = 3, 984; P < 0.001; r2 = 0.10). Pairwise comparisons analyzed via the Tukey honestly significant difference (HSD) test showed that the mean quiz scores for students in quartiles 3 and 4 did not differ from each other, but both were significantly higher than quiz scores for students in quartiles 1 and 2. The mean quiz scores for quartile 2 were significantly higher than the mean quiz scores for quartile 1 (P < 0.05). Error bars represent 2 standard errors of the mean (SEM). (B) A one-way between-groups ANOVA test was performed using the mean self-reported benefits from the postcourse survey grouped by positive perceptions quartiles. The result yielded a significant difference between groups (F = 51.5; df = 3, 1,040; P < 0.001; r2 = 0.13). Pairwise comparisons made with the Tukey HSD test indicated that the mean self-reported benefits for students in quartile 4 were significantly higher than those for students in the other three groups. The means for students in quartiles 3 and 2 were higher than those for quartile 1 students (P < 0.05), but groups 2 and 3 did not differ from each other. Error bars represent 2 SEM.
FIG 2
FIG 2
Negative perceptions of science scores differentiate outcome measures. (A and B) The postcourse negative perceptions of science scores were grouped into quartiles to examine the postcourse quiz scores (A) and the postcourse mean self-reported benefits derived from the student survey (B). For each figure, the x axis shows the four quartiles with the range of negative perceptions scores shown below the bars. (A) A one-way between-groups ANOVA test was performed using the postcourse quiz scores grouped by negative perceptions quartiles. The result yielded a significant difference between groups (F = 54.0; df = 3, 955; P < 0.001; r2 = 0.14). A Tukey HSD pairwise comparison analysis showed that the mean postcourse quiz score for students in quartile 4 (highest score for negative perceptions) was significantly lower than the mean quiz scores for each of the other three groups. The mean for quartile 3 students was significantly lower than the means of each of quartiles 2 and 1, which in turn differed from each other (P < 0.01). Error bars represent 2 SEM. (B) A one-way between-groups ANOVA test was performed using the self-reported benefits from the postcourse survey grouped by negative perceptions quartiles. The result yielded a significant difference between groups (F = 3.14; df = 3, 1,010; P < 0.05; r2 = 0.01). Tukey HSD pairwise comparisons indicated that the mean self-reported benefits score for quartile 3 students was significantly lower than the mean self-reported benefits score for quartile 1 students (P < 0.05). Other differences were not significant. Error bars represent 2 SEM.
FIG 3
FIG 3
TOSRA scores differentiate outcome measures. The groups used here are based on scores from three TOSRA scales, Enjoyment of Science (“enjoyment,” median score of 21 of 25 possible points), Interest in Science Beyond the Classroom (“interest,” median score of 19 of 25 possible points), and Career Interest in Science (“career,” median score of 28 of 35 possible points). To generate a student TOSRA profile, in each case a student receives a 1 for a score below the median or a 2 for a score above the median. Thus, the profile group labeled 3 scored lower than the median on all three scales, while the profile group labeled 6 scored higher than the median on all three scales. The postcourse TOSRA profiles were used to analyze the postcourse quiz scores (A) and the postcourse mean self-reported benefits (B). Finally, mean scores from the two extreme TOSRA profile groups were compared to each other with respect to the individual items on the survey of self-reported benefits (C). (A) A one-way between-groups ANOVA test was performed using the quiz scores grouped by TOSRA profiles. The result yielded a significant difference between groups (F = 17.6; df = 3, 574; P < 0.001; r2 = 0.08). A Tukey HSD test for pairwise differences indicated that the mean postcourse quiz scores for the students with the three higher TOSRA profile scores (4, 5, and 6) were all significantly higher than the mean postcourse quiz scores for students with the lowest TOSRA profile score (P < 0.05) but not different from each other. Error bars represent 2 SEM. (B) A one-way between-groups ANOVA test was performed using the self-reported benefit means grouped by TOSRA profiles. The result yielded a significant difference between groups (F = 5.1; df = 3, 629; P < 0.003; r2 = 0.02). A Tukey HSD for pairwise comparisons indicates that the mean self-reported benefits for students with a profile score of 6 were significantly higher than those for students with a profile score of 3 or 4 (P < 0.05) but not significantly higher than the mean for students with a profile score of 5. Error bars represent 2 SEM. (C) Mean self-reported benefits for students who scored below the median on all three aspects of the postcourse TOSRA survey (resulting in an overall TOSRA score of 3) are shown as red triangles. Mean SURE scores for students who scored above the median on all three aspects of the TOSRA survey (resulting in an overall TOSRA score of 6) are shown as green diamonds. Higher self-reported benefits are reported by the latter group for most items on the survey.
FIG 4
FIG 4
Postcourse quiz scores are not differentiated by Grit score, while self-reported benefits are differentiated by Grit score using the postcourse survey data. (A and B) The postcourse Grit scores were divided into 4 quartiles to permit the comparisons of postcourse quiz scores (A) and comparisons of the postcourse self-reported benefits derived from the student survey (B). Following general practice, the Grit scores are represented as an average score per item (range 1 to 5). The range of Grit scores within a quartile is shown above the quartile label at the bottom of the figures. Error bars represent 2 SEM. (A) A one-way between-groups ANOVA test was performed using the quiz scores grouped by Grit quartiles. The analysis indicated no significant differences. (B) A one-way between-groups ANOVA test was performed using the mean self-reported benefits grouped by Grit quartiles. The result indicates a significant difference between groups (F = 12.4; df = 3, 842; P < 0.001; r2 = 0.04). A Tukey HSD test for pairwise differences indicated that the students in the highest Grit quartile group had mean self-reported benefits scores significantly higher than those of the other three groups (P < 0.03). In addition, the mean for group 3 was higher than the mean for group 1 (P < 0.01). Error bars represent 2 SEM.

References

    1. Lopatto D, Alvarez C, Barnard D, Chandrasekaran C, Chung HM, Du C, Eckdahl T, Goodman AL, Hauser C, Jones CJ, Kopp OR, Kuleck GA, McNeil G, Morris R, Myka JL, Nagengast A, Overvoorde PJ, Poet JL, Reed K, Regisford G, Revie D, Rosenwald A, Saville K, Shaw M, Skuse GR, Smith C, Smith M, Spratt M, Stamm J, Thompson JS, Wilson BA, Witkowski C, Youngblom J, Leung W, Shaffer CD, Buhler J, Mardis E, Elgin SC. 2008. Undergraduate research. Genomics Education Partnership. Science 322:684–685. doi:10.1126/science.1165351. - DOI - PMC - PubMed
    1. Auchincloss LC, Laursen SL, Branchaw JL, Eagan K, Graham M, Hanauer DI, Lawrie G, McLinn CM, Pelaez N, Rowland S, Towns M, Trautmann NM, Varma-Nelson P, Weston TJ, Dolan EL. 2014. Assessment of course-based undergraduate research experiences: a meeting report. CBE Life Sci Educ 13:29–40. doi:10.1187/cbe.14-01-0004. - DOI - PMC - PubMed
    1. Linn MC, Palmer E, Baranger A, Gerard E, Stone E. 2015. Education. Undergraduate research experiences: impacts and opportunities. Science 347:1261757. doi:10.1126/science.1261757. - DOI - PubMed
    1. Rodenbusch SE, Hernandez PR, Simmons SL, Dolan EL. 2016. Early engagement in course-based research increases graduation rates and completion of science, engineering, and mathematics degrees. CBE Life Sci Educ 15:ar20. doi:10.1187/cbe.16-03-0117. - DOI - PMC - PubMed
    1. Bangera G, Brownell SE. 2014. Course-based undergraduate research experiences can make scientific research more inclusive. CBE Life Sci Educ 13:602–606. doi:10.1187/cbe.14-06-0099. - DOI - PMC - PubMed

LinkOut - more resources