. 2022 Aug 19:13:983976.
doi: 10.3389/fpls.2022.983976. eCollection 2022.

Transcriptomic analysis of CO2-treated strawberries (Fragaria vesca) with enhanced resistance to softening and oxidative stress at consumption

Affiliations

Transcriptomic analysis of CO2-treated strawberries (Fragaria vesca) with enhanced resistance to softening and oxidative stress at consumption

Ivan Del Olmo et al. Front Plant Sci. .

Abstract

One of the greatest threats to wild strawberries (Fragaria vesca Mara des Bois) after harvest is the highly perishability at ambient temperature. Breeders have successfully met the quality demands of consumers, but the prevention of waste after harvest in fleshy fruits is still pending. Most of the waste is due to the accelerated progress of senescence-like process after harvest linked to a rapid loss of water and firmness at ambient temperature. The storage life of strawberries increases at low temperature, but their quality is limited by the loss of cell structure. The application of high CO2 concentrations increased firmness during cold storage. However, the key genes related to resistance to softening and cell wall disassembly following transference from cold storage at 20°C remain unclear. Therefore, we performed RNA-seq analysis, constructing a weighted gene co-expression network analysis (WGCNA) to identify which molecular determinants play a role in cell wall integrity, using strawberries with contrasting storage conditions, CO2-cold stored (CCS), air-cold stored (ACS), non-cold stored (NCS) kept at ambient temperature, and intact fruit at harvest (AH). The hub genes associated with the cell wall structural architecture of firmer CO2-treated strawberries revealed xyloglucans stabilization attributed mainly to a down-regulation of Csl E1, XTH 15, Exp-like B1 and the maintenance of expression levels of nucleotide sugars transferases such as GMP and FUT as well as improved lamella integrity linked to a down-regulation of RG-lyase, PL-like and PME. The preservation of cell wall elasticity together with the up-regulation of LEA, EXPA4, and MATE, required to maintain cell turgor, is the mechanisms controlled by high CO2. In stressed air-cold stored strawberries, in addition to an acute softening, there is a preferential transcript accumulation of genes involved in lignin and raffinose pathways. Non-cold stored strawberries kept at 20°C after harvest are characterized by an enrichment in genes mainly involved in oxidative stress and up-expression of genes involved in jasmonate biosynthesis. The present results on transcriptomic analysis of CO2-treated strawberries with enhanced resistance to softening and oxidative stress at consumption will help to improve breeding strategies of both wild and cultivated strawberries.

Keywords: CO2; H2O2; RNA-seq; cell wall; firmness; lignin; strawberries; xyloglucans.


Conflict of interest statement

The authors declare that the research was conducted in the absence of any commercial or financial relationships that could be construed as a potential conflict of interest.

Figures
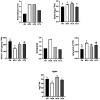
Figure 1
Figure 1
Strawberries with contrasting cold storage conditions exhibiting different senescence-like responses and oxidative stress markers including: ratio of hexoses/sucrose, content of xylose, H2O2 and glutathione (GSH + GSSG reduced plus oxidized glutathione forms), ratio of GSSG/GSH and lignin content. Strawberries immediately after harvest were used as the control sample (AH). Those placed directly in a chamber at 20°C were used as non-cold stored samples (NCS), while the strawberries transferred at 20°C following cold-stored fruit (ACS) or CO2-cold stored fruit (CCS). Graphs represent the average of at least three independent replicates (each one contains 15 fruits). Mean values (n = 3 ± standard deviation). (a-c) For each parameter, mean values with different letters are significantly different (p < 0.05) according to the Tukey’s multiple range test.
Figure 2
Figure 2
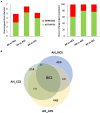
Differentially expressed genes (DEGs) analysis among after harvest (AH) and different cold storage conditions. (A) Percentage of differentially activated or repressed genes at global level or among the comparisons: After harvest (AH) vs. non-cold stored (NCS), AH vs. air-cold stored (ACS) and AH vs. CO2-cold stored (CCS). (B) Venn diagram showing the number of DEGs in the comparisons, AH vs. NCS, AH vs. ACS and AH vs. CCS.
Figure 3
Figure 3
Total gene ontology enrichment. DEGs obtained between after harvest (AH) and non-cold stored (NCS). A Singular Enrichment Analysis (SEA; FDR ≤ 0.05) showing the GO for the most significant biological processes categories obtained comparing AH vs. NCS. (A) Scheme of the total enrichment (TE). (B) Bar chart of overrepresented terms in biological process category. The Y-axis shows the definition of each of the processes included in the first three GO terms annotated. The X-axis is the percentage of genes mapped by the term, and represents the abundance of the GO term. The percentage for the input list is calculated by the number of genes mapped to the GO term divided by the number of all genes in the input list. The same calculation was applied to the reference list to generate its percentage.
Figure 4
Figure 4
Specific gene ontology enrichment. DEGs obtained between after harvest (AH) and non-cold stored (NCS). Bar chart showing in detail the most significant biological processes terms overrepresented obtaining by a Singular Enrichment Analysis (SEA; FDR ≤ 0.05) in AH vs. NCS comparison. The Y-axis shows the definition of GO terms. The X-axis is the percentage of genes mapped by the term, and represents the abundance of the GO term. The percentage for the input list is calculated by the number of genes mapped to the GO term divided by the number of all genes in the input list. The same calculation was applied to the reference list to generate its percentage. These two bars are classificated by a color key showing a green gradient scale for the frequency between both percentages represented.
Figure 5
Figure 5
Specific gene ontology enrichment. DEGs obtained between after harvest (AH) and air-cold stored (ACS). Bar chart showing in detail the most significant biological processes terms overrepresented obtaining by a Singular Enrichment Analysis (SEA; FDR ≤ 0.05) in AH vs. ACS comparison. The Y-axis shows the definition of GO terms. The X-axis is the percentage of genes mapped by the term, and represents the abundance of the GO term. The percentage for the input list is calculated by the number of genes mapped to the GO term divided by the number of all genes in the input list. The same calculation was applied to the reference list to generate its percentage. These two bars are classificated by a color key showing a green gradient scale for the frequency between both percentages represented.
Figure 6
Figure 6
Specific gene ontology enrichment. DEGs obtained between fruit after harvest (AH) and CO2-cold stored (CCS). Bar chart showing in detail the most significant biological processes terms overrepresented obtaining by a Singular Enrichment Analysis (SEA; FDR ≤ 0.05) in AH vs. CCS comparison. The Y-axis shows the definition of GO terms. The X-axis is the percentage of genes mapped by the term, and represents the abundance of the GO term. The percentage for the input list is calculated by the number of genes mapped to the GO term divided by the number of all genes in the input list. The same calculation was applied to the reference list to generate its percentage. These two bars are classificated by a color key showing a green gradient scale for the frequency between both percentages represented.
Figure 7
Figure 7
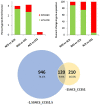
Differentially expressed genes across the different cold storage conditions. (Upper panel) Percentage of differentially activated or repressed genes at global level or among the comparisons: Non-cold stored (NCS) vs. air-cold stored (ACS), NCS vs. CO2-cold stored (CCS) and ACS vs. CO2-cold stored (CCS). (Lower panel) Venn diagram showing the number of DEGs in the comparisons, −1.5 ≥ NCS vs. CCS ≥ 1.5 and-1 ≥ ACS vs. CCS ≥ 1.
Figure 8
Figure 8
Genes differentially expressed at 20°C controlled by high CO2. (A) Heatmaps representing Reads Per Kilobase Million (RPKM) expressed as a relative percentage of the DEGs. Left: DEGs obtained from the intersection between-1.5 ≥ NCS_CCS ≥ 1.5 and-1 ≥ ACS_CCS ≥ 1; right: DEGs with highest change obtained from the intersection between-3 ≥ NCS_CCS ≥ 3 and-1 ≥ ACS_CCS ≥ 1, where a yellow square is indicating which genes are analyzed by qPCR. The table at bottom express the biological process term overrepresented obtaining by a Singular Enrichment Analysis (SEA; FDR ≤ 0.05). (B) Table showing a representative pool of DEGs regulated by high CO2 with its probable function. Relative expression analysis through qPCR (black bars) vs. RPKMs obtained in RNAseq (gray bars) for the genes: (C) FvH4_6g38980 and FvH4_3g36410, that are increasing its expression and (D) FvH4_2g39441 and FvH4_3g40160, that are repressing its expression by the CO2 treatment. Graphs represent the average of at least three independent replicates quantified. Error bars indicate ± SD; One-way ANOVA for relative expression of AH versus NCS, ACS, or CCS value. Adjusted p value (*p ≤ 0.03, **p ≤ 0.002; ***p < 0.001).
Figure 9
Figure 9
Weighted Gene Correlation Network Analysis. (A) Gene cluster dendrogram and module colors assignment for detection of the modules together with the gene significance for body weight (GS. Weight). Colors in the horizontal bar represent the modules. Ten modules with 31,000 transcripts were detected with WGCNA. (B) Eigengene dendrogram with an adjacency heatmap for module-trait (shearing average force, F(N)) relationship, the progressively intensity gradient of blue and red colors are indicating a high co-expression interconnectedness. (C) Module colors heatmap representing Reads Per Kilobase Million (RPKM) expressed as a relative percentage of genes obtained in turquoise (left) and green (right) modules. In the middle is shown the modules significantly correlated with F(N): module membership (MM) turquoise (middle-up) and green (middle-down) vs. GS. Weight. Each point represented an individual gene within each module, which were plotted by GS. Weight on the Y-axis and MM on the X-axis. (D) Heatmap showing the expression of the 910 genes (left) that mostly correlate with strawberry firmness (−0.85 ≥ kME ≥ 0.85), represented as a relative RPKM percentage of the genes correlated. On right a selection of 28 genes analyzed by qPCR.
Figure 10
Figure 10
Specific gene ontology enrichment obtained for firmness using Weighted Gene Correlation Network Analysis. Bar chart showing in detail the most significant molecular function terms overrepresented obtaining by a Singular Enrichment Analysis (SEA; FDR ≤ 0.05) in WGCNA. The Y-axis shows the definition of GO terms. The X-axis is the percentage of genes mapped by the term, and represents the abundance of the GO term. The percentage for the input list is calculated by the number of genes mapped to the GO term divided by the number of all genes in the input list. The same calculation was applied to the reference list to generate its percentage. These two bars are classificated by a color key showing a green gradient scale for the frequency between both percentages represented.
Figure 11
Figure 11
Expression analysis of a group of 28 genes co-expressed by Weighted Gene Correlation Network Analysis. Relative expression analysis through qPCR (black bars) vs. RPKMs obtained in RNAseq (gray bars) for genes involving: (A) metabolism of cellulose and hemicellulose, (B) N-glycosylation processes and cell wall simple sugars and polysaccharides metabolism, (C) pectins metabolism, (D) cell expansion and plant growth (E) and lignin metabolism. Graphs represent the average of at least three independent replicates quantified. Error bars indicate ± SD; One-way ANOVA for relative expression of AH versus NCS, ACS, or CCS value. Adjusted p value (*p ≤ 0.03, **p ≤ 0.002; ***p < 0.001).
Figure 12
Figure 12
Weighted gene co-expression network for firmness of Mara des Bois strawberries at 20°C controlled by high CO2. Network for the genes co-expressed in turquoise and green modules which have a high weight over firmness. The inverse relationship clusters connecting fruit firmness with biotic stress and involving cell wall homeostasis are occupying a central place in the gene expression network. The close-up is highlighted a representative group of genes for both modules analyzed by qPCR.

References

    1. Alvarez M. D., Velarde C., Barrios L., Herranz B. (2020). Understanding the crispy-crunchy texture of raw red pepper and its change with storage time. J. Texture Stud. 51, 120–133. doi: 10.1111/JTXS.12443, PMID: - DOI - PubMed
    1. Badejo A. A., Tanaka N., Esaka M. (2008). Analysis of GDP-D-mannose pyrophosphorylase gene promoter from acerola (Malpighia glabra) and increase in ascorbate content of transgenic tobacco expressing the acerola gene. Plant Cell Physiol. 49, 126–132. doi: 10.1093/PCP/PCM164, PMID: - DOI - PubMed
    1. Bang J., Lim S., Yi G., Lee J. G., Lee E. J. (2019). Integrated transcriptomic-metabolomic analysis reveals cellular responses of harvested strawberry fruit subjected to short-term exposure to high levels of carbon dioxide. Postharvest Biol. Technol. 148, 120–131. doi: 10.1016/j.postharvbio.2018.11.003 - DOI
    1. Barbey C., Hogshead M., Schwartz A. E., Mourad N., Verma S., Lee S., et al. . (2020). The genetics of differential gene expression related to fruit traits in strawberry (Fragaria ×ananassa). Front. Genet. 10:1317. doi: 10.3389/fgene.2019.01317, PMID: - DOI - PMC - PubMed
    1. Blanch M., Álvarez I., Sanchez-Ballesta M. T., Escribano M. I., Merodio C. (2019). Involvement of fatty acids in the response to high CO2 and low temperature in harvested strawberries. Postharvest Biol. Technol. 147, 196–205. doi: 10.1016/j.postharvbio.2018.10.001 - DOI