

Trends in added sugars intake and sources among U.S. adults using the National Health and Nutrition Examination Survey (NHANES) 2001-2018
- PMID: 36061886
- PMCID: PMC9434277
- DOI: 10.3389/fnut.2022.897952
Trends in added sugars intake and sources among U.S. adults using the National Health and Nutrition Examination Survey (NHANES) 2001-2018
Abstract
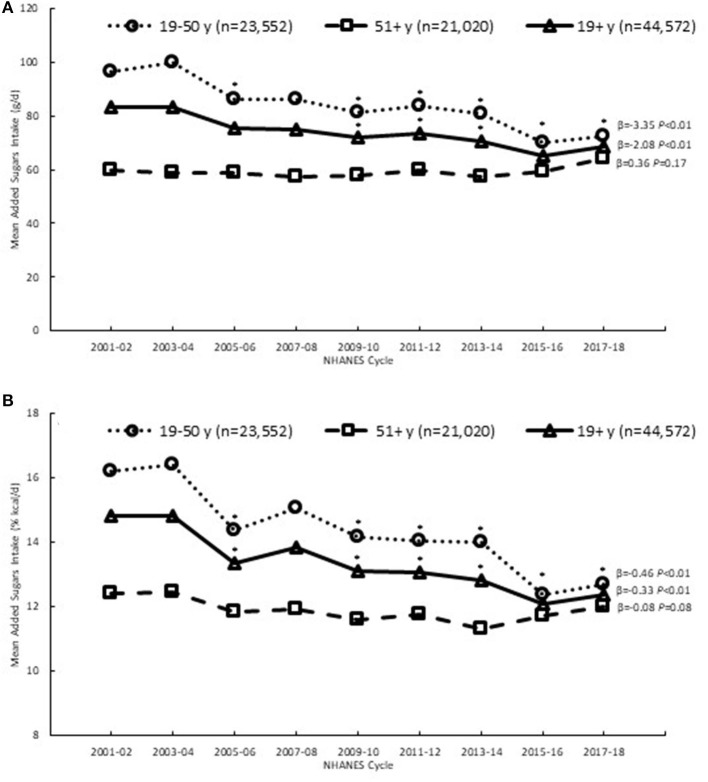
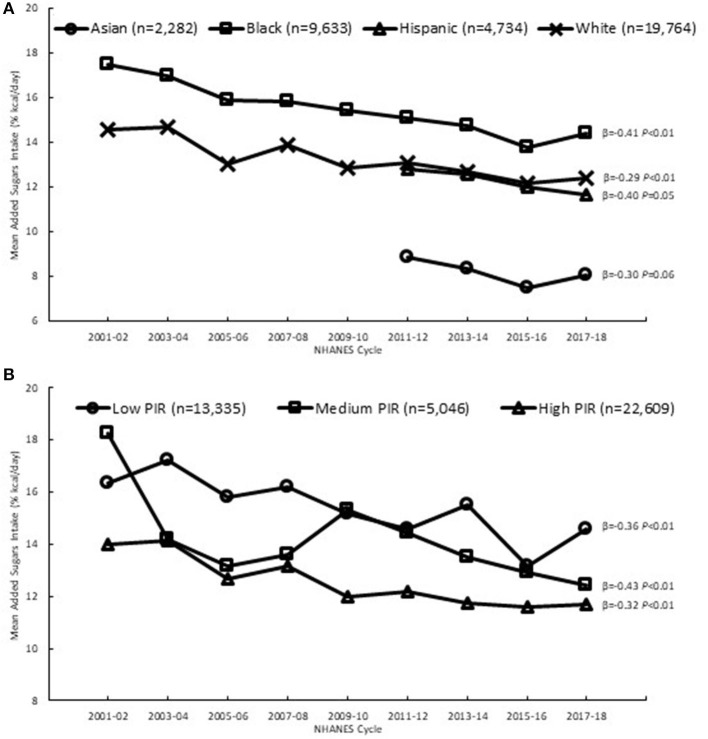
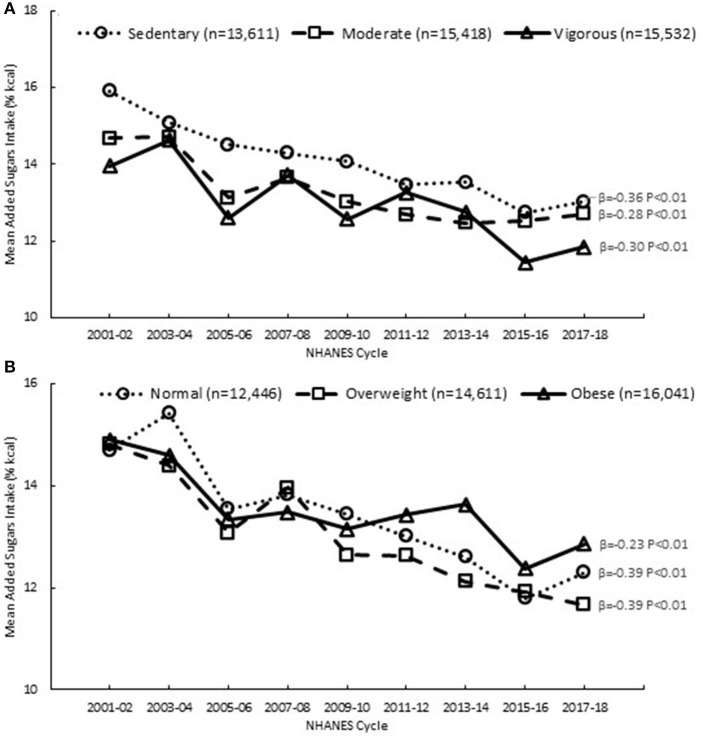
Research on trends over time in added sugars intake is important to help gain insights into how population intakes change with evolving dietary guidelines and policies on reducing added sugars. The purpose of this study was to provide an analysis of dietary trends in added sugars intakes and sources among U.S. adults from 2001 to 2018, with a focus on variations according to the sociodemographic factors, age, sex, race and ethnicity and income, and the health-related factors, physical activity and body weight. Data from nine consecutive 2 year cycles of the National Health and Nutrition Examination Survey (NHANES) were combined and regression analyses were conducted to test for trends in added sugars intake and sources from 2001 to 2018. Trends were examined in the whole sample (19+ years) and in subsamples stratified by age (19-50, 51+ years), sex, race and ethnicity (Asian, Black, Hispanic, White), household income (poverty income ratio low, medium, high), physical activity level (sedentary, moderate, vigorous) and body weight status (normal, overweight, obese). From 2001 to 2018, added sugars intake (% kcal) decreased significantly (P < 0.01), from 16.2 to 12.7% among younger adults (19-50 years), mainly due to declines in added sugars from sweetened beverages, which remained the top source. There were no changes in intake among older adults, and by 2018, the 23% difference in intake between younger and older adults that existed in 2001 almost disappeared. Declines in added sugars intake were similar among Black and White individuals, and all income, physical activity and body weight groups. Population-wide reductions in added sugars intake among younger adults over an 18 year time span coincide with the increasing public health focus on reducing added sugars intake. With the updated Nutrition Facts label now displaying added sugars content, it remains to be seen how added sugars intake trends carry forward in the future.
Keywords: NHANES; U.S.; added sugars; adults; intake; sources; trends.
Copyright © 2022 DiFrancesco, Fulgoni, Gaine, Scott and Ricciuto.
Conflict of interest statement
Authors LD and LR as independent consultants provide nutrition and regulatory consulting to various food manufacturers, commodity groups, and health organizations. Author VF as Vice President of Nutrition Impact, LLC conducts NHANES analyses for numerous members of the food, beverage and dietary supplement industry. Authors PG and MS are employed by The Sugar Association, Inc.
Figures
References
-
- World Health Organization . Guideline: Sugars Intake for Adults and Children. Available online at: http://www.who.int/nutrition/publications/guidelines/sugars_intake/en/ (accessed May 4, 2021). - PubMed
-
- Dietary, Guidelines for Americans (DGA) . Previous Editions of the Dietary Guidelines for Americans. Available online at: https://www.dietaryguidelines.gov/about-dietary-guidelines/previous-edit... (accessed May 4, 2021).
-
- Dietary, Guidelines for Americans (DGA) . The 2020-2025 Edition is Here! Available online at: https://www.dietaryguidelines.gov/ (accessed May 4, 2021).
LinkOut - more resources
Full Text Sources