

Prediction model of early biomarkers of massive cerebral infarction caused by anterior circulation occlusion: Establishment and evaluation
- PMID: 36062018
- PMCID: PMC9433650
- DOI: 10.3389/fneur.2022.903730
Prediction model of early biomarkers of massive cerebral infarction caused by anterior circulation occlusion: Establishment and evaluation
Abstract
Objective: The purpose of this study is to establish and evaluate an early biomarker prediction model of massive cerebral infarction caused by anterior circulation occlusion.
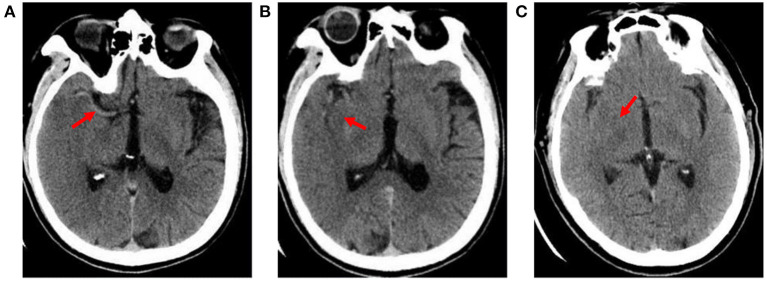
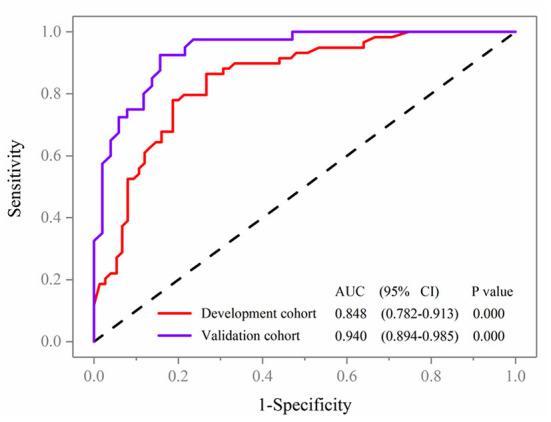
Methods: One hundred thirty-four patients with acute cerebral infarction from January 2018 to October 2020 were selected to establish the development cohort for the internal test of the nomogram. Ninety-one patients with acute cerebral infarction hospitalized in our hospital from December 2020 to December 2021 were constituted the validation cohort for the external validation. All patients underwent baseline computed tomography (CT) scans within 12 h of onset and early imaging signs (hyperdense middle cerebral artery sign, obscuration of the lentiform nucleus, insular ribbon sign) of acute cerebral infarction were identified on CT by two neurologists. Based on follow-up CT images, patients were then divided into a massive cerebral infarction group and a non-massive cerebral infarction group. The nomogram model was constructed based on logistic regression analysis with R language. The nomogram was subsequently validated in an independent external validation cohort. Accuracy and discrimination of the prediction model were evaluated by a calibration chart, receiver operating characteristic (ROC) curve, and decision curve.
Results: The indicators, including insular ribbon sign, reperfusion therapy, National Institutes of Health Stroke Scale (NHISS) score, previous cerebral infarction, and atrial fibrillation, were entered into the prediction model through binary logistic regression analysis. The prediction model showed good predictive ability. The area under the ROC curve of the prediction model was 0.848. The specificity, sensitivity, and Youden index were 0.864, 0.733, and 0.597, respectively. This nomogram to the validation cohort also showed good discrimination (AUC = 0.940, 95% CI 0.894-0.985) and calibration.
Conclusion: Demonstrating favorable predictive efficacy and reproducibility, this study successfully established a prediction model of CT imaging signs and clinical data as early biomarkers of massive cerebral infarction caused by anterior circulation occlusion.
Keywords: CT; anterior circulation occlusion; early imaging signs; massive cerebral infarction; prediction model.
Copyright © 2022 Chen, Li, Xu, Zhang, Qi, Yang, Chen, Wang and Duan.
Conflict of interest statement
The authors declare that the research was conducted in the absence of any commercial or financial relationships that could be construed as a potential conflict of interest.
Figures


Similar articles
-
A CT texture-based nomogram for predicting futile reperfusion in patients with intraparenchymal hyperdensity after endovascular thrombectomy for acute anterior circulation large vessel occlusion.Front Neurol. 2024 Apr 19;15:1327585. doi: 10.3389/fneur.2024.1327585. eCollection 2024. Front Neurol. 2024. PMID: 38708002 Free PMC article.
-
Development and validation of a nomogram for the risk prediction of malignant cerebral edema after acute large hemispheric infarction involving the anterior circulation.Front Neurol. 2023 Sep 14;14:1221879. doi: 10.3389/fneur.2023.1221879. eCollection 2023. Front Neurol. 2023. PMID: 37780698 Free PMC article.
-
[Establishment of a nomogram model for predicting hematoma expansion in intracerebral hemorrhage and its multidimensional evaluation].Zhonghua Yi Xue Za Zhi. 2021 Aug 17;101(31):2471-2477. doi: 10.3760/cma.j.cn112137-20210118-00161. Zhonghua Yi Xue Za Zhi. 2021. PMID: 34399562 Chinese.
-
Establishment and evaluation of a nomogram model for predicting hematoma expansion in hypertensive intracerebral hemorrhage based on clinical factors and plain CT scan signs.Ann Palliat Med. 2021 Dec;10(12):12789-12800. doi: 10.21037/apm-21-3569. Ann Palliat Med. 2021. PMID: 35016444
-
[Risk factors analysis and the development and validation of a clinical prediction model for acute mesenteric ischemia-induced intestinal infarction].Zhonghua Yi Xue Za Zhi. 2022 Dec 20;102(47):3734-3742. doi: 10.3760/cma.j.cn112137-20220421-00875. Zhonghua Yi Xue Za Zhi. 2022. PMID: 36517422 Chinese.
Cited by
-
Editorial: Management of acute stroke with large core.Front Neurol. 2023 Feb 6;14:1135886. doi: 10.3389/fneur.2023.1135886. eCollection 2023. Front Neurol. 2023. PMID: 36815000 Free PMC article. No abstract available.
-
Value of novel thrombotic markers for predicting occurrence of the malignant cerebral artery infarction: a prospective clinical study.Front Neurol. 2023 Nov 30;14:1238742. doi: 10.3389/fneur.2023.1238742. eCollection 2023. Front Neurol. 2023. PMID: 38099069 Free PMC article.
References
LinkOut - more resources
Full Text Sources