. 2022 Oct 21;25(10):105045.
doi: 10.1016/j.isci.2022.105045. Epub 2022 Aug 30.

A microarray patch SARS-CoV-2 vaccine induces sustained antibody responses and polyfunctional cellular immunity

Affiliations

A microarray patch SARS-CoV-2 vaccine induces sustained antibody responses and polyfunctional cellular immunity

Stephen C Balmert et al. iScience. .

Abstract

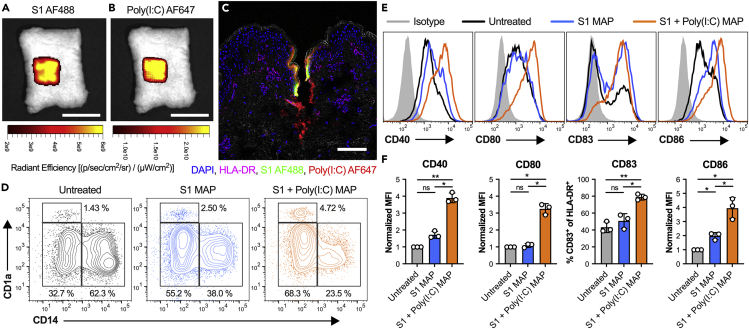
Sustainable global immunization campaigns against COVID-19 and other emerging infectious diseases require effective, broadly deployable vaccines. Here, we report a dissolvable microarray patch (MAP) SARS-CoV-2 vaccine that targets the immunoresponsive skin microenvironment, enabling efficacious needle-free immunization. Multicomponent MAPs delivering both SARS-CoV-2 S1 subunit antigen and the TLR3 agonist Poly(I:C) induce robust antibody and cellular immune responses systemically and in the respiratory mucosa. MAP vaccine-induced antibodies bind S1 and the SARS-CoV-2 receptor-binding domain, efficiently neutralize the virus, and persist at high levels for more than a year. The MAP platform reduces systemic toxicity of the delivered adjuvant and maintains vaccine stability without refrigeration. When applied to human skin, MAP vaccines activate skin-derived migratory antigen-presenting cells, supporting the feasibility of human translation. Ultimately, this shelf-stable MAP vaccine improves immunogenicity and safety compared to traditional intramuscular vaccines and offers an attractive alternative for global immunization efforts against a range of infectious pathogens.

Keywords: Immunology; Medical biotechnology; Virology.


Conflict of interest statement

E. Korkmaz and L.D. Falo Jr. are inventors of related intellectual property. L.D. Falo Jr. is a co-founder and scientific advisor of SkinJect, a company that is developing dissolvable MAPs for treatment of non-melanoma skin cancer.

Figures

None
Graphical abstract
Figure 1
Figure 1
In situ engineering the cutaneous microenvironment with dissolvable MAPs that deliver multicomponent COVID-19 vaccines (A) Intracutaneous vaccination with MAPs harnesses the highly efficient immune circuitry in the skin by precise delivery of antigen and adjuvant. (B) Images of master MAPs. Scale bar is 500 μm. (C–E) Optical stereomicroscopy images of obelisk-shaped CMC MAPs. Scale bars in (C), (D), and (E) are 500, 100, and 25 μm, respectively. (F) Optical stereomicroscopy image of a CMC MAP after application. Scale bar is 500 μm. (G and H) Effective co-delivery of (G) S1 AF488 and (H) Poly(I:C) AF647 to mouse skin in vivo with MAPs, captured using a fluorescence in vivo imaging system (IVIS). Scale bars are 10 mm. (I) Immunofluorescence image with bright-field overlay (gray) shows co-delivery of S1 AF488 (green) and Poly(I:C) AF647 (red) via MAP to the murine abdominal skin microenvironment, replete with MHC-II+ APCs (magenta). Nuclei were stained with DAPI (blue). Scale bar is 100 μm. Separate fluorescence channels and bright-field images are presented in Figure S2.
Figure 2
Figure 2
MAP vaccine-induced antigen-specific antibody responses Mice were immunized using SARS-CoV-2 S1 protein (20 μg) ± Poly(I:C) (100 μg) MAPs or by intramuscular (IM) injection of S1 protein (20 μg) on days 0 and 14. (A and B) SARS-CoV-2 (A) S1 binding and (B) RBD binding total IgG concentrations in serum of immunized mice at 2, 4, and 6 weeks after primary immunization. Total IgG concentrations (log10 transformed) were analyzed by two-way mixed ANOVA, followed by Tukey’s test for time effect (non-significant treatment effect). Results were also compared to naive serum by one-way ANOVA, followed by Dunnett’s test. (C) Serum anti-S1 total IgG was also measured 20, 36, 44, 58, and 77 weeks after primary immunization, as in (A). Data (geometric mean ± SD) are from one of two independent experiments, each with N = 5 mice per group. At each time point, serum antibody levels are compared to those from the same five naive samples. (D) Mice were immunized by S1 ± Poly(I:C) MAPs that were freshly prepared as in (A), or stored for 1 month at room temperature after fabrication, and serum anti-S1 total IgG was measured 2 weeks later. Groups in (C-D) were compared by one-way ANOVA on log10-transformed data, followed by Tukey’s post-hoc tests. (E) Anti-S1 IgG1 serum titers from mice 6 weeks after primary immunization (mean + SD). (F) Anti-S1 IgG1 endpoint titers (geometric mean ± SD) were calculated from titers in (E). (G) Anti-S1 IgG2c serum titers from mice 6 weeks after primary immunization (mean + SD). (H) Anti-S1 IgG2c endpoint titers (geometric mean ± SD) calculated from titers in (G). Data are from one of two independent experiments, each with N = 5 mice per group. Titers in (E) and (G) were compared by two-way mixed ANOVA, followed by Holm-Šidák test of treatment effect. Endpoint titers in (F) and (H) were compared by Kruskal-Wallis test, followed by Dunn’s multiple comparisons. (I) SARS-CoV-2-specific neutralizing antibody titers (ID50) from mice (geometric mean ± SD, N = 5 mice per group) 6 weeks after primary immunization. Groups were compared by one-way ANOVA, followed by Tukey’s test. (J) Intramuscular (IM) injection, but not MAP-mediated delivery, of Poly(I:C) causes a transient, systemic cytokine response. Serum IFN-β, IL-6, and CCL5 concentrations in mice 3, 6, and 12 h after administration of 100 μg Poly(I:C) via IM injection or MAP were measured by ELISAs. Intramuscular PBS injections and Blank MAPs serve as vehicle controls. Results (mean ± SD) are representative from one of two independent experiments, each with N = 5 mice per group. At each time point, groups were compared by one-way ANOVA followed by Tukey’s test, or Welch’s ANOVA followed by Dunnett’s T3 multiple comparisons test. Significant differences are indicated by ∗p < 0.05, ∗∗p < 0.01 or ∗∗∗p < 0.001; ns = not significant (p > 0.05).
Figure 3
Figure 3
Systemic antigen-specific T cell responses (A–E). Mice were immunized using SARS-CoV-2 S1 protein (20 μg) ± Poly(I:C) (100 μg) MAPs or by intramuscular (IM) injection of S1 protein (20 μg) on days 0 and 14, and 5 days later, splenocytes were stimulated with SARS-CoV-2 S1 PepTivator, followed by intracellular cytokine staining and flow cytometry. Representative flow cytometry plots show multifunctional SARS-CoV-2 S1-specific live (A) CD4+ or (B) CD8+ T cells expressing IFN-γ and/or TNF. The associated gating strategy is presented in Figure S3. Frequencies of SARS-CoV-2 S1-specific (C) CD4+ IFN-γ+ TNF+/− IL-2+/− IL-4 T cells (Th1), (D) CD4+ IFN-γ TNF+ IL-2+/− IL-4 T cells (IFN-γ effector T cells), and (E) CD8+ IFN-γ+ TNF+/− IL-2+/− IL-4 T cells (Tc1) are shown. Additional T cell subsets are presented in Figure S4. Cytokine positive T cell frequencies are presented after subtracting background responses detected in corresponding unstimulated splenocyte samples, and results (mean ± SD) are representative from one of two independent experiments, each with N = 5 mice per group. Groups were compared by one-way ANOVA, followed by Tukey’s test, and significant differences are indicated by ∗p < 0.05, ∗∗p < 0.01, ∗∗∗p < 0.001; ns = not significant (p > 0.05).
Figure 4
Figure 4
Antigen-specific T cell responses in lungs (A–E). Mice were immunized using SARS-CoV-2 S1 protein (20 μg) ± Poly(I:C) (100 μg) MAPs or by intramuscular (IM) injection of S1 protein (20 μg) on days 0 and 14. Five days later, lymphocytes isolated from the lungs of immunized mice and naive controls were stimulated with SARS-CoV-2 S1 PepTivator, followed by intracellular cytokine staining and flow cytometry. Representative flow cytometry plots show multifunctional SARS-CoV-2 S1-specific live (A) CD4+ or (B) CD8+ T cells expressing IFN-γ and/or TNF. The associated gating strategy is presented in Figure S6. Frequencies of SARS-CoV-2 S1-specific (C) CD4+ IFN-γ+ TNF+/− IL-2+/− IL-4 T cells (Th1), (D) CD4+ IFN-γ TNF+ IL-2+/− IL-4 T cells (CD4+ IFN-γ effector T cells), and (E) CD8+ IFN-γ+ TNF+/− IL-2+/− IL-4 T cells (Tc1). Additional T cell subsets are presented in Figure S7. Cytokine positive T cell frequencies are presented after subtracting background responses detected in corresponding unstimulated controls, and results (mean ± SD) are representative from one of two independent experiments, each with N = 5 mice per group. Groups were compared by one-way ANOVA, followed by Tukey’s test, and significant differences are indicated by ∗p < 0.05, ∗∗p < 0.01, ∗∗∗p < 0.001; ns = not significant (p > 0.05).
Figure 5
Figure 5
Dissolvable MAP delivery of a multicomponent SARS-CoV-2 vaccine to human skin (A and B). IVIS fluorescence imaging confirms co-delivery of (A) AF488-labeled SARS-CoV-2 S1 and (B) AF647-labeled Poly(I:C) to human skin via MAPs. Images were acquired immediately after application and removal of MAP, and scale bars are 10 mm. (C) Immunofluorescence image with bright-field overlay (gray) shows co-delivery of S1 AF488 (green) and Poly(I:C) AF647 (red) via MAP to the human skin microenvironment, replete with HLA-DR+ APCs (magenta). Sections were counterstained with DAPI (blue), and the scale bar is 100 μm. Separate fluorescence channels and bright-field images are presented in Figure S9. (D) Representative flow cytometry plots of total live HLA-DR+ cells migrating from human skin explants within 48 h of treatment. Gates show frequencies of CD1a++ LC, CD1a+ dermal DC, and CD14+ dermal monocyte-derived DC subsets. The associated gating strategy is presented in Figure S10. (E) Representative histograms show expression of co-stimulatory receptors on total live HLA-DR+ cells migrating from human skin explants. (F) Relative expression of co-stimulatory receptors by total live HLA-DR+ cells from three independent experiments (different skin donors; mean ± SD). Median fluorescence intensity (MFI) values are normalized to those for cells from untreated skin from the same experiment. Because the expression pattern for CD83 is bimodal, percentages of CD83+ cells are presented instead of normalized MFI. Groups were compared by one-way repeated measures ANOVA with Geisser-Greenhouse correction, followed by Tukey’s test. ∗p < 0.05, ∗∗p < 0.01, ns = not significant.

Similar articles

Cited by

References

    1. Al-Zahrani S., Zaric M., McCrudden C., Scott C., Kissenpfennig A., Donnelly R.F. Microneedle-mediated vaccine delivery: Harnessing cutaneous immunobiology to improve efficacy. Expert Opin. Drug Deliv. 2012;9:541–550. doi: 10.1517/17425247.2012.676038. - DOI - PMC - PubMed
    1. Arya J., Prausnitz M.R. Microneedle patches for vaccination in developing countries. J. Control. Release. 2016;240:135–141. doi: 10.1016/j.jconrel.2015.11.019. - DOI - PMC - PubMed
    1. Balmert S.C., Carey C.D., Falo G.D., Sethi S.K., Erdos G., Korkmaz E., Falo L.D. Dissolving undercut microneedle arrays for multicomponent cutaneous vaccination. J. Control. Release. 2020;317:336–346. doi: 10.1016/j.jconrel.2019.11.023. - DOI - PMC - PubMed
    1. Bandyopadhyay M., Morelli A.E., Balmert S.C., Ward N.L., Erdos G., Sumpter T.L., Korkmaz E., Kaplan D.H., Oberbarnscheidt M.H., Tkacheva O. Skin co-delivery of contact sensitizers and neurokinin-1 receptor antagonists integrated in microneedle arrays suppresses allergic contact dermatitis. J. Allergy Clin. Immunol. 2022;150:114–130. doi: 10.1016/j.jaci.2021.12.794. - DOI - PMC - PubMed
    1. Bardel E., Doucet-Ladeveze R., Mathieu C., Harandi A.M., Dubois B., Kaiserlian D. Intradermal immunisation using the TLR3-ligand Poly (I:C) as adjuvant induces mucosal antibody responses and protects against genital HSV-2 infection. NPJ Vaccines. 2016;1:16010. doi: 10.1038/npjvaccines.2016.10. - DOI - PMC - PubMed

LinkOut - more resources