. 2022 Oct 18;28(58):e202201490.
doi: 10.1002/chem.202201490. Epub 2022 Sep 26.

Harnessing Water to Enhance Quadrupolar NMR Spectroscopy and Imaging

Affiliations

Harnessing Water to Enhance Quadrupolar NMR Spectroscopy and Imaging

Ricardo P Martinho et al. Chemistry. .

Abstract

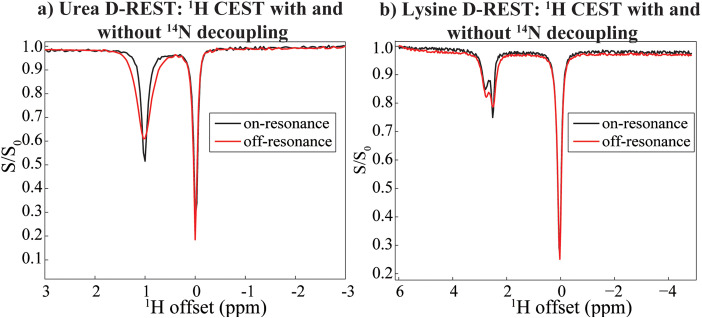
17 O and 14 N are attractive targets for in vivo NMR spectroscopy and imaging, but low gyromagnetic ratios γ and fast spin relaxation complicate observations. This work explores indirect ways of detecting some of these sites with the help of proton-detected double resonance techniques. As standard coherence transfer methods are of limited use for such indirect detection, alternative routes for probing the quadrupolar spectra on 1 H were tested. These centered on modulating the broadening effects imparted onto protons adjacent to the low-γ species through J couplings through either continuous wave or spin-echo double-resonance decoupling/recoupling sequences. As in all cases, the changes imparted by these double-resonance strategies were small due to the fast relaxation undergone by the quadrupoles, the sensitivity of these approaches was amplified by transferring their effects onto the abundant water 1 H signal. These amplifications were mediated by the spontaneous exchanges that the labile 1 Hs bound to 17 O or 14 N undergo with the water protons. In experiments designed on the basis of double-resonance spin echoes, these enhancements were imparted by looping the transverse encodings together with multiple longitudinal storage periods, leading to decoupling-recoupling with exchange (D-REX) sequences. In experiments designed on the basis of continuous on/off quadrupolar decoupling, these solvent exchanges were incorporated into chemical-exchange saturation transfer schemes, leading to decoupling-recoupling with saturation transfer (D-REST) sequences. Both of these variants harnessed sizable proportions of the easily detectable water signals, in order to characterize the NMR spectra and/or to image with atomic-site specificity the 17 O and 14 N species.

Keywords: chemical exchange; low-gamma MRI; quadrupolar NMR spectroscopy; sensitivity enhancement; water detection.


Conflict of interest statement

The authors declare no conflict of interest.

Figures

Figure 1
Figure 1
Pulse sequences considered in this work to highlight quadrupolar nuclei S bound to labile 1Hs on the water resonance. a) Spin echo (SE) scheme based on the work of Ronen et al., in which S‐decoupling is/is not applied during an echo time TE and the difference on water is observed. b) D‐REX, a FLEX‐inspired scheme in which the S‐spin is/is not highlighted with either hard pulses or with S‐decoupling, and the whole module is repeated N times to port the S‐encoding thus imparted from the S‐bound proton to the water, as driven by exchanges happening during a mixing time t mix. S‐encoding modes were based on either SEDOR, that is, on applying a series of π pulses i=1 times (as in BIRD [51] ), and i=4 or i=8 times using xy‐4 or xy‐8 phase cyclings. The S‐effects were also introduced by using a continuous decoupling (CW) scheme; this included an i=0 case representing a jump−return (JR) sequence in which τ comprises the full time in between π/2 pulses. c) D‐REST, a saturation transfer scheme in which an RF pulse is applied on protons for a selective saturation, while an S‐decoupling sequence is/is not applied on the S‐spin.
Figure 2
Figure 2
Analytical calculations of the signals resulting from the sequences introduced in Figure 1a, b for 17O in natural‐abundance water. T Q=4.4 ms, J=91 Hz, k sw=555 Hz, T 1,w 1.41 s, T 2=41 ms (akin to gray matter [54] ) or 500 ms (as in CSF). a) Simulation expected for the spin‐echo 17O‐encoded signal. b) Expectations for the 17O‐encoded D‐REX sequence and Equation (4), for t mix=10 ms, τ=1.6 ms, and optimization as in Figure S1. In (a) and (b), the responses account for the 17O natural abundance. c) Calculation of the D‐REST effect upon 14N‐encoding a dilute, 20 mM metabolite modeled on an amino acid,[47,48] with an exchange rate of 200 Hz, T Q=1 ms, J=62 Hz, T 1,w=1.41 s, T 2,H=60 ms, 99.6 % natural abundance. The dependence of this effect on the proton saturation field for a 2 s long CW pulse was explored, and the effect was combined with the overall CEST effect.
Figure 3
Figure 3
Optimization of the different parameters regulating 17O‐encoded D‐REX, conducted on a 50 : 50 mixture of water and [D6]DMSO where water was enriched with 25 % 17O. All the experiments were acquired at 7 T and 24 °C with an 17O RF field of 846 Hz. a) Optimization of τ, with N=100, t mix=15 ms, for the different D‐REX modes described. b) Optimization of t mix, with τ=2 ms, and N=100. A t mix of 20 ms was estimated as optimal. c) Optimization of N, with t mix=20 ms and τ=2 ms. b) and c) were run with the JR‐based D‐REX, which in the best case achieved an ∼11 % contrast on the 1H water signal. Also included in this panel is a simulation based on water's H2 17O quadrupolar parameters, an exchange rate k sw=50 Hz, T 1,w=2 s, T 2,H=0.65 s, and other parameters as in the experiment itself.
Figure 4
Figure 4
Comparisons between the enhancements afforded by 17O‐encoded SE experiments at different echo times TE (a and c), and by 17O‐encoded D‐REX for different N loop numbers (b and d). For the latter, a JR version of D‐REX was employed. Experiments were conducted on the same sample as in Figure 3, at 7 T and 37 °C with the indicated parameters.
Figure 5
Figure 5
Indirect chemical shift mapping of the 17O NMR spectrum for a) the sample introduced in Figure 3 and b) 10 % natural abundance water in 90 % D2O. Both spectra involved a point‐by‐point scanning of the 17O offset over 70 ppm in increments of 1 ppm, where each point corresponds to one scan, normalized by the first point (which is considered as off‐resonance for 17O). A JR 17O‐encoded D‐REX sequence was used in both cases with the indicated parameters, in ∼10 min each (7 T field, 24 °C).
Figure 6
Figure 6
Images resulting from xy‐8‐based 17O‐encoded D‐REX, with the final pulse in Figure 1b replaced by a RARE detection (RARE‐factor=8). a) Experiments performed on the sample introduced in Figure 3, with τ=4 ms, t mix=20 ms, N=80, slice thickness=3 mm, in‐plane resolution=150x300 μm2, 64 phase encodes, 1 scan per phase encode, acquisition time of 3 min 12 s. b) Experiments on an extracted brain immersed in Fluorinert, conducted with τ=0.6 ms, t mix=20 ms, N=40, slice thickness=5 mm, in‐plane resolution=313x313 μm2, 64 phase encodes, 8 scans per phase encode, acquisition time of 18 min 8 s. Both experiments employed a decoupling field of 424 Hz and were performed at 7 T and 24 °C.
Figure 7
Figure 7
14N‐encoded D‐REX experiments on a 1.86 M, pH 1 glycine solution in 10 % D2O at 7 T and 24 °C, with a JR‐CW version of D‐REX. N was optimized with on‐resonance decoupling at 10 ppm with a field of 300 Hz; a) the two individual spectra and b) the difference. Experiments were performed with optimized t mix=15 ms and τ=5.2 ms, with a ∼5 % contrast on the 1H water signal being observed.
Figure 8
Figure 8
D‐REST experiments detecting a low‐γ 14N nucleus on the abundant 1H signal of water (set to 0 ppm). a) Comparison of on‐ and off‐resonance CW decoupling on the CEST spectral mapping of a 200 mM urea sample at pH=7.1; an RF field of 10 Hz was applied for 1 s for the proton saturation. The on and off experiments involved 14N decoupling at 0 and at 450 ppm from the urea 14N resonance, respectively. b) Idem for a 1 M lysine sample at pH 2.0, with a proton ω1 of 10 Hz applied for 1 s for saturation, and 14N decoupling applied at 21 and 471 ppm for the on/off experiments (lysine's 14Nϵ resonating was the only one identified at 20.6 ppm) All experiments were performed at 7 T and 24 °C and employed decoupling nutation fields of 1.4 kHz, 1 scan per 1H offset, and a 1H offset incremented in 0.1 ppm steps.
Figure 9
Figure 9
a) 14N chemical shift mapping in the urea sample introduced in Figure 8, arising from stepping the 14N decoupling frequency in a D‐REST experiment over 250 ppm in 2 ppm steps. For all steps, the urea protons were saturated with a 10 Hz field at +1 ppm downfield from water, and a 1H water spectrum was collected thereafter. b) D‐REST experiment targeting a urea/lysine/alanine phantom, incorporating a RARE block as signal acquisition. Lysine and urea were as in Figure 8; alanine was present at 100 mM and pH 2.2. The NH2 ϵ 1H resonance of lysine was saturated with a field of 16 Hz on resonance at +2.6 ppm, and performed as a difference experiment between 14N on‐resonance decoupling at 28.8 ppm and an off‐resonance decoupling spectrum, slice thickness=2 mm, in‐plane resolution=117×117 μm2, 128 phase encodes, 1 scan per phase encode, RARE factor of 8, acquisition time of 1 min 4 s. All remaining conditions were as in Figure 8.

Similar articles

Cited by

References

    1. van der Graaf M., Eur. Biophys. J. 2010, 39, 527–540. - PMC - PubMed
    1. R. A. de Graaf, In Vivo NMR Spectroscopy: Principles and Techniques, 3rd ed., Wiley, 2019.
    1. J. Cavanagh, W. J. Fairbrother, A. G. Palmer III, M. Rance, N. J. Skelton, Protein NMR Spectroscopy, Elsevier, 2007.
    1. Pegg D. T., Doddrell D. M., Brooks W. M., Robin Bendall M., J. Magn. Reson. 1981, 44, 32–40.
    1. Eykyn T. R., Philp D. J., Kuchel P. W., Chem. Phys. Lett. 2003, 376, 732–736.