. 2022 Nov 1;54(11):417-432.
doi: 10.1152/physiolgenomics.00104.2022. Epub 2022 Sep 5.

Global phosphoproteomic profiling of skeletal muscle in ovarian hormone-deficient mice

Affiliations

Global phosphoproteomic profiling of skeletal muscle in ovarian hormone-deficient mice

Mina P Peyton et al. Physiol Genomics. .

Abstract

Protein phosphorylation is important in skeletal muscle development, growth, regeneration, and contractile function. Alterations in the skeletal muscle phosphoproteome due to aging have been reported in males; however, studies in females are lacking. We have demonstrated that estrogen deficiency decreases muscle force, which correlates with decreased myosin regulatory light chain phosphorylation. Thus, we questioned whether the decline of estrogen in females that occurs with aging might alter the skeletal muscle phosphoproteome. C57BL/6J female mice (6 mo) were randomly assigned to a sham-operated (Sham) or ovariectomy (Ovx) group to investigate the effects of estrogen deficiency on skeletal muscle protein phosphorylation in a resting, noncontracting condition. After 16 wk of estrogen deficiency, the tibialis anterior muscle was dissected and prepped for label-free nano-liquid chromatography-tandem mass spectrometry phosphoproteomic analysis. We identified 4,780 phosphopeptides in tibialis anterior muscles of ovariectomized (Ovx) and Sham-operated (Sham) control mice. Further analysis revealed 647 differentially regulated phosphopeptides (Benjamini-Hochberg adjusted P value < 0.05 and 1.5-fold change ratio) that corresponded to 130 proteins with 22 proteins differentially phosphorylated (3 unique to Ovx, 2 unique to Sham, 6 upregulated, and 11 downregulated). Differentially phosphorylated proteins associated with the sarcomere, cytoplasm, and metabolic and calcium signaling pathways were identified. Our work provides the first global phosphoproteomic analysis in females and how estrogen deficiency impacts the skeletal muscle phosphoproteome.

Keywords: AMPK; YAP; estrogen; females; ovariectomy.


Conflict of interest statement

No conflicts of interest, financial or otherwise, are declared by the authors.

Figures
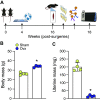
Figure 1.
Figure 1.
Experimental design and mouse characteristics. Female mice were assigned to a surgical group and underwent their respective surgeries, Sham or ovariectomy, with body and uterine mass measured 16 wk later at the time of euthanization. A: schematic of experimental design. Vaginal cytology was performed 4 wk after surgeries. At 16 wk, tibialis anterior muscles were dissected and digested with trypsin for peptide extraction. The lysate underwent TiO2 phosphopeptide enrichment for label-free phosphoproteomic analysis, and nLC-MS/MS was performed on the Orbitrap Fusion Tribrid mass spectrometer. B and C: body mass (P < 0.001; B) and uterine mass (P < 0.001; C) of Sham and Ovx mice. Data were analyzed by a Student’s t test (Sham vs. Ovx); n = 4/group. Values represent means ± SD. *Significantly different from Sham. Ovx, ovariectomized; Sham, Sham-operated. [Image created with BioRender and published with permission.]
Figure 2.
Figure 2.
Characteristics of the phosphoproteome. Proteome Discoverer (v2.4) was used for database search and identification of phosphopeptides and phosphoprotein analysis. A: Venn diagram of all identified phosphopeptides identified in muscle from Sham and Ovx mice. B: pie chart of modification sites, proportion of phosphorylation on residues serine (S), threonine (T), and tyrosine (Y) in the data set. C: volcano plot of differentially regulated phosphopeptides. Green and red dots represent downregulated and upregulated significantly regulated phosphopeptides (Benjamini–Hochberg adjusted P value < 0.05 and 1.5-fold change ratio), respectively, whereas black dots represent nonsignificant phosphopeptides. D: significantly regulated phosphopeptides were mapped back to their precursor proteins. The list of phosphoproteins was submitted to Heatmapper. Heatmap of 130 phosphoproteins clustered according to average linkage using Pearson correlation. Color scheme represents log2 ratio of each phosphoprotein for each biological sample. Gray = missing data. Ovx, ovariectomized; Sham, Sham-operated.
Figure 3.
Figure 3.
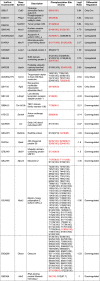
Significantly and differentially phosphorylated phosphoproteins and phosphosites in Ovx relative to Sham mice. Note: the red font denotes a significantly and differentially regulated phosphosite. Ovx, ovariectomized; Sham, Sham-operated.
Figure 4.
Figure 4.
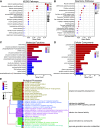
KEGG, Reactome, and GO term enrichment analyses. Differentially regulated phosphopeptides that were quantified in at least three biological replicates or absent in all biological replicates (unique phosphopeptides) in at least one group were mapped back to their precursor protein, and the list of phosphoproteins was submitted for enrichment analysis using the R package clusterprofiler. A and B: the top 15 pathways overrepresented in the data set are shown in KEGG (A) and Reactome pathways (B). C–E: overrepresented GO terms in molecular function (C) and cellular component (D) in the data set and overrepresented GO terms in biological process (E) with hierarchical clustering according to average linkage to identify the top five clusters are presented. GO, Gene Ontology; KEGG, Kyoto Encyclopedia of Genes and Genomes.
Figure 5.
Figure 5.
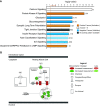
Changes in canonical metabolic pathways and calcium signaling pathways induced by ovariectomy. Phosphopeptides identified in the data set were submitted to IPA’s Downstream Effects analytics, and prediction algorithm to analyze molecules associated with IPA’s annotated canonical pathways. A: the top 10 significantly associated canonical pathways from the data set and predicted inhibition or activation state, with a −2.0 ≥ Z-score ≥ 2.0, respectively. B: calcium signaling pathway in a resting, i.e., noncontracting muscle cell and the phosphorylation state of proteins from the data set is illustrated. Decreases or increases in protein phosphorylation measurements from Ovx muscle relative to Sham muscles are shown in green and red, respectively. IPA, Ingenuity Pathway Analysis; Ovx, ovariectomized; Sham, Sham-operated.
Figure 6.
Figure 6.
Changes in molecular, cellular, and physiological system development functional analyses in estrogen-deficient mice. Phosphopeptides identified in the data set were submitted to IPA’s Downstream Effects analytics and activation Z-score prediction algorithm to analyze and predict molecular and cellular functions and physiological system development and functions. A: the top 10 significantly enriched IPA functional parent groups from the data set are summarized. B–E: significant inhibition (−2.0 ≥ Z-score) or significant activation (Z-score ≥ 2.0) of subfunctions predicted from the data set are shown in contractility of muscle (B), formation of phagosomes (C), formation of vesicles (D), and disruption in cytoskeleton (E). The number in the molecule symbol denotes the number of phosphopeptides observed in the data set for the identified molecule. Green and red color of the molecule represents decreased or increased phosphorylation measurement of the protein in Ovx relative to Sham mice, and the glow around the molecules indicates their activity status when opposite to the phosphoprotein measurement. The blue and orange color of a subfunction or molecule represents the activation status, inhibition or activation, respectively. The color, orange, blue, yellow, or gray, of the edge (line) predicts the relationship between the two nodes (molecules), indicating activation, inhibition, inconsistent, or no prediction, respectively. The arrowhead or inhibition line at the end of the edge reflects the relationship proportionality (i.e., the inhibition line reflects the inverse proportionality, and the arrowhead reflects direct proportionality between two nodes). IPA, Ingenuity Pathway Analysis; Ovx, ovariectomized; Sham, Sham-operated.
Figure 7.
Figure 7.
Upstream kinases affecting the phosphoproteome in Ovx mice. Note: decreased or increased phosphorylation measurements of the target molecule are represented by green and red font color, respectively. Ovx, ovariectomized.
Figure 8.
Figure 8.
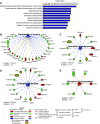
β-Estradiol (E2) mechanistic network. Phosphopeptides identified in the data set were submitted to IPA’s activation Z-score prediction algorithm to predict kinase activity inferred from the Ovx/Sham data set. A mechanistic network of E2 and its relationship to other regulators and the data set was created. The number in the upper right box next to the molecule denotes the number of phosphopeptides observed in the data set for the molecule. E2 inhibition was predicted from the expression profile of nine molecules observed in our phosphoproteomics data set (circled in black). See Fig. 6 for explanation of color scheme, edges, and nodes. IPA, Ingenuity Pathway Analysis; Ovx, ovariectomized; Sham, Sham-operated.

Comment in

References

    1. Ubersax JA, Ferrell JE Jr.. Mechanisms of specificity in protein phosphorylation. Nat Rev Mol Cell Biol 8: 530–541, 2007. [Erratum in Nat Rev Mol Cell Biol 8: 665, 2007]. doi:10.1038/nrm2203. - DOI - PubMed
    1. Mann M, Jensen ON. Proteomic analysis of post-translational modifications. Nat Biotechnol 21: 255–261, 2003. doi:10.1038/nbt0303-255. - DOI - PubMed
    1. Cohen P. The role of protein phosphorylation in human health and disease. Eur J Biochem 268: 5001–5010, 2001. doi:10.1046/j.0014-2956.2001.02473.x. - DOI - PubMed
    1. Lemeer S, Heck AJ. The phosphoproteomics data explosion. Curr Opin Chem Biol 13: 414–420, 2009. doi:10.1016/j.cbpa.2009.06.022. - DOI - PubMed
    1. Kalyani RR, Corriere M, Ferrucci L. Age-related and disease-related muscle loss: the effect of diabetes, obesity, and other diseases. Lancet Diabetes Endocrinol 2: 819–829, 2014. doi:10.1016/S2213-8587(14)70034-8. - DOI - PMC - PubMed

Publication types

LinkOut - more resources