. 2022 Oct 1;54(10):389-401.
doi: 10.1152/physiolgenomics.00063.2022. Epub 2022 Sep 5.

Integrated genomics approaches identify transcriptional mediators and epigenetic responses to Afghan desert particulate matter in small airway epithelial cells

Affiliations

Integrated genomics approaches identify transcriptional mediators and epigenetic responses to Afghan desert particulate matter in small airway epithelial cells

Arnav Gupta et al. Physiol Genomics. .

Abstract

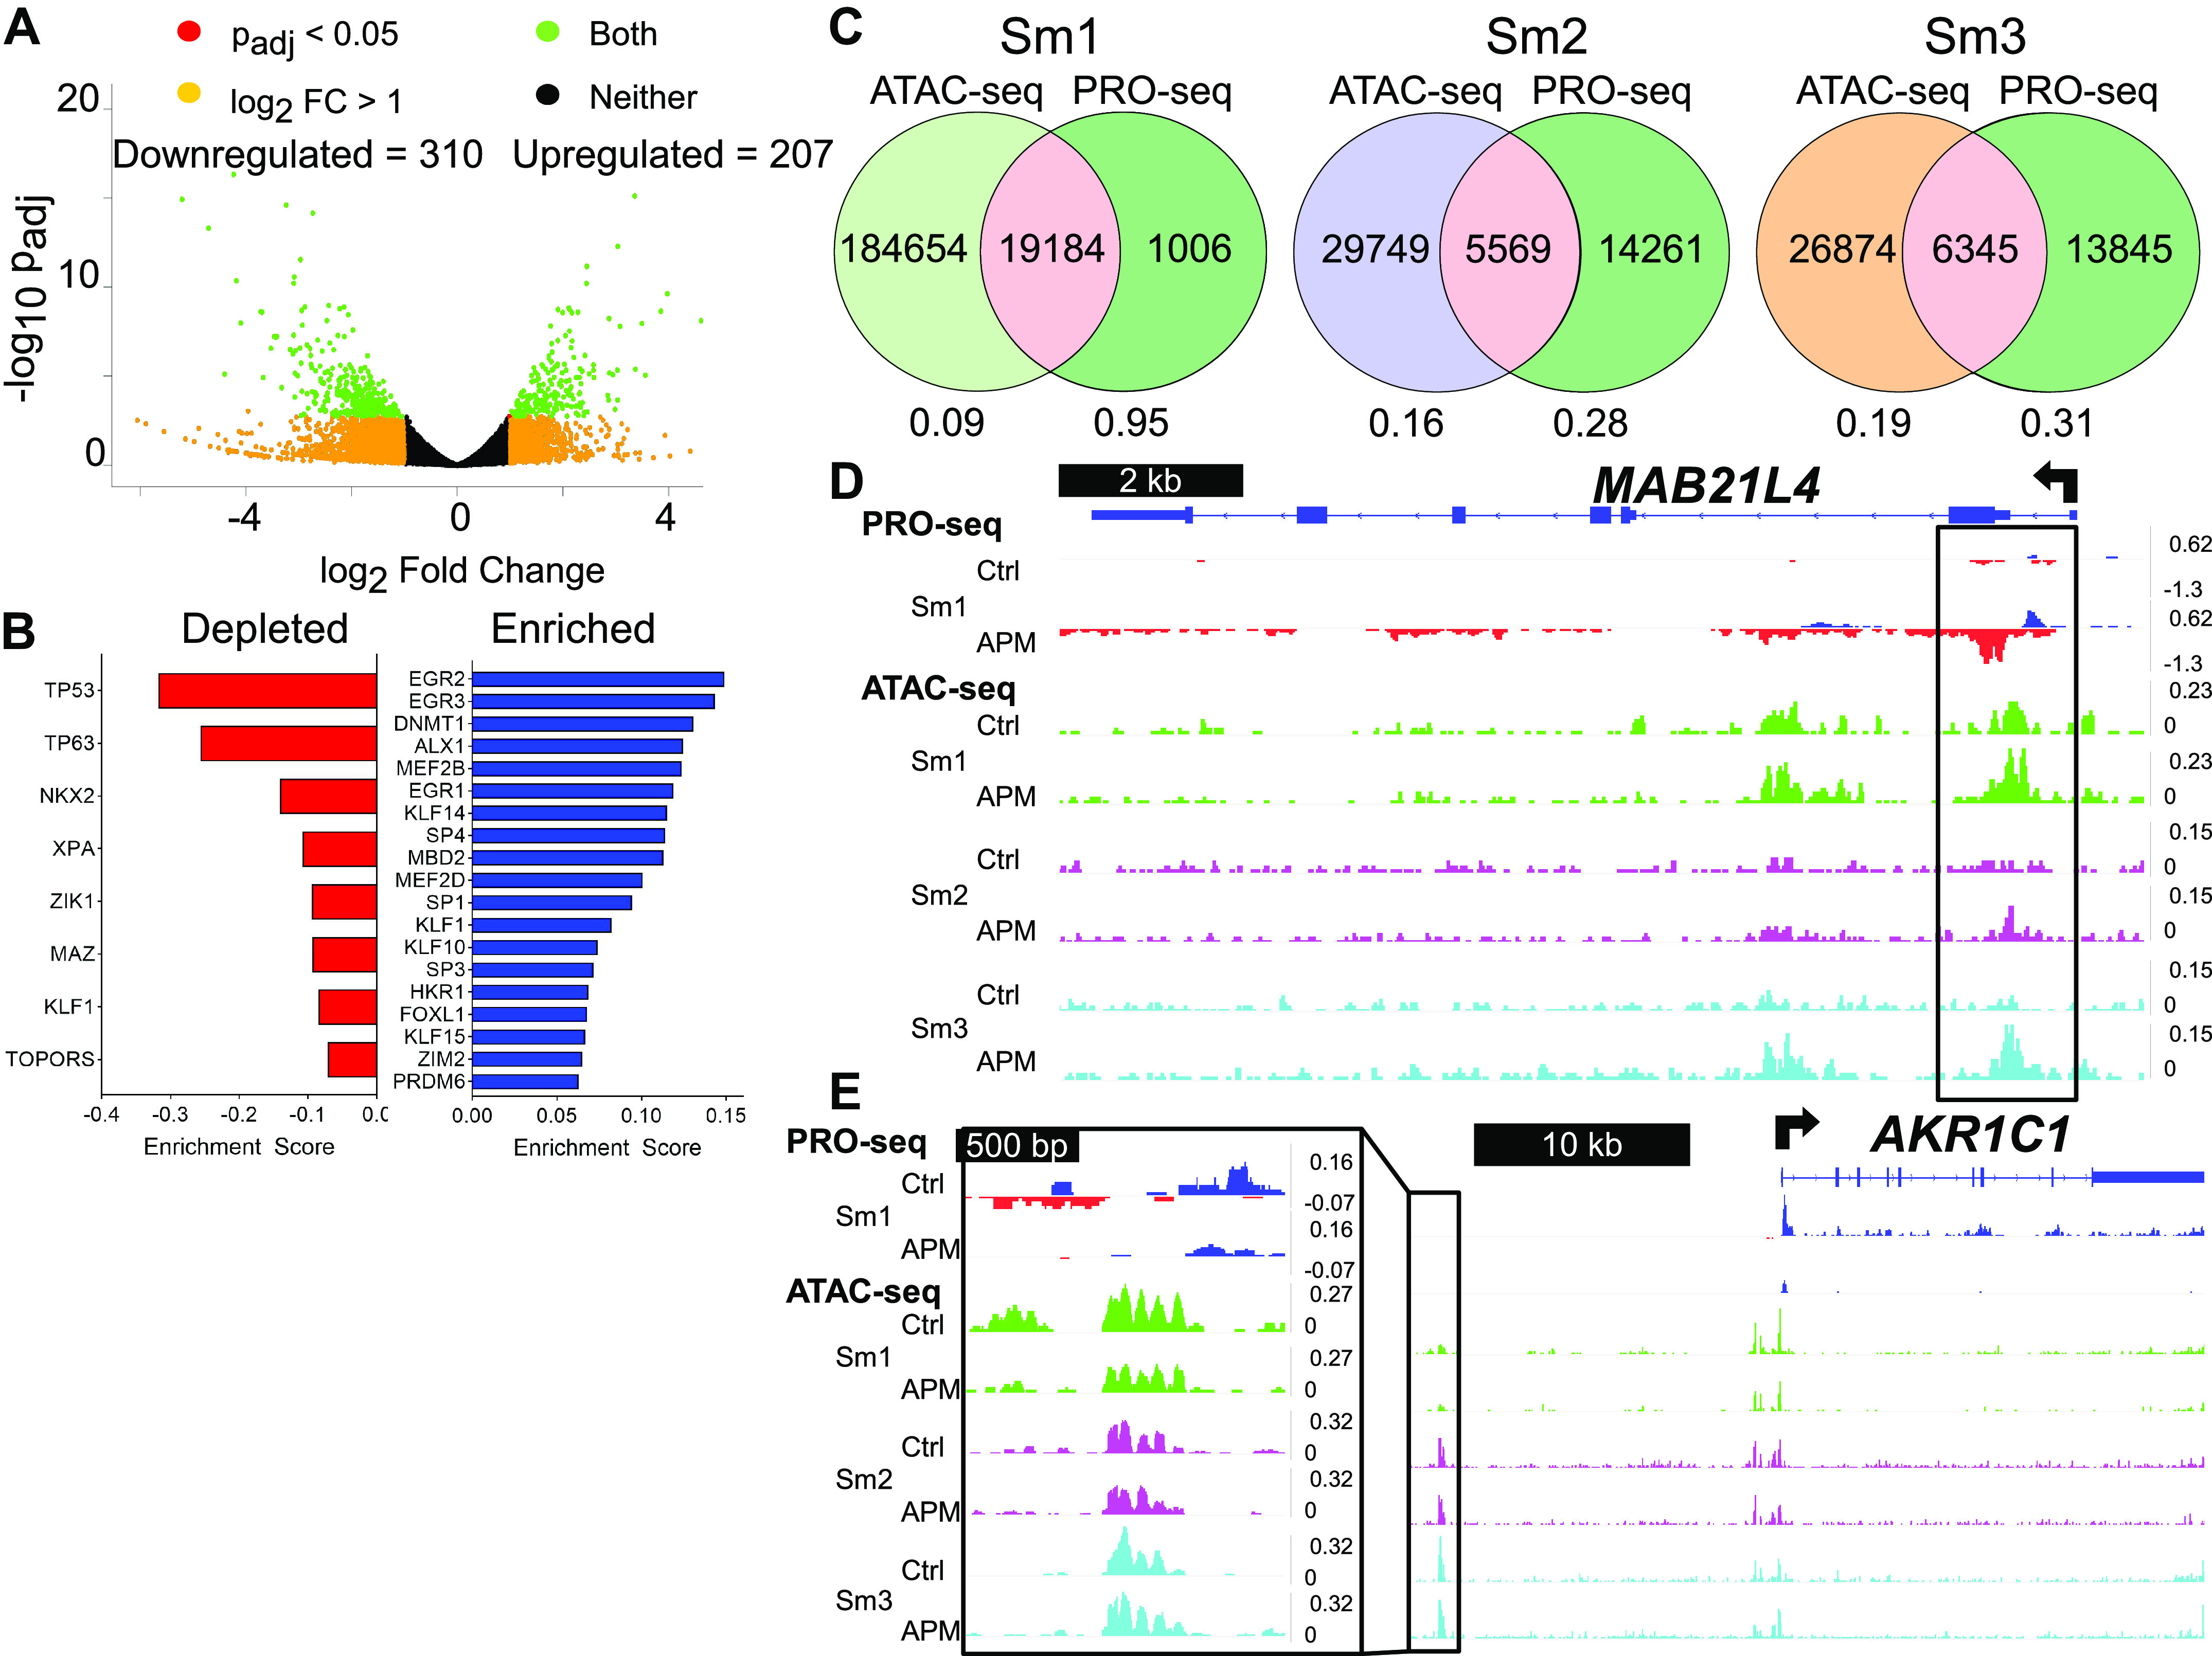
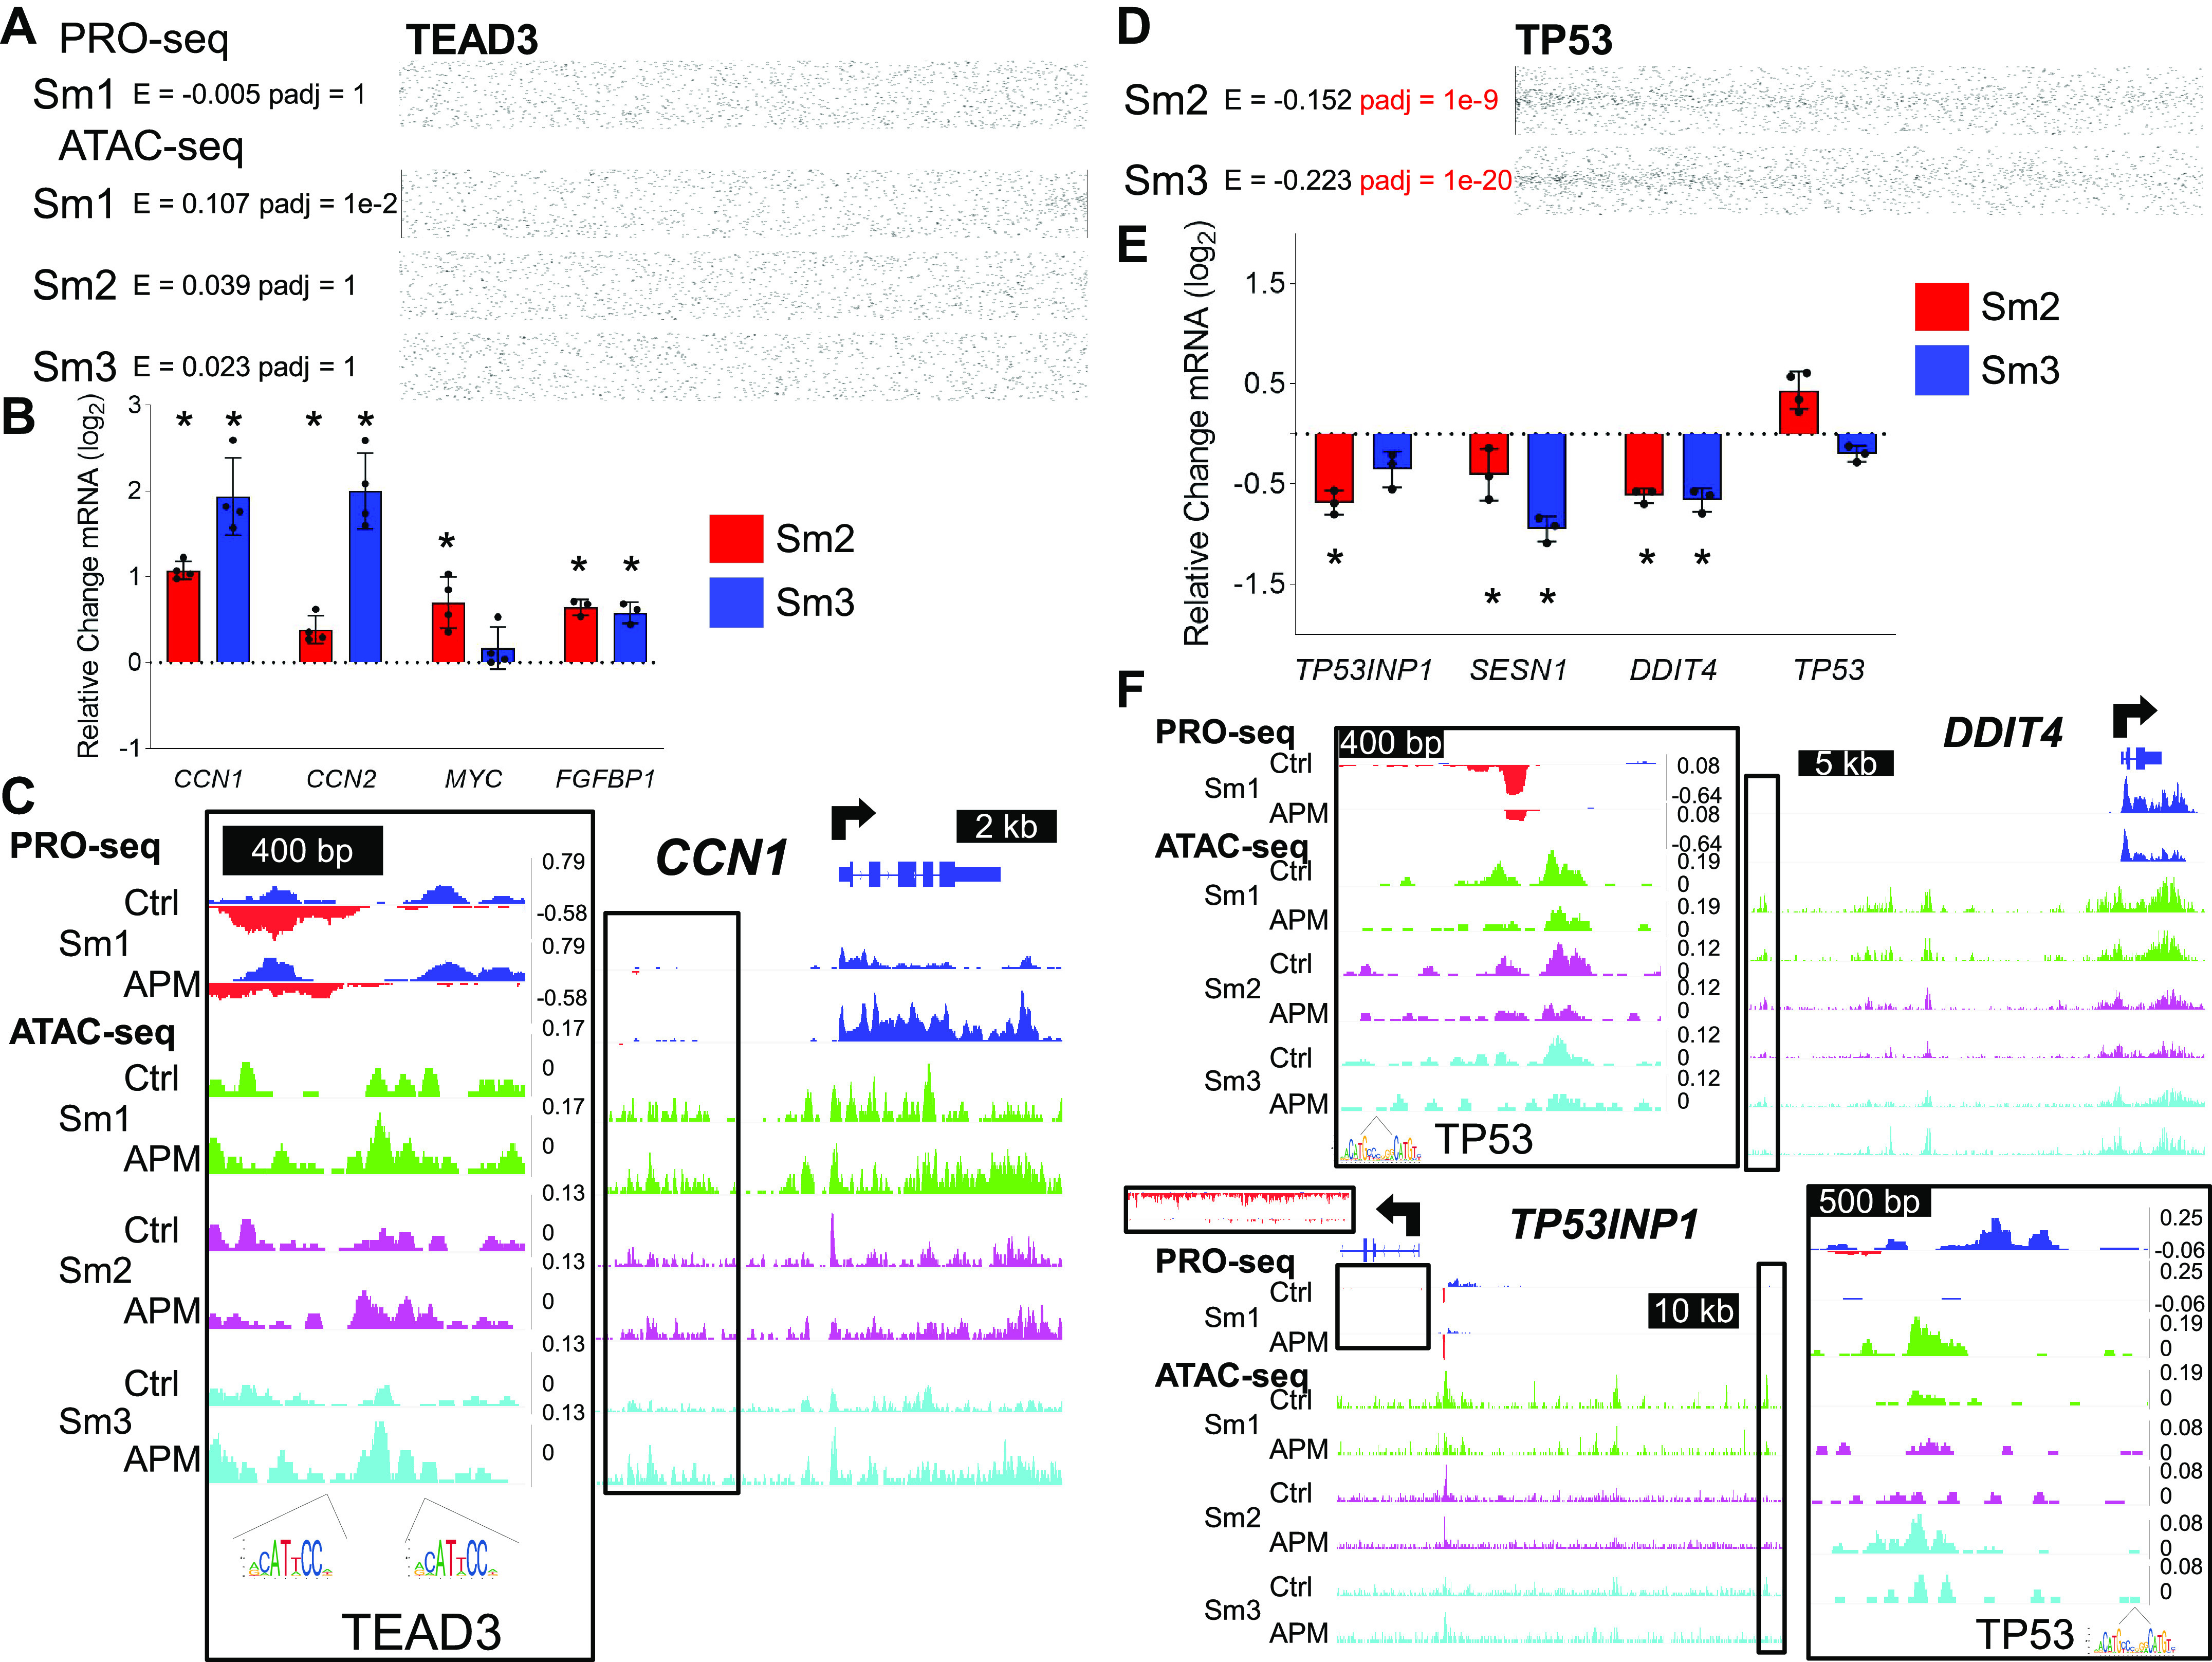
Military Deployment to Southwest Asia and Afghanistan and exposure to toxic airborne particulates have been associated with an increased risk of developing respiratory disease, collectively termed deployment-related respiratory diseases (DRRDs). Our knowledge about how particulates mediate respiratory disease is limited, precluding the appropriate recognition or management. Central to this limitation is the lack of understanding of how exposures translate into dysregulated cell identity with dysregulated transcriptional programs. The small airway epithelium is involved in both the pathobiology of DRRD and fine particulate matter deposition. To characterize small airway epithelial cell epigenetic and transcriptional responses to Afghan desert particulate matter (APM) and investigate the functional interactions of transcription factors that mediate these responses, we applied two genomics assays, the assay for transposase accessible chromatin with sequencing (ATAC-seq) and Precision Run-on sequencing (PRO-seq). We identified activity changes in a series of transcriptional pathways as candidate regulators of susceptibility to subsequent insults, including signal-dependent pathways, such as loss of cytochrome P450 or P53/P63, and lineage-determining transcription factors, such as GRHL2 loss or TEAD3 activation. We further demonstrated that TEAD3 activation was unique to APM exposure despite similar inflammatory responses when compared with wood smoke particle exposure and that P53/P63 program loss was uniquely positioned at the intersection of signal-dependent and lineage-determining transcriptional programs. Our results establish the utility of an integrated genomics approach in characterizing responses to exposures and identifying genomic targets for the advanced investigation of the pathogenesis of DRRD.

Keywords: deployment-related lung disease; particulate matter; transcription.


Conflict of interest statement

No conflicts of interest, financial or otherwise, are declared by the authors.

Figures

Figure 1.
Figure 1.
Particulate exposure induces IL-8 secretion in SAECs derived from three independent healthy donors. ELISA analysis of IL-8 concentration in the supernatant of Sm1, Sm2, and Sm3 SAECs exposed to APM (50 µg/cm2 of well surface area; A) or WSP (1 mg/mL of cell culture media; B) for 20 h in submerged cell culture. Bars indicate mean IL-8 concentration (±SD); n (number of biological replicates) ≥ 3/group, *P < 1e-3 for indicated comparisons, using a two-tailed t test. APM, Afghan desert particulate matter; SAECs, small airway epithelial cells; WSP, wood smoke particle.
Figure 2.
Figure 2.
ATAC-seq identifies transcription factors associated with chromatin accessibility changes in response to APM exposure. A: pyramid plots illustrate MACS2-called ATAC-seq peaks (discrete dots) ranked by magnitude of accessibility gain (more red) or loss (more green) in response to APM exposure, as output during Transcription Factor Enrichment Analysis (TFEA). The total number (n) of unique loci for each SAEC line is listed below each plot. B: Venn diagrams depict TFEA-identified numbers of transcription factor binding motifs for each SAEC line that were significantly (Padj < 1e-5) depleted (motifs that cluster with ATAC-seq features that lose accessibility in response to APM) or enriched (motifs that cluster with ATAC-seq features that gain accessibility in response to APM) following APM exposure and their overlap between SAEC lines. C: representative dot plots for one depleted (GRHL2—shared between Sm1 and Sm3, top right of Venn diagram in B) and one enriched (TEAD3—shared between Sm1, Sm2, and Sm3, center of Venn diagram in B) motif identified by TFEA. Each dot represents the indicated motif encountered within ±1,500 bp of an accessibility region, ranked by accessibility gain on the horizontal axis and distance to accessibility region center (with midpoint = 0) on the vertical axis. Enrichment (E) scores (a relative measure of motif enrichment between control vs. APM exposure) and associated Padj values are listed, with significant Padj values indicated in red. APM, Afghan desert particulate matter; ATAC-seq; assay for transposase accessible chromatin with sequencing; SAEC, small airway epithelial cell.
Figure 3.
Figure 3.
Chromatin accessibility profiles following APM vs. WSP exposure distinguish exposure- and donor-specific responses. A: Venn diagrams delineate overlap of MACS2-called ATAC-seq peaks identified in Sm2 or Sm3 cells exposed to APM vs. WSP based on genomic coordinates. Numbers below Venn diagrams indicate the fraction of peaks from each indicated comparison found in the shared (pink) set. B: Venn diagrams show TFEA-identified numbers of significantly (Padj < 1e-5) enriched or depleted transcription factor binding motifs following APM or WSP exposure and their overlap, both by exposure and by donor, as described for Fig. 2B. C: dot plots for P53 and P63 binding motifs that shared depletion in Sm2 and Sm3 in response to both APM and WSP exposures; significant depletion indicated in red text. D: dot plots for the TEAD3 binding motif that was enriched in Sm2 and Sm3 exposed to APM but not WSP; significant enrichment indicated in blue text. APM, Afghan desert particulate matter; ATAC-seq; assay for transposase accessible chromatin with sequencing; TFEA, Transcription Factor Enrichment Analysis; WSP, wood smoke particle.
Figure 4.
Figure 4.
PRO-seq reveals sustained transcriptional programs associated with APM exposure. A: volcano plot illustrates differentially regulated nascent gene transcripts in Sm1 cells treated with APM for 20 h. Each point represents one gene, with red indicating Padj < 0.05, light orange representing log2 fold change > 1, green indicating both Padj < 0.05 and log2 fold change > 1 and black indicating neither condition was satisfied. The number of genes meeting both criteria (green dots) that were down- or upregulated is shown. B: representative examples of downregulated (left) and upregulated (right) genes shown as PRO-seq tracks visualized in the Integrative Genomics Viewer (IGV) genome browser based on counts per million mapped reads (vertical scales). Positive (blue) indicates reads annotated to the sense strand, whereas negative (red) data reflect reads annotated to the antisense strand. The Transcription Start Site (TSS) and direction of transcription are indicated by arrows at the top of each panel. C: bar graphs display top 10 most significantly enriched functional annotation terms output by DAVID Functional Annotation Clustering applied to downregulated (left) and upregulated (right) transcripts. APM, Afghan desert particulate matter; PRO-seq; Precision Run-on sequencing.
Figure 5.
Figure 5.
TREs defined by PRO-seq bidirectional signatures identify a distinct set of transcription factors that respond to APM exposure. A: volcano plot illustrates differentially regulated Transcriptional Regulatory Element (TRE) transcripts in Sm1 cells treated with APM for 20 h, as described for Fig. 4A. B: transcription factor binding motifs identified by TFEA within PRO-seq data are represented as bar graphs. In this case, depleted motifs refers to those encountered more frequently in TREs with loss of transcriptional signal, whereas enriched motifs are those encountered more frequently in TREs with gain in transcriptional signal. Motifs listed meet the threshold of Padj < 1e-5 and are ranked by E score, here a relative measure of motif enrichment within TREs. C: Venn diagrams depict the total numbers of control and APM-exposed ATAC-seq peaks from each SAEC line (ATAC-seq), control and APM-exposed PRO-seq TREs from Sm1 cells (PRO-seq), and their overlap, based on genomic coordinates. Numbers below each diagram represent the fraction of ATAC-seq or PRO-seq peaks found within the intersection for each SAEC (pink). Representative examples of one upregulated TRE near the MAB21L4 promoter (D) and one downregulated TRE 5’ to the AKR1C1 gene locus (E) shown as PRO-seq tracks from Sm1 exposed to APM and ATAC-seq tracks from three SAEC lines exposed to APM, as visualized in IGV. ATAC-seq tracks are color-coded by SAEC line, with green = Sm1, purple = Sm2, and cyan = Sm3. Vertical scales on all tracks indicate counts per million mapped reads. APM, Afghan desert particulate matter; ATAC-seq; assay for transposase accessible chromatin with sequencing; IGV, Integrative Genomics Viewer; PRO-seq; Precision Run-on sequencing; SAEC, small airway epithelial cell; TFEA, Transcription Factor Enrichment Analysis.
Figure 6.
Figure 6.
APM-responsive transcription factors exhibit different classes of transcriptional regulation. A: dot plots demonstrate no TEAD3 binding motif enrichment when PRO-seq-defined TREs are used to define regions for TFEA analysis of control vs. APM-exposed SAECs. B: qRT-PCR analysis of indicated gene expression in Sm2 or Sm3 cells following APM exposure for canonical TEAD targets CCN1, CCN2, MYC, and FGFBP1. Bars represent mean normalized CT values on a log2 scale (±SD) relative to vehicle-treated controls; n = 4/group, *P < 0.05 vs. vehicle. C: IGV-visualized tracks of Sm1 control- and APM-exposed PRO-seq samples and three SAEC control- and APM-exposed ATAC-seq samples for one dynamic chromatin accessibility region 5’ to CCN1 (boxed in black and magnified). Specific regions containing canonical TEAD3 binding sequences (JASPAR) are indicated as motif logos under the genome tracks. D: TFEA analysis of control vs. APM-exposed Sm2 and Sm3 ATAC-seq data within PRO-seq defined regions confirms significant (Padj < 1e-5) depletion of the P53 binding motif, illustrated by dot plots. E: qRT-PCR analysis of indicated gene expression in Sm2 or Sm3 cells following APM exposure for canonical P53 targets TP53INP1, SESN1, and DDIT4; n = 4/group, *P < 0.05 vs. vehicle. F: IGV-visualized tracks of Sm1 control- and APM-exposed PRO-seq samples and three SAEC control- and APM-exposed ATAC-seq samples for one TRE 5’ to the DDIT4 gene locus and one TRE 5’ to the TP53INP1 gene locus (boxed in black and magnified). Both TREs contain canonical P53 binding sequences (JASPAR) as indicated. APM, Afghan desert particulate matter; ATAC-seq; assay for transposase accessible chromatin with sequencing; IGV, Integrative Genomics Viewer; PRO-seq; Precision Run-on sequencing; SAEC, small airway epithelial cell; TFEA, Transcription Factor Enrichment Analysis.

Similar articles

Cited by

References

    1. Krefft SD, Meehan R, Rose CS. Emerging spectrum of deployment-related respiratory diseases. Curr Opin Pulm Med 21: 185–192, 2015. doi:10.1097/MCP.0000000000000143. - DOI - PubMed
    1. Krefft SD, Rose CS, Nawaz S, Miller YE. Deployment-related lung disorders. Fed Pract 32: 32–38, 2015. - PMC - PubMed
    1. Kim KH, Kabir E, Kabir S. A review on the human health impact of airborne particulate matter. Environ Int 74: 136–143, 2015. doi:10.1016/J.ENVINT.2014.10.005. - DOI - PubMed
    1. Li R, Zhou R, Zhang J. Function of PM2.5 in the pathogenesis of lung cancer and chronic airway inflammatory diseases. Oncol Lett 15: 7506–7514, 2018. doi:10.3892/ol.2018.8355. - DOI - PMC - PubMed
    1. Hamanaka RB, Mutlu GM. Particulate matter air pollution: effects on the cardiovascular system. Front Endocrinol (Lausanne) 9: 680, 2018. doi:10.3389/FENDO.2018.00680. - DOI - PMC - PubMed

Publication types

MeSH terms