. 2022 Oct;36(10):e22532.
doi: 10.1096/fj.202101672RR.

Interleukin-4 receptor alpha signaling regulates monocyte homeostasis

Affiliations

Interleukin-4 receptor alpha signaling regulates monocyte homeostasis

Patrick Haider et al. FASEB J. 2022 Oct.

Abstract

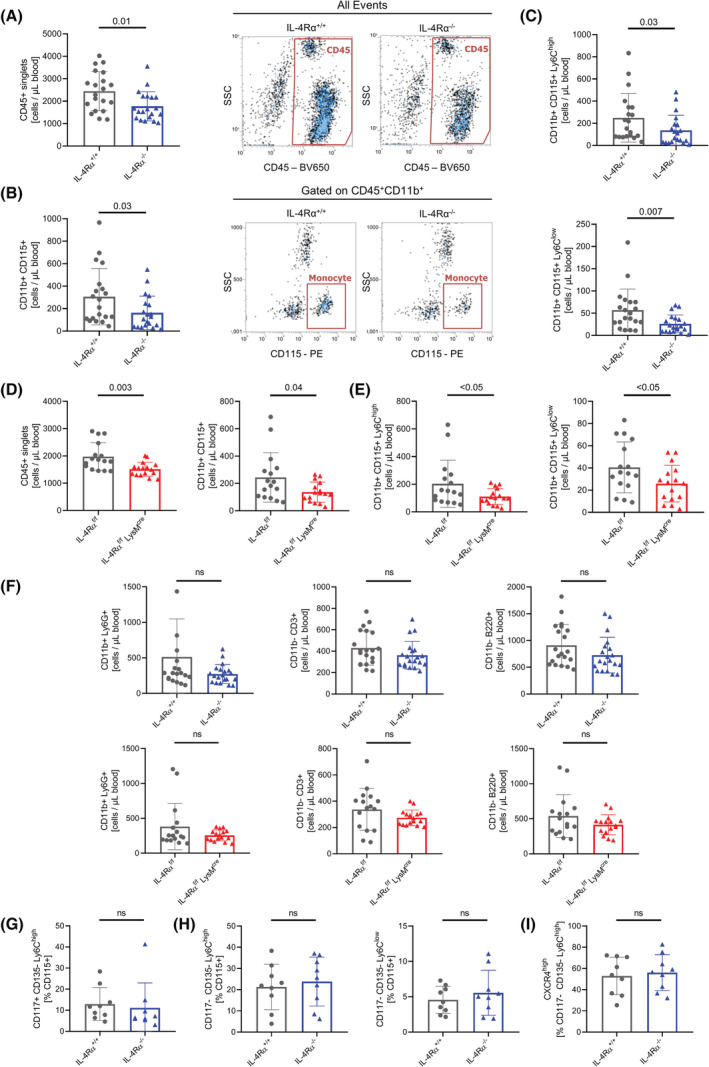
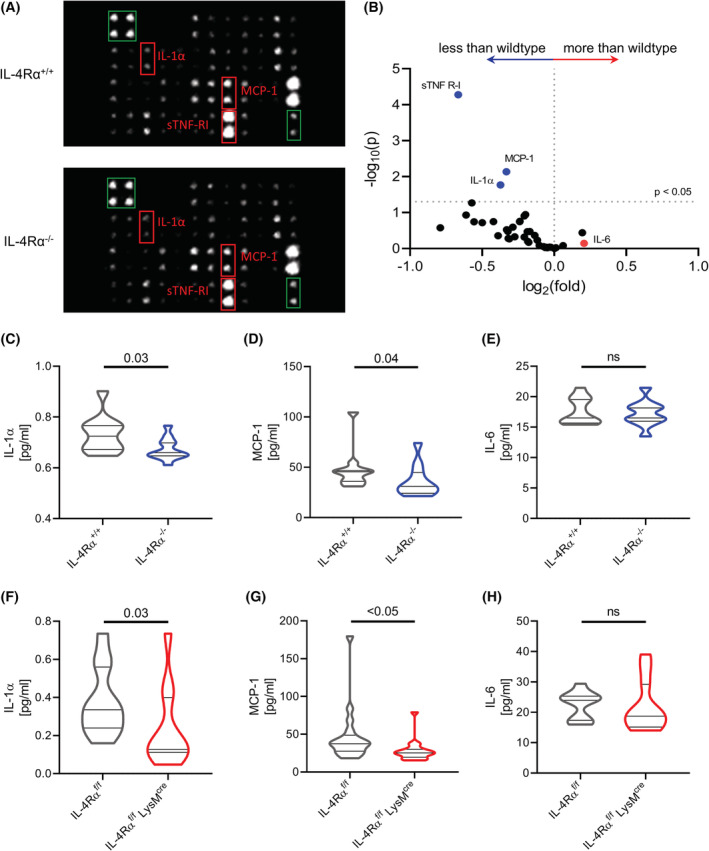
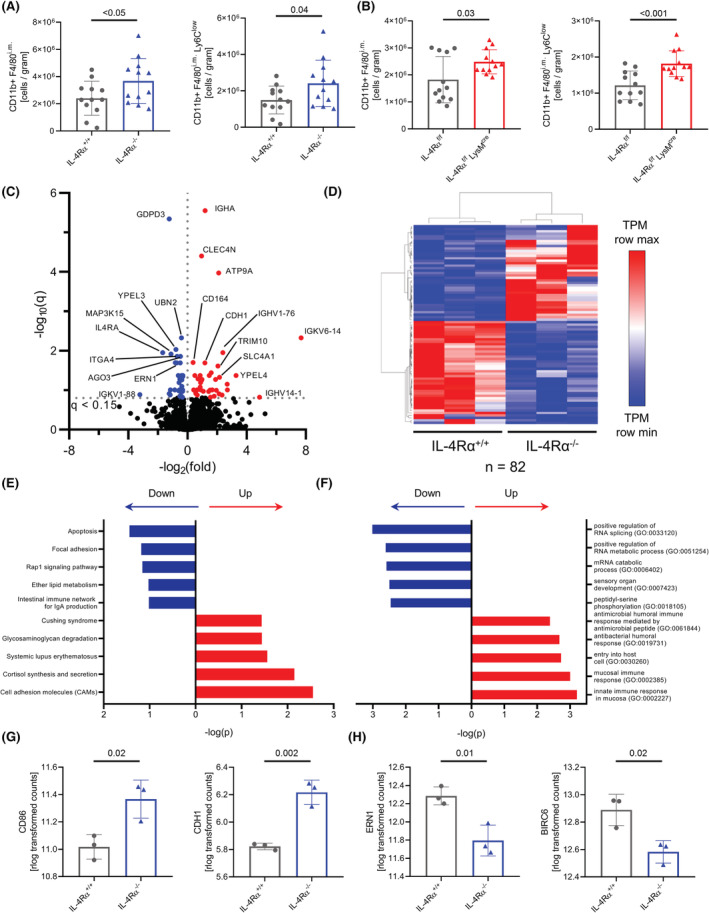
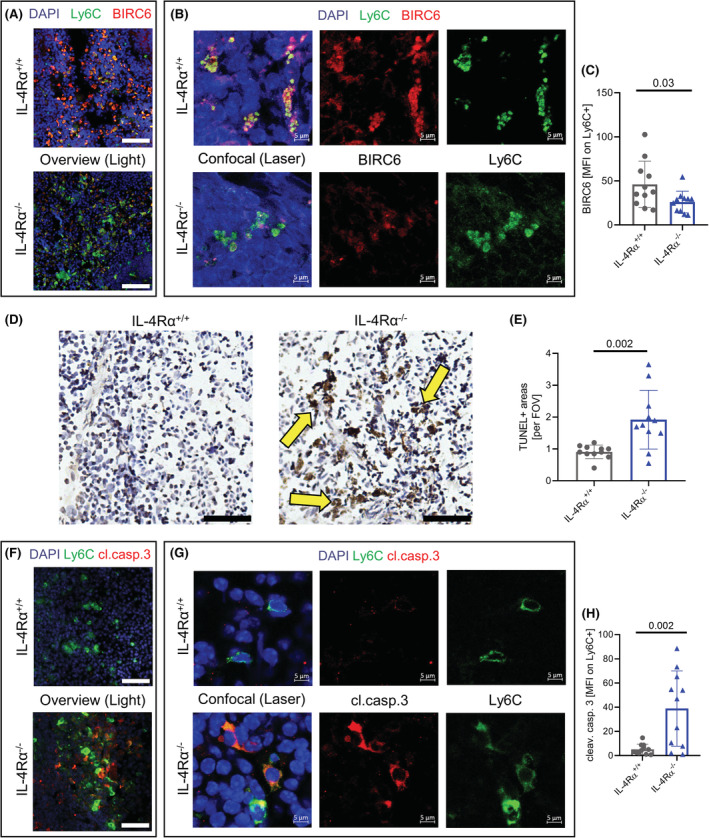
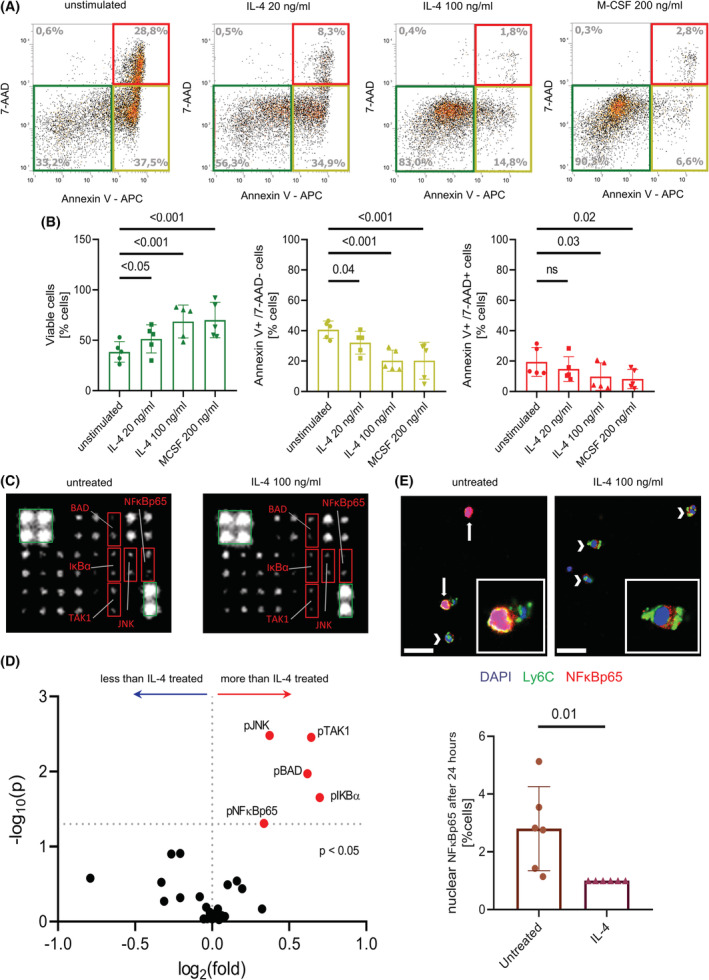
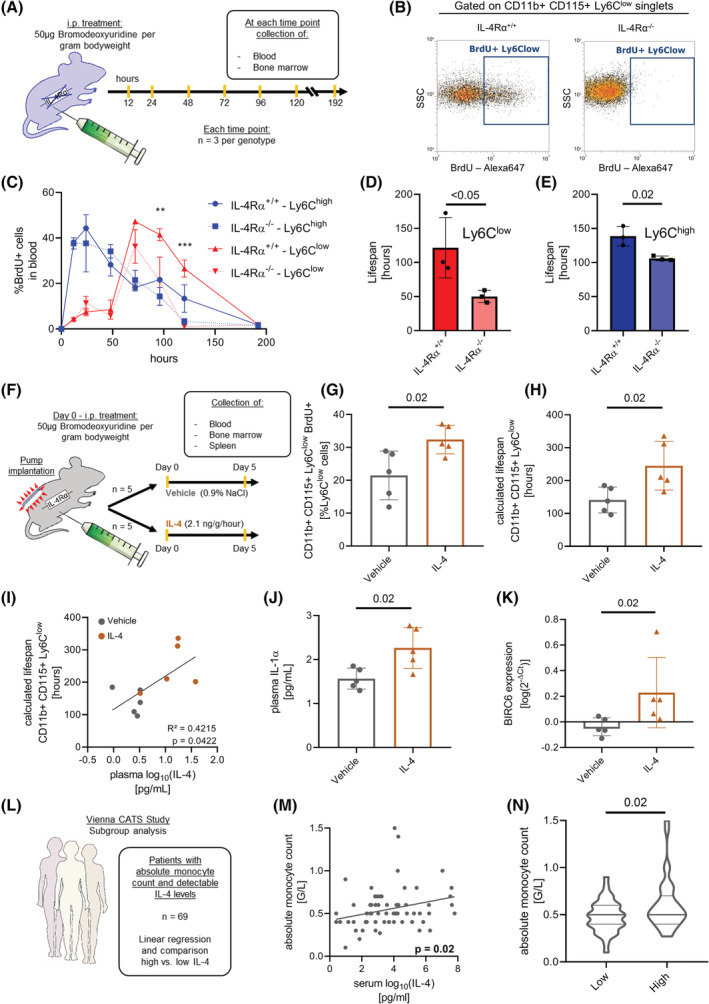
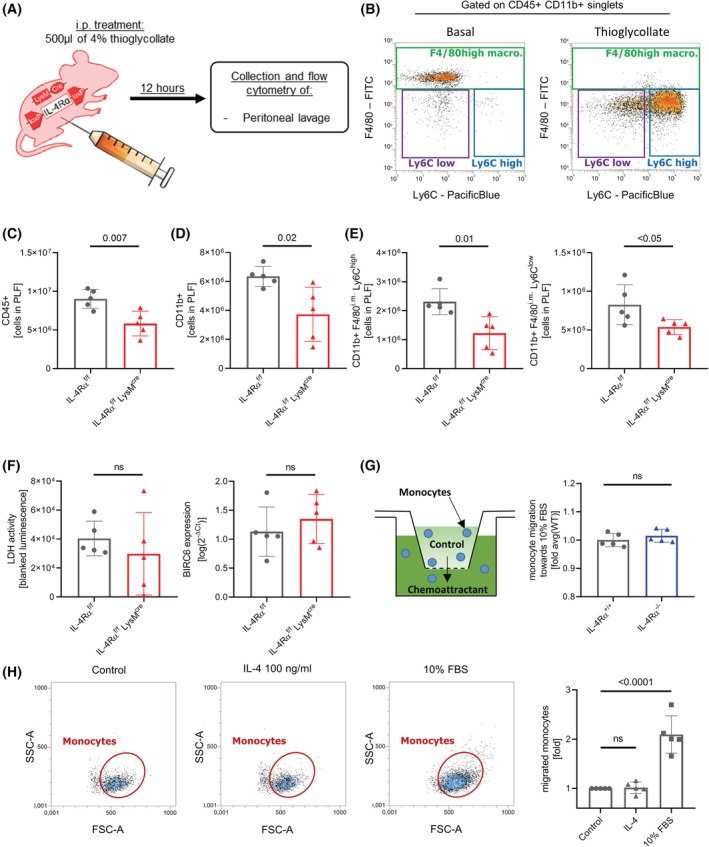
Interleukin-4 (IL-4) and its receptors (IL-4R) promote the proliferation and polarization of macrophages. However, it is unknown if IL-4R also influences monocyte homeostasis and if steady state IL-4 levels are sufficient to affect monocytes. Employing full IL-4 receptor alpha knockout mice (IL-4Rα-/- ) and mice with a myeloid-specific deletion of IL-4Rα (IL-4Rαf/f LysMcre ), we show that IL-4 acts as a homeostatic factor regulating circulating monocyte numbers. In the absence of IL-4Rα, murine monocytes in blood were reduced by 50% without altering monocytopoiesis in the bone marrow. This reduction was accompanied by a decrease in monocyte-derived inflammatory cytokines in the plasma. RNA sequencing analysis and immunohistochemical staining of splenic monocytes revealed changes in mRNA and protein levels of anti-apoptotic factors including BIRC6 in IL-4Rα-/- knockout animals. Furthermore, assessment of monocyte lifespan in vivo measuring BrdU+ cells revealed that the lifespan of circulating monocytes was reduced by 55% in IL-4Rα-/- mice, whereas subcutaneously applied IL-4 prolonged it by 75%. Treatment of human monocytes with IL-4 reduced the amount of dying monocytes in vitro. Furthermore, IL-4 stimulation reduced the phosphorylation of proteins involved in the apoptosis pathway, including the phosphorylation of the NFκBp65 protein. In a cohort of human patients, serum IL-4 levels were significantly associated with monocyte counts. In a sterile peritonitis model, reduced monocyte counts resulted in an attenuated recruitment of monocytes upon inflammatory stimulation in IL-4Rαf/f LysMcre mice without changes in overall migratory function. Thus, we identified a homeostatic role of IL-4Rα in regulating the lifespan of monocytes in vivo.

Keywords: homeostasis; immunity; innate; interleukin-4; monocytes; receptors; signal transduction.


Figures

FIGURE 1
FIGURE 1
Circulating monocyte numbers are reduced in IL‐4Rα knockout mice. (A–C) Flow cytometry analysis of absolute numbers of CD45+ leukocytes (A), CD11b+CD115+ monocytes (B), and monocyte subsets (C) in the blood of IL‐4Rα+/+ and IL‐4Rα−/− mice (n = 20 per genotype). (D,E) Flow cytometry analysis of absolute numbers of CD45+ leukocytes and CD115+ monocytes (D) and monocyte subsets (E) in the blood of IL‐4Rαf/f and IL‐4Rαf/f LysMcre mice (n = 16 per genotype). (F) Flow cytometry analysis of absolute numbers of CD11b+Ly6G+ granulocytes, CD11bCD3+ T cells and CD11bB220+ B cells in the blood of IL‐4Rα+/+ and IL‐4Rα−/− mice (n = 20 per genotype) as well as in the blood of IL‐4Rαf/f and IL‐4Rαf/f LysMcre mice (n = 16 per genotype). (G–I) Flow cytometry analysis of relative amount of CD115+CD117+CD135Ly6Chigh common monocyte precursor cells (G), CD115+CD117CD135 monocyte subsets (H), and CD115+Ly6ChighCXCR4high monocytes (I) in the bone marrow of IL‐4Rα+/+ and IL‐4Rα−/− mice (n = 9 per genotype, ns = not significant).
FIGURE 2
FIGURE 2
Inflammatory cytokine levels are reduced in the plasma of IL‐4Rα‐deficient mice. (A,B) Arrays of antibodies against 40 plasmatic cytokines were incubated with plasma from IL‐4Rα+/+ and IL‐4Rα−/− mice. Red boxes mark significantly regulated cytokines, green boxes mark normalization controls (A, both images were adjusted for brightness and contrast equally). Volcano plot of the cytokine array, cytokines of interest are labeled and marked with colors (B). (n = 4 per genotype) (C–E) Violin plots of IL‐1α (C), MCP‐1 (D) and IL‐6 (E) quantified in plasma of IL‐4Rα+/+ and IL‐4Rα−/− mice (n = 11 per genotype, ns = not significant). (F–H) Violin plots of IL‐1α (F), MCP‐1 (G), and IL‐6 (H) quantified in plasma of IL‐4Rαf/f and IL‐4Rαf/f LysMcre mice (n = 18 per genotype, ns = not significant).
FIGURE 3
FIGURE 3
IL‐4Rα knockout alters transcriptome of splenic monocytes. (A,B) Flow cytometry analysis of absolute numbers of CD11b+F4/80i.m and CD11b+F4/80i.mLy6Clow monocytes in the spleens of IL‐4Rα+/+ and IL‐4Rα−/− mice (A, n = 12 per genotype) and IL‐4Rαf/f and IL‐4Rαf/f LysMcre mice (B, n = 12 per genotype). (C–H) RNAseq analysis of splenic monocytes from IL‐4Rα+/+ and IL‐4Rα−/− mice. Volcano plot of differently regulated genes. Color dots represent DEGs (C). Pearson's hierarchical clustering (D). Top significant altered KEGG pathways (E). Top significant altered GO terms (F). Counts (rlog transformed) per gene for targets CD86 and CDH1 identified as DEGs in the KEGG “Cell adhesion molecules (CAMs)” pathway (G). Counts (rlog transformed) per gene for the targets ERN1 and BIRC6 identified as DEGs in the KEGG “Apoptosis” pathway (H) (C–H, n = 3 per genotype).
FIGURE 4
FIGURE 4
Increased cell death of splenic monocytes in the absence of IL‐4Rα signaling. (A–C) Immunofluorescent co‐staining of Ly6C and BIRC6 in the spleen of IL‐4Rα+/+ and IL‐4Rα−/− mice acquired on a TissueFAXS Zeiss observer light microscope; scale bars = 50 μm (A). Confocal laser microscopy of the same samples as in A showing colocalization of BIRC6 with Ly6C signal at a higher magnification acquired on a LSM700 Zeiss laser microscope; scale bars = 5 μm (B). The mean fluorescent intensity of BIRC6 at areas positive for Ly6C (C). (D,E) Immunohistochemical TUNEL staining in the spleen of IL‐4Rα+/+ and IL‐4Rα−/− mice acquired on a TissueFAXS Zeiss observer light microscope; scale bars = 50 μm. Yellow arrows indicate TUNEL+ areas (D). TUNEL+ areas were blindly analyzed in 20 fields of view per sample (E). (F–H) Immunofluorescent co‐staining of Ly6C and cleaved caspase 3 in the spleen of IL‐4Rα+/+ and IL‐4Rα−/− mice acquired on a TissueFAXS Zeiss observer light microscope; scale bars = 50 μm (F). Confocal laser microscopy of the same samples as in F showing colocalization of cleaved caspase 3 with Ly6C signal at a higher magnification acquired on a LSM700 Zeiss laser microscope; scale bars = 5 μm (G). The mean fluorescent intensity of cleaved caspase 3 at areas positive for Ly6C was analyzed (H) (n = 11 per genotype).
FIGURE 5
FIGURE 5
IL‐4 prevents apoptosis of human monocytes. (A,B) AnnexinV/7‐AAD staining of human monocytes. The colored boxes indicate viable (green), early apoptotic/necrotic (yellow), and late apoptotic/necrotic (red) cells (A). Flow cytometry analysis of the AnnexinV/7‐AAD staining (B). (n = 5 human donors, ns = not significant) (C,D) 19 signaling proteins involved in the apoptosis pathway were analyzed in lysates of human monocytes treated with 100 ng/ml IL‐4 for 24 h. Red boxes mark significantly regulated proteins, green boxes mark normalization controls (C, both images were adjusted for brightness and contrast equally). Volcano plot of the protein array, proteins of interest are labeled and marked with colors (D). (n = 4 human donors) (E) Confocal laser microscopy of the immunofluorescence staining and quantification of NFκBp65 in isolated human monocytes either left untreated or treated with 100 ng/ml IL‐4 for 24 h; scale bars = 20 μm. A 6× higher magnification of some cells is shown in the canvas for each condition. (n = 6 human donors).
FIGURE 6
FIGURE 6
IL‐4Rα signaling in monocytes directly regulates their lifespan in vivo. (A–E) Experimental setup of lifespan measurement (A). Flow cytometry plot of BrdU signal 120 h after BrdU injection (B). Time kinetic of BrdU means ± SEM in monocytes in blood. Asterisks indicate significant differences in Ly6Clow subset between IL‐4Rα+/+ and IL‐4Rα−/−, calculated by two‐way ANOVA (C, **p < .01, ***p < .001). Calculated lifespan of the Ly6Clow (D) and Ly6Chigh (E) monocyte subsets. (n = 3 per genotype and time point) IL‐4 application regulates lifespan of monocytes in vivo (F–K) Experimental setup of IL‐4 application (F). Flow cytometry analysis of BrdU signal in CD11b+CD115+Ly6Clow monocytes (G). Lifespan of Ly6Clow monocytes (H). Linear regression of plasma IL‐4 levels and lifespan of CD11b+CD115+Ly6Clow monocytes (I). IL‐1α in plasma (J). BIRC6 expression in the spleen (K) (n = 5 per treatment). (L–N) Association of serum IL‐4 levels with absolute monocyte counts in humans (L). Linear regression of log10 (IL‐4) levels in serum with absolute monocyte counts (M). Violin plot of monocyte counts stratified by IL‐4 (n = 69 patients) (N).
FIGURE 7
FIGURE 7
Lack of IL‐4Rα in myeloid cells leads to impaired recruitment of monocytes into the peritoneal cavity. (A) Experimental setup. (B) Representative flow cytometry plot of the peritoneal lavage fluids. (C–E) Flow cytometry analysis of absolute numbers of CD45+ leukocytes (C), CD11b+ myeloid cells (D), and monocyte subsets (E) in the peritoneal lavage fluid 12 h after thioglycollate injection. (n = 5 per group) (F) Assessment of cell death parameters in the peritoneal lavage fluid (PLF) of the thioglycollate experiment. Lactate dehydrogenase activity was measured in the supernatant of the PLF after centrifugation by measuring the luminescence signal of a specific substrate on a Promega GloMax reader (left). BIRC6 gene expression was analyzed by qPCR in the lysate of the cell suspension of the PLF after centrifugation (right). (n = 5 per group) (G) Experimental setup of a Boyden chamber assay and assessment of the overall migratory capacity of murine monocytes from IL‐4Rα−/− mice and WT littermates against 10% FBS in vitro using a commercial Boyden chamber assay. (n = 5 per group) (H) Representative flow cytometry plots and analysis of flow cytometry data of migration experiments using human isolated monocytes (n = 5 individual human donors).

References

    1. Harris NL, Loke P. Recent advances in type‐2‐cell‐mediated immunity: insights from helminth infection. Immunity. 2017;47:1024‐1036. - PubMed
    1. Huber S, Hoffmann R, Muskens F, Voehringer D. Alternatively activated macrophages inhibit T‐cell proliferation by Stat6‐dependent expression of PD‐L2. Blood. 2010;116:3311‐3320. - PubMed
    1. Punnonen J, Yssel H, Devries J. The relative contribution of IL‐4 and IL‐13 to human IgE synthesis induced by activated CD4 or CD8 T cells. J Allergy Clin Immunol. 1997;100:792‐801. - PubMed
    1. Ranasinghe C, Roy S, Li Z, Khanna M, Jackson RJ. IL‐4 and IL‐13 receptors. In: Choi S, ed. Encyclopedia of Signaling Molecules. Springer International Publishing; 2018:2549‐2557.
    1. Bitton A, Avlas S, Reichman H, et al. A key role for IL‐13 signaling via the type 2 IL‐4 receptor in experimental atopic dermatitis. Sci Immunol. 2020;5:eaaw2938. - PubMed