Review
. 2022 Sep;35(9):1143-1164.
doi: 10.1111/jeb.14005.

What is reproductive isolation?

Affiliations
Review

What is reproductive isolation?

Anja M Westram et al. J Evol Biol. 2022 Sep.

Abstract

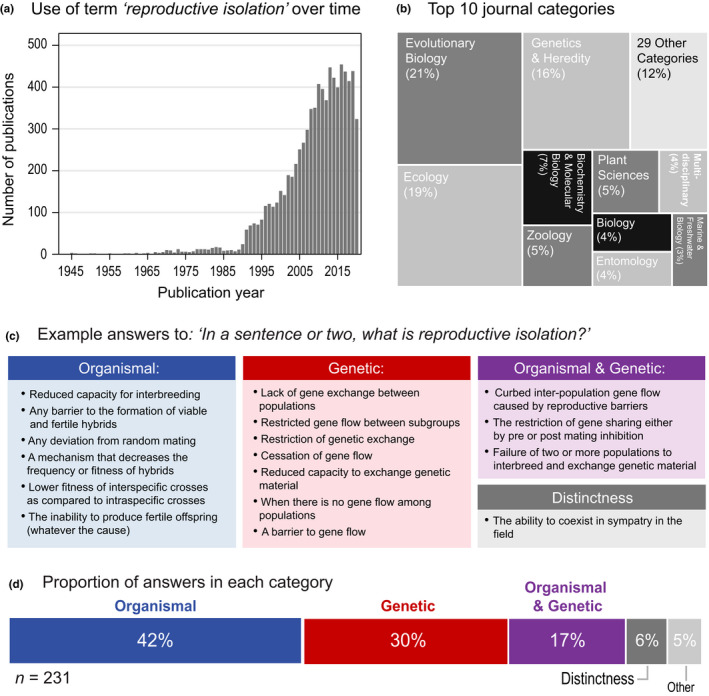
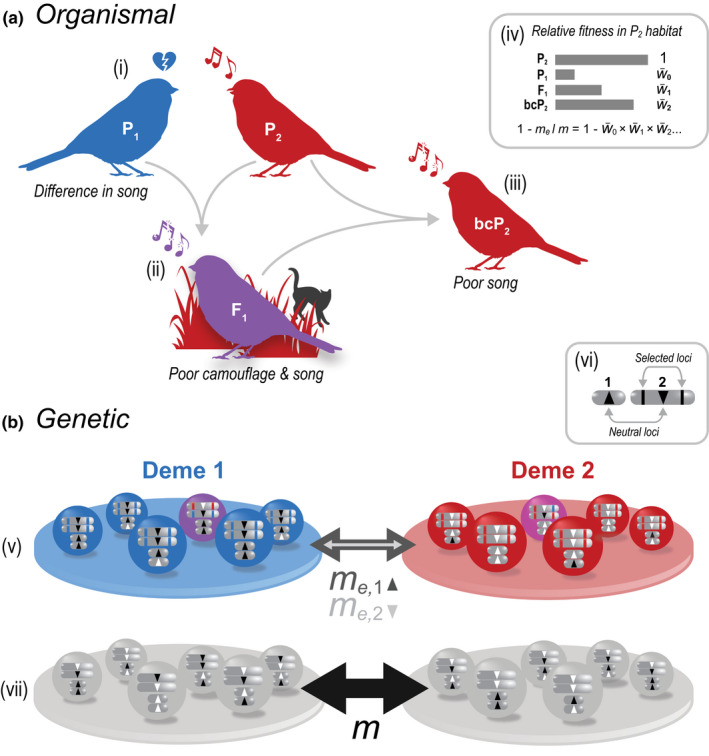
Reproductive isolation (RI) is a core concept in evolutionary biology. It has been the central focus of speciation research since the modern synthesis and is the basis by which biological species are defined. Despite this, the term is used in seemingly different ways, and attempts to quantify RI have used very different approaches. After showing that the field lacks a clear definition of the term, we attempt to clarify key issues, including what RI is, how it can be quantified in principle, and how it can be measured in practice. Following other definitions with a genetic focus, we propose that RI is a quantitative measure of the effect that genetic differences between populations have on gene flow. Specifically, RI compares the flow of neutral alleles in the presence of these genetic differences to the flow without any such differences. RI is thus greater than zero when genetic differences between populations reduce the flow of neutral alleles between populations. We show how RI can be quantified in a range of scenarios. A key conclusion is that RI depends strongly on circumstances-including the spatial, temporal and genomic context-making it difficult to compare across systems. After reviewing methods for estimating RI from data, we conclude that it is difficult to measure in practice. We discuss our findings in light of the goals of speciation research and encourage the use of methods for estimating RI that integrate organismal and genetic approaches.

Keywords: adaptation; genomics; natural selection; population genetics; speciation; theory.


Conflict of interest statement

The authors declare no conflict of interest.

Figures

None
FIGURE B1.1 Use of RI in the literature and insights into its meaning from an online survey. (a) Number of papers using the term ‘reproductive isolation’ in their title, abstract or keywords and (b) the top 10 journal categories in which the term RI is used, both according to ISI web of Science as of September 23, 2021. (c) Example answers to the question: ‘In a sentence or two, what is reproductive isolation?’, from the speciation survey, classified as described in the text. (d) The percentage of answers classified into each category. See Table S2 for the full set of answers and methodological details.
FIGURE 1
FIGURE 1
Different but complementary perspectives of reproductive isolation. (a) The ‘organismal’ perspective of RI tends to focus on the reduction in successful interbreeding between taxa. In this example, two bird populations (P1 and P2) have diverged for colour and song. Reduced attractiveness and camouflage cause immigrants, F1 s, and backcrosses (bc) to have lower mean fitness relative to the resident type (i–iii). (iv) Example relative fitnesses are given for a P1 immigrant (W¯0), F1 (W¯1) and P2 backcross (W¯2), relative to a resident P2 individual. In a two‐deme model with low migration, the gene flow for an unlinked neutral locus relative to that expected without any barriers to gene flow (me/m) is the product of the mean fitnesses of successive hybrid classes (W¯0W¯1W¯2). (b) The genetic perspective tends to focus on the reduction in gene flow between populations due to selection acting on genetic differences. This is illustrated for a two‐deme model with a genetic barrier (v), contrasted with a neutral scenario with no barrier (vii). In both scenarios, diploid individuals carry n = 2 chromosomes. (vi) Both chromosomes (1 and 2) carry a neutral locus (up and down facing triangles), each with two alternative alleles (black and white). In the barrier scenario (v), the neutral locus on chromosome 2 is flanked by a pair of loci that affect fitness; blue and red alleles at these loci maximize fitness in demes 1 and 2, respectively, but severely reduce fitness in the other deme. Although individuals migrate between demes at the same rate in both scenarios, the rate of gene flow at neutral loci—which is indicated by the width of the arrows and evident from the amount of neutral allele sharing between the demes—is lower than expected in the barrier scenario due to their association with selected loci. Note that this ‘effective’ migration rate (m e) differs between the two neutral loci, and is more strongly reduced for neutral alleles linked to the selected loci
FIGURE 2
FIGURE 2
A pedigree depicting the movement of neutral alleles between populations and genetic backgrounds in the presence of a barrier. (a and b) Diploid individuals carry one chromosome with a single neutral marker flanked by two loci divergently selected between two demes. (c) At time 0 (top row), the two demes are fixed for alternative alleles at the neutral and selected loci. The blue and red selected alleles maximize fitness in demes 1 and 2, respectively, but severely reduce fitness in the other deme. Panel (c) depicts the pedigree for the 2 demes across multiple generations. Lines connect parents (row i) and their offspring (row i + 1). Coloured lines trace the passage of immigrant haplotypes through the pedigree. Because divergent selection is strong, selected immigrant alleles can only persist for a short time in the foreign deme. Because they are associated with selected sites, the movement of neutral alleles between demes is also restricted, but they can persist when they recombine onto the local genetic background. In this example, escaping their association with selected alleles requires two recombination events (asterisks mark individuals in which these recombination events occur). (d) Over time, the allele frequency difference at neutral loci will reduce, but this takes much longer than expected in the absence of a barrier
None
FIGURE B2.1 Different patterns of range overlap, in a two‐dimensional habitat (Note that equations in the text are for a 1‐dimensional setting for simplicity). (a) Two populations (red, blue) are distributed in a mosaic, and remain distinct where they overlap. (b) Two contiguous ranges overlap in an intermediate region, again remaining distinct in an intermediate region of sympatry. (c) Two populations are separated by a narrow hybrid zone, in which clines for multiple genetic differences coincide. (d) Clines are scattered, so that there is a broader region of intergradation
FIGURE 3
FIGURE 3
Reproductive isolation in a two‐deme scenario. (a) Two panmictic demes connected by unidirectional gene flow; the two locations between which RI is measured simply correspond to the two demes. (b and c) RI along the genome under this model, with a single locus under selection at position 0 (b) or two loci under selection at positions −0.05 and 0.05 (c). The x‐axis gives the recombination rate of the neutral locus relative to position 0.0 (−r for loci to the left and +r for loci to the right). The black curve corresponds to deterministic simulations (details in Appendix S1); the grey curve corresponds to Equation (4). Note that RI is not defined for the selected loci themselves; the points corresponding to the positions of the selected loci represent neutral loci perfectly linked to selected loci. = 0.1 for all selected loci
FIGURE 4
FIGURE 4
Reproductive isolation in a continuous space scenario (across a simple hybrid zone). (a) Two divergent populations meet in a hybrid zone in continuous space. (b and c) The barrier B along the genome under this model, with a single locus under selection at position 0 (b) or two loci under selection at positions −0.05 and 0.05 (arrows) (c). The x‐axis gives the recombination rate of the neutral locus relative to position 0.0 (−r for loci to the left and +r for loci to the right). Points show results from deterministic simulations, and the line connects these points (details see Appendix S1). s = 0.1 for all selected loci
FIGURE 5
FIGURE 5
Estimating RI from simulations. (a) Discrete demes: In contrast to most empirical situations, in simulations it is possible to observe not only the allele frequency differences between two demes in a given generation (Δp) but also the allele frequency change over a generation (δp). As the ratio between the two gives m e, the slope of δp against Δp provides m e. The different values in the plot can come either from following a single neutral locus over time or from looking at multiple loci with different allele frequencies across a single generation; but note that the linear relationship between δp and Δp from different time points will only appear when the populations are at equilibrium for the selected loci; out of equilibrium, the time point to determine RI must be specified and all values must be sampled from that same time point. In either case, RI can simply be calculated from m e and the known m. (b) Hybrid zone: The barrier B for a neutral locus can be measured as the ratio between the gradient (p′) and the central step (Δp) (see panel (c)), which also stays constant over time. Again, the different values in the plot can come either from following a single neutral locus over time (as in panel (c)) or from looking at multiple loci with different allele frequencies in a single generation. (c) Hybrid zone: RI can be measured from cline patterns. At the selected locus (grey dashed line), a steep spatial cline has reached equilibrium. At linked neutral loci, the barrier to gene flow generates weaker clines. We show a single linked neutral locus at three time points (different shades of grey). After an initial short period of stabilization (not shown), even though neutral allele frequencies are still changing, the barrier B measured for the linked neutral locus is approximately stable over time, reflecting a stable rate of flow across the zone. Simulations with nearest neighbour migration with m=0.5, s=0.2 for the selected locus and r=0.01 for the neutral locus
FIGURE 6
FIGURE 6
Reproductive isolation in continuous space, with a physical barrier. (a) Two divergent populations meet in a hybrid zone in continuous space; the genetic barrier coincides with a physical dispersal barrier. (b) The barrier B along the genome under this model, comparing different situations with and without physical and genetic barrier. Circles: Only a physical barrier, with no selection; Triangles: Only a genetic barrier; Diamonds: the genetic and the physical barrier acting together; Squares: For comparison, the (hypothetical) barrier that would appear if the genetic and the physical barrier just added up. This plot shows the synergy between the physical and genetic barrier. The x‐axis gives the recombination rate of the neutral locus relative to position 0.0 (−r for loci to the left and +r for loci to the right), which corresponds to the position of the selected locus with s = 0.1, if present. See Appendix S1 for details

Comment in

References

    1. Aeschbacher, S. , Selby, J. P. , Willis, J. H. , & Coop, G. (2017). Population‐genomic inference of the strength and timing of selection against gene flow. Proceedings of the National Academy of Sciences of the United States of America, 114, 7061–7066. - PMC - PubMed
    1. Aguillon, S. M. , Fitzpatrick, J. W. , Bowman, R. , Schoech, S. J. , Clark, A. G. , Coop, G. , & Chen, N. (2017). Deconstructing isolation‐by‐distance: The genomic consequences of limited dispersal. PLOS Genetics, 13(8), e1006911. - PMC - PubMed
    1. Barton, N. H. (1980). The hybrid sink effect. Heredity, 44, 277–278. 10.1038/hdy.1980.23 - DOI
    1. Barton, N. H. (1986). The effects of linkage and density‐dependent regulation on gene flow. Heredity, 57, 415–426. 10.1038/hdy.1986.142 - DOI - PubMed
    1. Barton, N. , & Bengtsson, B. O. (1986). The barrier to genetic exchange between hybridising populations. Heredity, 57, 357–376. 10.1038/hdy.1986.135 - DOI - PubMed

Publication types