. 2023 Jan;89(1):29-39.
doi: 10.1002/mrm.29439. Epub 2022 Sep 5.

Deuterium metabolic imaging of the human brain in vivo at 7 T

Affiliations

Deuterium metabolic imaging of the human brain in vivo at 7 T

Eulalia Serés Roig et al. Magn Reson Med. 2023 Jan.

Abstract

Purpose: To explore the potential of deuterium metabolic imaging (DMI) in the human brain in vivo at 7 T, using a multi-element deuterium (2 H) RF coil for 3D volume coverage.

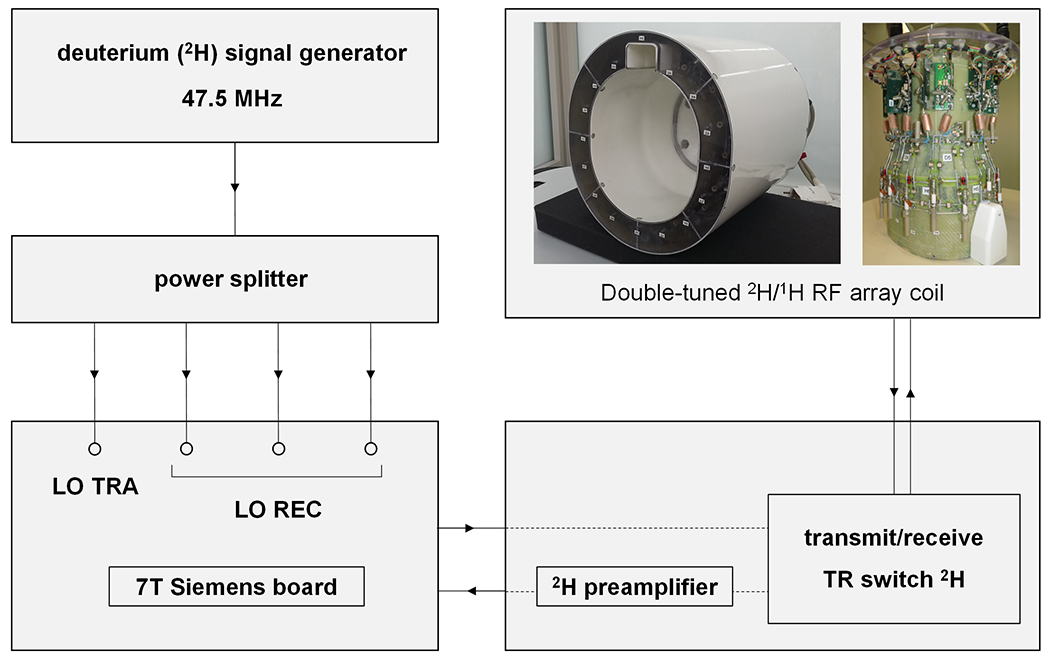
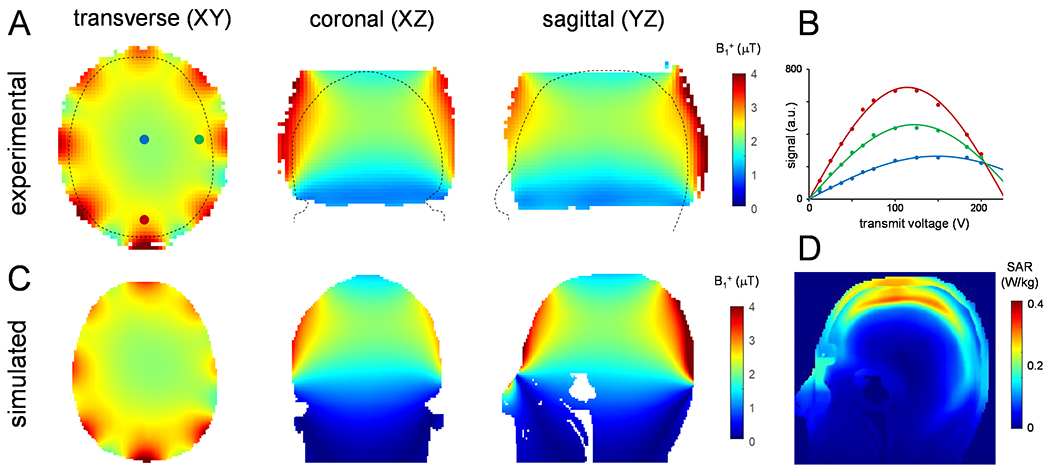
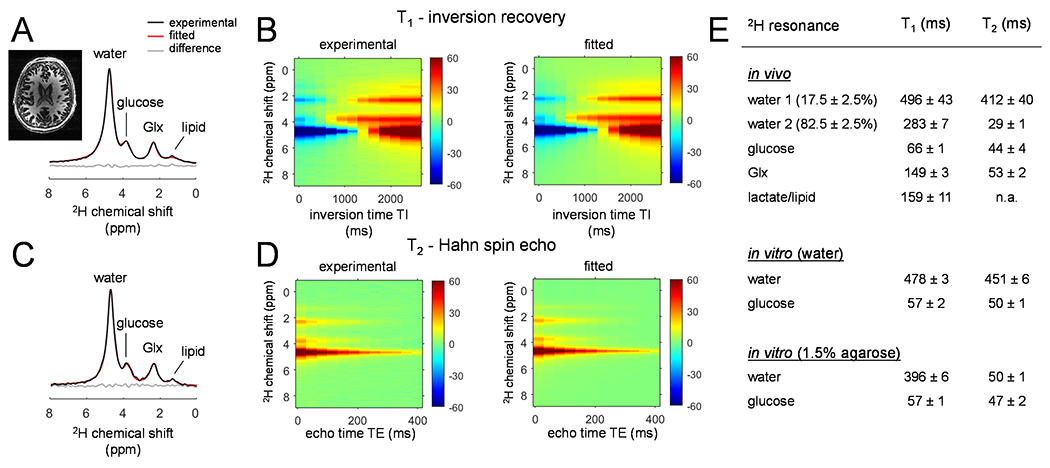
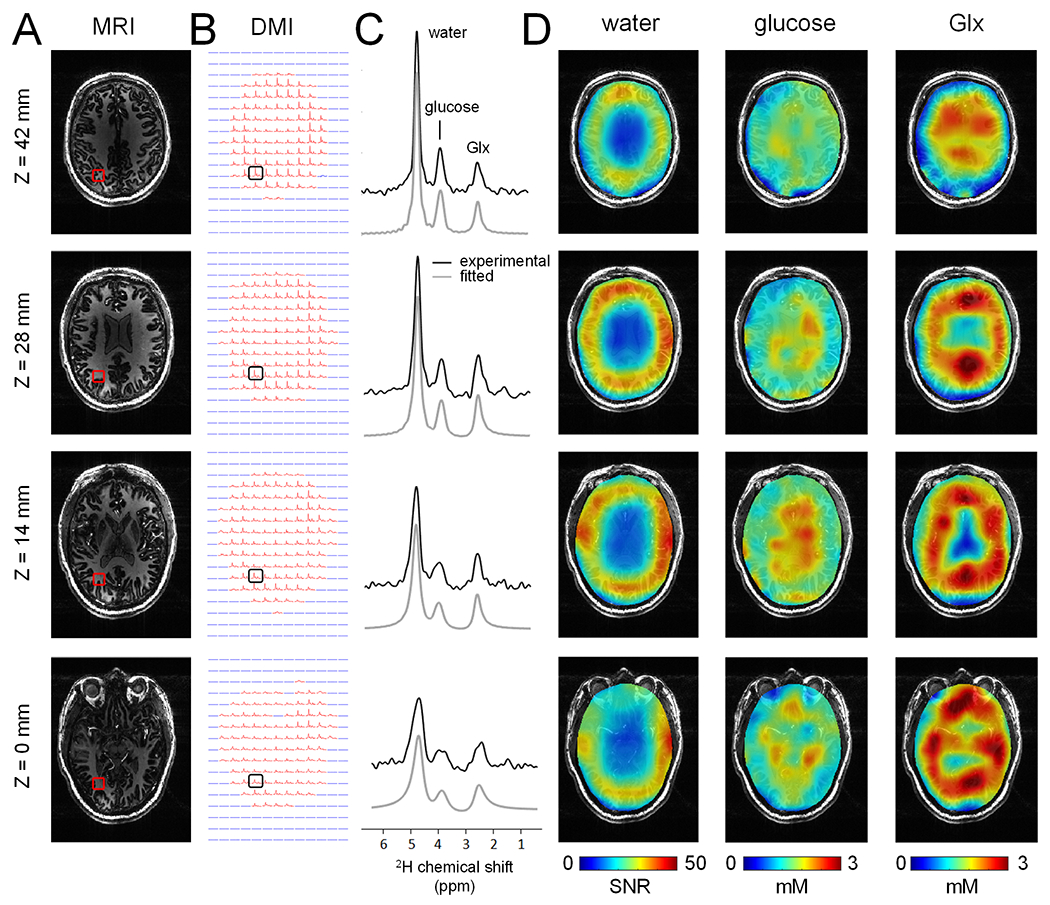
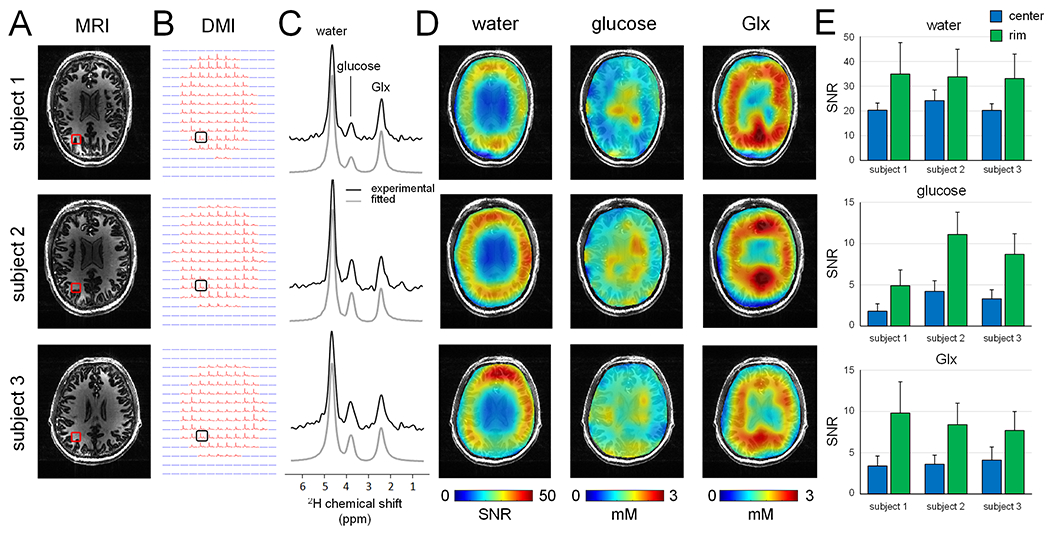
Methods: 1 H-MR images and localized 2 H MR spectra were acquired in vivo in the human brain of 3 healthy subjects to generate DMI maps of 2 H-labeled water, glucose, and glutamate/glutamine (Glx). In addition, non-localized 2 H-MR spectra were acquired both in vivo and in vitro to determine T1 and T2 relaxation times of deuterated metabolites at 7 T. The performance of the 2 H coil was assessed through numeric simulations and experimentally acquired B1 + maps.

Results: 3D DMI maps covering the entire human brain in vivo were obtained from well-resolved deuterated (2 H) metabolite resonances of water, glucose, and Glx. The T1 and T2 relaxation times were consistent with those reported at adjacent field strengths. Experimental B1 + maps were in good agreement with simulations, indicating efficient and homogeneous B1 + transmission and low RF power deposition for 2 H, consistent with a similar array coil design reported at 9.4 T.

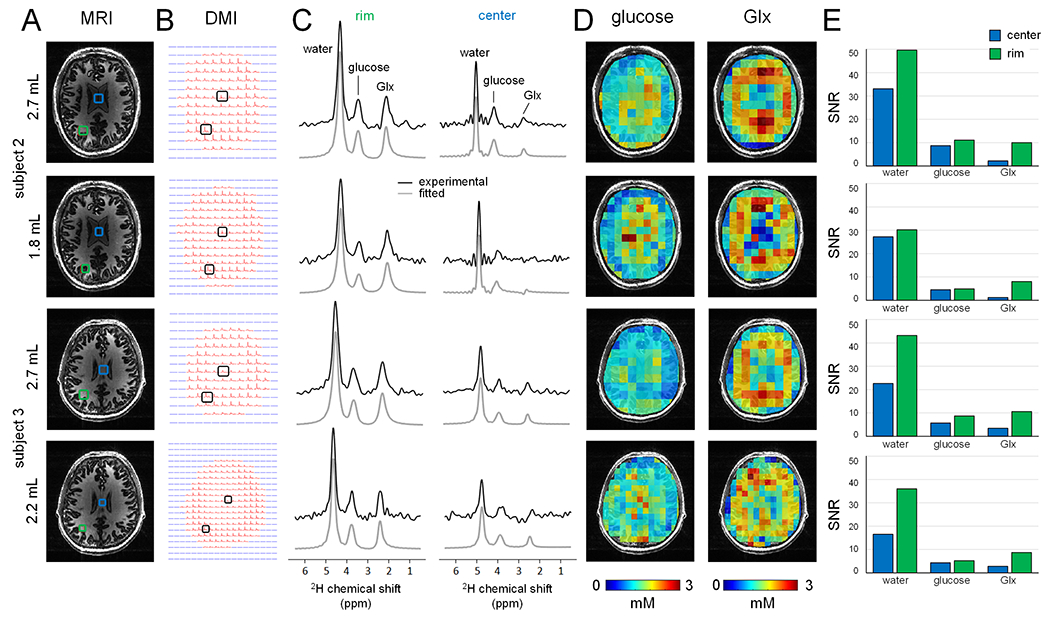
Conclusion: Here, we have demonstrated the successful implementation of 3D DMI in the human brain in vivo at 7 T. The spatial and temporal nominal resolutions achieved at 7 T (i.e., 2.7 mL in 28 min, respectively) were close to those achieved at 9.4 T and greatly outperformed DMI at lower magnetic fields. DMI at 7 T and beyond has clear potential in applications dealing with small brain lesions.

Keywords: 7 Tesla (7 T); brain energy metabolism; deuterium (2H); deuterium metabolic imaging (DMI); glucose; glutamate/glutamine (Glx); human brain; water.


Figures

Figure 1:
Figure 1:
(A) Schematic diagram of the hardware adjustments needed to enable deuterium (2H) MR on a 7 T Siemens Magnetom scanner. An external signal generator was used to generate a frequency 2 MHz above the 2H Larmor frequency (45.5 MHz). The 2H signal generator was then connected to a power splitter from which the four output cables were connected to the transmitter (LO TRA) and three receiver (LO REC) ports on the Siemens board. A double-tuned 1H/2H RF array coil was used for 1H-based imaging and shimming, after which 2H MR measurements (DMI, T1, T2) were performed following the cable modifications shown.
Figure 2:
Figure 2:
(A) Experimental and (C) simulated RF transmit B1+ maps for 2H at 7 T in the transversal (axial), coronal and sagittal orientations. The experimental B1+ maps, acquired on a 4% deuterated water phantom, were calculated from the sinusoidal dependence of 2H signal on transmit voltage during a 1.0 ms square excitation pulse, as shown for three example points in (B). The outline of the simulated head model (Duke) is overlaid on the maps in (A). (D) Sagittal SAR10g map averaged over 10 g of tissue at 46 MHz simulated for a 1 W input power. B1+ maps for 1H (297.2 MHz) and SAR10g simulations at 46 MHz and 297.2 MHz using Duke and Ella models are shown in Supporting Information Figure S1.
Figure 3:
Figure 3:
(A, C) Non-localized 2H 1D MR spectra acquired from the human brain in vivo at 7 T circa 120 min following [6,6’-2H2]-glucose oral administration. The spectra were acquired (A) at the longest inversion delay (TI = 2,560 ms) and (C) the shortest echo-time (TE = 10 ms) during T1 and T2 measurements, respectively. (B, D) Experimental (left) and fitted (right) (B) T1 inversion recovery and (D) T2 spin-echo data, comprising of multiple chemical shifts modulated across 12 inversion and 12 echo delays, respectively. (E) Summary of the in vivo and in vitro T1 and T2 relaxation times. The T2 of lactate/lipids could not reliably be obtained due to the low sensitivity.
Figure 4:
Figure 4:
(A) T1-weighted MP-RAGE MRIs and (B) DMIs (2.7 mL nominal resolution) displayed as multiple axial planes extracted from 3D datasets, acquired from a single human brain in vivo at 7 T between 75-105 min following oral administration of [6,6’-2H2]-glucose in water. (C) Localized 2H MR spectra from the positions indicated in (B), demonstrating a clear and reproducible pattern of well-separated 2H-labeled signals from water, glucose and Glx. (D) Water SNR map (left) and glucose (middle) and Glx (right) metabolic maps reconstructed from the data in (B). The division of glucose and Glx by water provides quantitative concentration maps, but also removes the coil dependent spatial B1 receive profile.
Figure 5:
Figure 5:
(A) T1-weighted MP-RAGE MRIs and (B) DMIs (2.7 mL nominal resolution) acquired from multiple human subjects in vivo at 7 T between 60 and 105 min following oral administration of [6,6’-2H2]-glucose in water. (C) Localized 2H MR spectra from the positions indicated in (B), revealing a consistent and high-quality spectral pattern across different subjects. Water SNR map (left) and glucose (middle) and Glx (right) metabolic maps reconstructed from the data in (B). (E) Summary of SNR values for water (top), glucose (middle) and Glx (bottom) for all three subjects, analysed for data in the coil center (blue area in water SNR maps in (D)) and at the coil rim/edge. All values represent mean ± standard deviation.
Figure 6:
Figure 6:
(A) T1-weighted MP-RAGE MRIs and (B) DMIs acquired from two human subjects in vivo at 7 T at multiple spatial resolutions for DMI. For subject 2, a standard DMI acquisition (2.7 mL nominal resolution acquired between 75-105 min, first row) is compared to an isotropic 1.8 mL DMI dataset (acquired between 105-135 min, second row). For subject 3, a standard DMI acquisition (2.7 mL nominal resolution acquired between 60-90 min, third row) is compared to an anisotropic 2.2 mL DMI dataset (acquired between 90-120 min, bottom row). (C) Localized 2H MR spectra from the rim/edge (left) and center (right) positions shown in (A). (D) Glucose and Glx metabolic maps. Note that the metabolic maps are displayed at the nominal resolution without spatial interpolation to highlight the actual improvement in spatial resolution. (E) Summary of SNR values for water, glucose and Glx for all spatial resolution, analysed for data in the coil center (blue bars) and at the coil rim/edge (green bars). The higher resolution DMI data generally resulted in a 25 – 40% SNR decrease.

References

    1. De Feyter HM, Behar KL, Corbin ZA, Fulbright RK, Brown PB, McIntyre S, Nixon TW, Rothman DL, de Graaf RA. Deuterium metabolic imaging (DMI) for MRI-based 3D mapping of metabolism in vivo. Sci Adv 2018;4(8):eaat7314. - PMC - PubMed
    1. De Feyter HM, de Graaf RA. Deuterium metabolic imaging - Back to the future. J Magn Reson 2021;326:106932. - PMC - PubMed
    1. de Graaf RA, Rothman DL, Behar KL. State of the art direct 13C and indirect 1H-[13C] NMR spectroscopy in vivo. A practical guide. NMR Biomed 2011;24:958–972. - PMC - PubMed
    1. Rothman DL, de Graaf RA, Hyder F, Mason GF, Behar KL, De Feyter HM. In vivo 13C and 1H-[13C] MRS studies of neuroenergetics and neurotransmitter cycling, applications to neurological and psychiatric disease and brain cancer. NMR Biomed 2019;32(10):e4172. - PubMed
    1. Lu M, Zhu XH, Zhang Y, Mateescu G, Chen W. Quantitative assessment of brain glucose metabolic rates using in vivo deuterium magnetic resonance spectroscopy. J Cereb Blood Flow Metab 2017;37:3518–3530. - PMC - PubMed

Publication types

LinkOut - more resources