. 2022 Oct:103:60-68.
doi: 10.1016/j.parkreldis.2022.08.028. Epub 2022 Aug 28.

Imaging biomarkers for early multiple system atrophy

Affiliations

Imaging biomarkers for early multiple system atrophy

Prashanthi Vemuri et al. Parkinsonism Relat Disord. 2022 Oct.

Abstract

Objective: To systematically evaluate structural MRI and diffusion MRI features for cross-sectional discrimination and tracking of longitudinal disease progression in early multiple system atrophy (MSA).

Methods: In a prospective, longitudinal study of synucleinopathies with imaging on 14 controls and 29 MSA patients recruited at an early disease stage (15 predominant cerebellar ataxia subtype or MSA-C and 14 predominant parkinsonism subtype or MSA-P), we computed regional morphometric and diffusion MRI features. We identified morphometric features by ranking them based on their ability to distinguish MSA-C from controls and MSA-P from controls and evaluated diffusion changes in these regions. For the top performing regions, we evaluated their utility for tracking longitudinal disease progression using imaging from 12-month follow-up and computed sample size estimates for a hypothetical clinical trial in MSA. We also computed these selected morphometric features in an independent validation dataset.

Results: We found that morphometric changes in the cerebellar white matter, brainstem, and pons can separate early MSA-C patients from controls both cross-sectionally and longitudinally (p < 0.01). The putamen and striatum, though useful for separating early MSA-P patients from control subjects at baseline, were not useful for tracking MSA disease progression. Cerebellum white matter diffusion changes aided in capturing early disease related degeneration in MSA.

Interpretation: Regardless of clinically predominant features at the time of MSA assessment, brainstem and cerebellar pathways progressively deteriorate with disease progression. Quantitative measurements of these regions are promising biomarkers for MSA diagnosis in early disease stage and potential surrogate markers for future MSA clinical trials.

Keywords: Imaging biomarkers; MRI; Multiple system atrophy.


Conflict of interest statement

Declaration of competing interest There are no disclosures relevant to this manuscript.

Figures

Figure 1.
Figure 1.
AUROC forest plots with 95% confidence intervals for distinguishing between control and MSA patients for MRI volumes. Red indicates p < 0.001, green indicates 0.001 < p < 0.05, and black indicates p > 0.05. AUROC values are written for the most significant regions. P-values are from an unadjusted Wilcoxon rank-sum test. WM=white matter; GM=gray matter; SCP=superior cerebellar peduncle.
Figure 2.
Figure 2.
Boxplots of change in adjusted volume between the second and first MRI scan for patients in the control, MSA-C and MSA-P groups, using the most significant regions from the AUROC plots in Figure 1. An unadjusted Welch t-test was used for between-group comparisons. Regions separating the two groups at p<0.01 are marked. WM=white matter; SCP=superior cerebellar peduncle.
Figure 3.
Figure 3.
Boxplots of change in FA and MD between the second and first MRI scan for patients in the control, MSA-C and MSA-P groups of the MONITOR study, using the most significant regions from the AUROC plots. MD values are scaled by 10^6 for ease of interpretability. P-values for comparisons of longitudinal change in mean FA and MD using unadjusted Welch’s t-test. Regions separating the two groups at p<0.01 are marked. WM=white matter; FA=fractional anisotropy; MD=mean diffusivity.
Figure 4.
Figure 4.
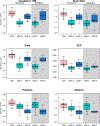
Boxplots of TIV-adjusted baseline volume by diagnostic group and study. The gray background on the right corresponds to boxplots for patients in a validation dataset. WM=white matter; SCP=superior cerebellar peduncle.

References

    1. Gilman S, Wenning GK, Low PA, et al. Second consensus statement on the diagnosis of multiple system atrophy. Neurology. Aug 26 2008;71(9):670–6. doi:10.1212/01.wnl.0000324625.00404.15 - DOI - PMC - PubMed
    1. Low PA, Reich SG, Jankovic J, et al. Natural history of multiple system atrophy in the USA: a prospective cohort study. The Lancet Neurology. Jul 2015;14(7):710–9. doi:10.1016/s1474-4422(15)00058-7 - DOI - PMC - PubMed
    1. Poewe W, Seppi K, Fitzer-Attas CJ, et al. Efficacy of rasagiline in patients with the parkinsonian variant of multiple system atrophy: a randomised, placebo-controlled trial. The Lancet Neurology. Feb 2015;14(2):145–52. doi:10.1016/S1474-4422(14)70288-1 - DOI - PubMed
    1. Low PA, Robertson D, Gilman S, et al. Efficacy and safety of rifampicin for multiple system atrophy: a randomised, double-blind, placebo-controlled trial. The Lancet Neurology. Mar 2014;13(3):268–75. doi:10.1016/s1474-4422(13)70301-6 - DOI - PMC - PubMed
    1. Singer W, Low PA. Optimizing clinical trial design for multiple system atrophy: lessons from the rifampicin study. Clin Auton Res. Feb 2015;25(1):47–52. doi:10.1007/s10286-015-0281-2 - DOI - PMC - PubMed

Publication types