. 2023 Jan;33(1):e13116.
doi: 10.1111/bpa.13116. Epub 2022 Sep 5.

Aβ plaques do not protect against HSV-1 infection in a mouse model of familial Alzheimer's disease, and HSV-1 does not induce Aβ pathology in a model of late onset Alzheimer's disease

Affiliations

Aβ plaques do not protect against HSV-1 infection in a mouse model of familial Alzheimer's disease, and HSV-1 does not induce Aβ pathology in a model of late onset Alzheimer's disease

Olga V Bocharova et al. Brain Pathol. 2023 Jan.

Abstract

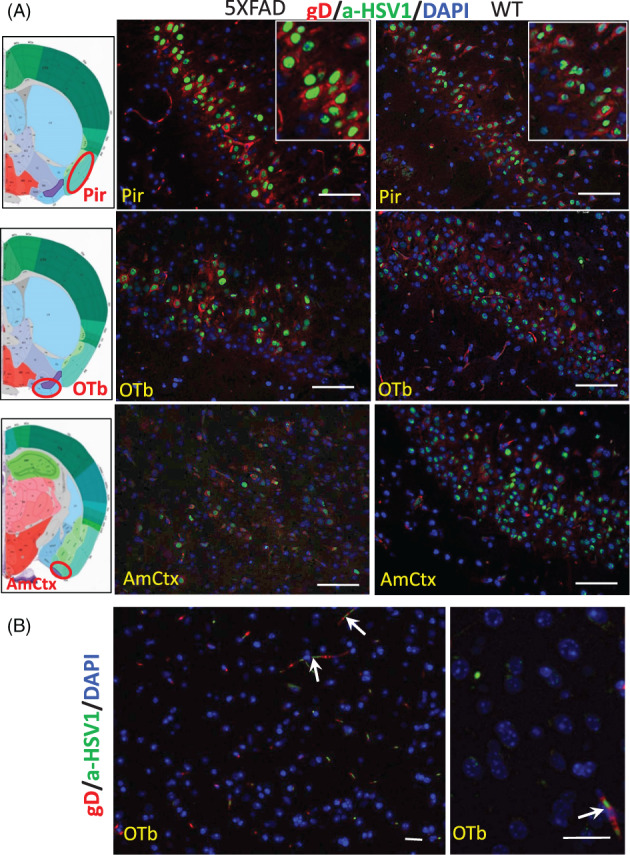
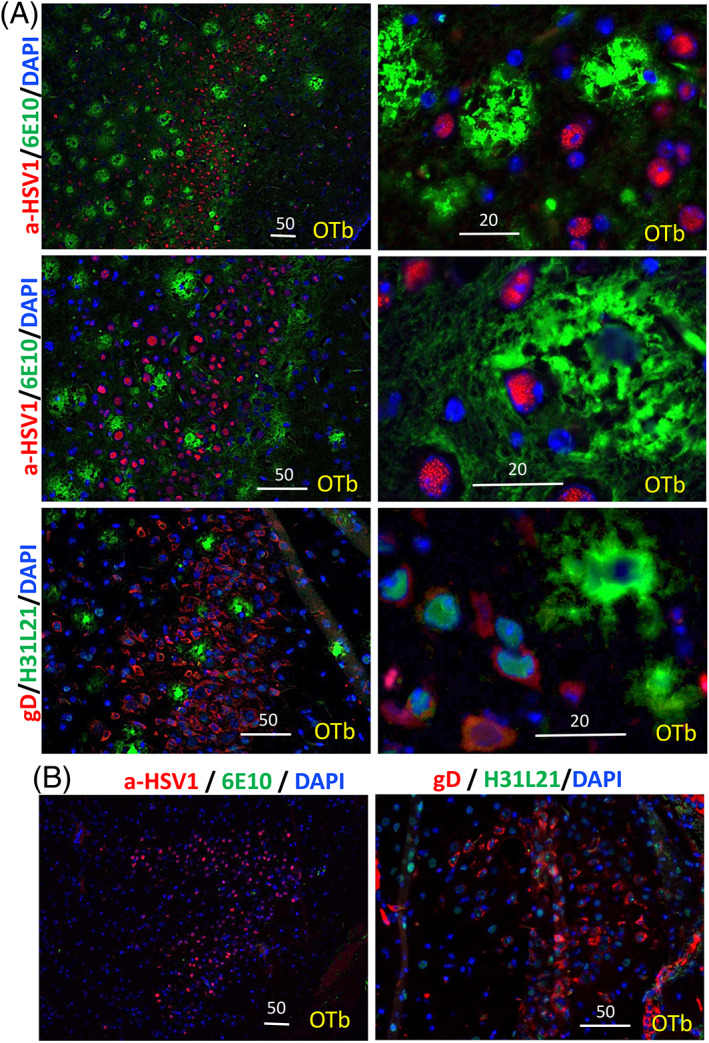
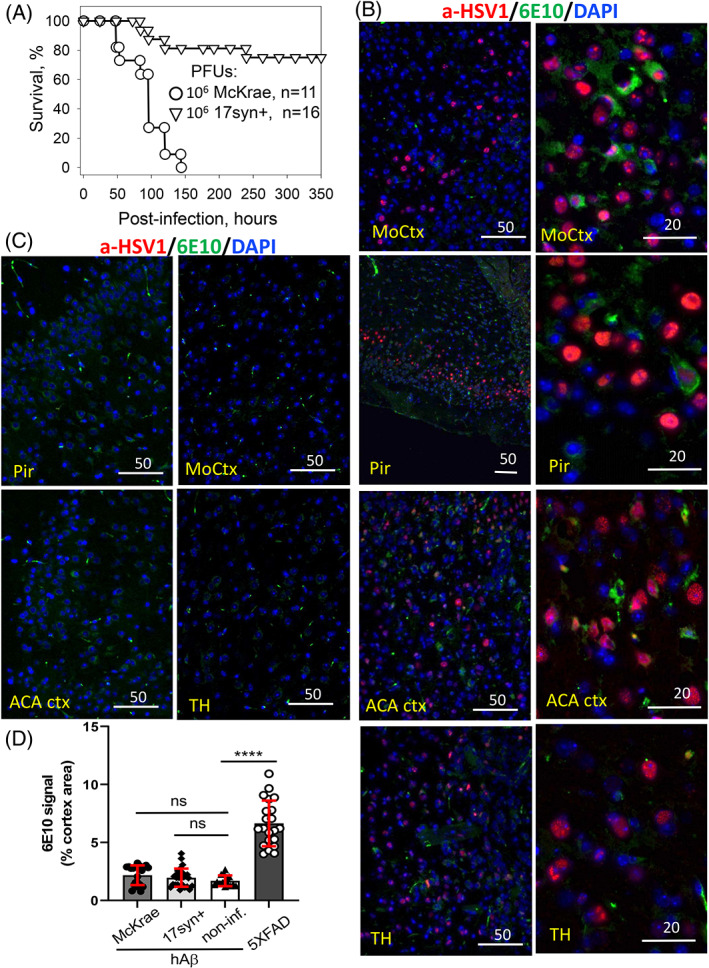
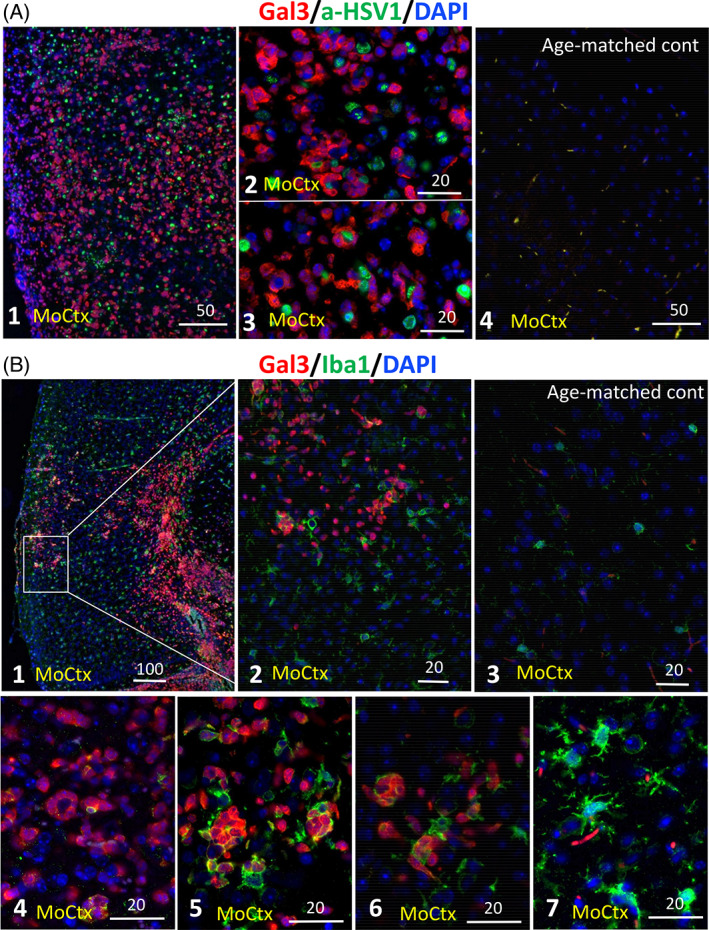
The possibility that the etiology of late onset Alzheimer's disease is linked to viral infections of the CNS has been actively debated in recent years. According to the antiviral protection hypothesis, viral pathogens trigger aggregation of Aβ peptides that are produced as a defense mechanism in response to infection to entrap and neutralize pathogens. To test the causative relationship between viral infection and Aβ aggregation, the current study examined whether Aβ plaques protect the mouse brain against Herpes Simplex Virus 1 (HSV-1) infection introduced via a physiological route and whether HSV-1 infection triggers formation of Aβ plaques in a mouse model of late-onset AD that does not develop Aβ pathology spontaneously. In aged 5XFAD mice infected via eye scarification, high density of Aβ aggregates did not improve survival time or rate when compared with wild type controls. In 5XFADs, viral replication sites were found in brain areas with a high density of extracellular Aβ deposits, however, no association between HSV-1 and Aβ aggregates could be found. To test whether HSV-1 triggers Aβ aggregation in a mouse model that lacks spontaneous Aβ pathology, 13-month-old hAβ/APOE4/Trem2*R47H mice were infected with HSV-1 via eye scarification with the McKrae HSV-1 strain, intracranial inoculation with McKrae, intracranial inoculation after priming with LPS for 6 weeks, or intracranial inoculation with high doses of McKrae or 17syn + strains that represent different degrees of neurovirulence. No signs of Aβ aggregation were found in any of the experimental groups. Instead, extensive infiltration of peripheral leukocytes was observed during the acute stage of HSV-1 infection, and phagocytic activity of myeloid cells was identified as the primary defense mechanism against HSV-1. The current results argue against a direct causative relationship between HSV-1 infection and Aβ pathology.

Keywords: 5XFAD mice; Alzheimer's disease; Aβ aggregates; amyloid precursor protein; hAβ/APOE4/Trem2*R47H mice; herpes simplex virus 1; infiltrating myeloid cells; microglia.


Conflict of interest statement

The authors declare no conflict of interests.

Figures

FIGURE 1
FIGURE 1
Dose–response of 5XFAD and hAβ mouse models to HSV‐1 infection via eye scarification. Survival curves for 14‐month‐old 5XFAD (black circles) and wild‐type B6SJL littermate (WT, white triangles) mice challenged via eye scarification with 6.8 × 104 PFUs (A) or 3.4 × 105 PFUs (B) of McKrae strain per mouse. Survival curve for 12‐month‐old hAβ mice (white squares) challenged via eye scarification with 6.8 × 104 PFUs (A). In A, n = 5 males +4 females for 5XFAD and n = 10 males + 1 female for WT. In B, n = 3 males +6 females for 5XFAD and n = 3 males + 5 female for WT. 5XFAD and WT littermate mice were caged together in random ratios. Individual plots show independent experiments with the number (n) of animals of each genotype indicated. Statistical significance (p) was calculated using the log‐rank (Mantel‐Cox) test.
FIGURE 2
FIGURE 2
Upon challenge via eye scarification, HSV‐1 infection spreads to several brain areas. Co‐immunostaining for HSV‐1 replication centers (a‐HSV1 antibody, green) and gD (anti‐gD antibody, red) along with nuclei (DAPI, blue) in 14‐month‐old 5XFAD (n = 7 mice) and WT mice (n = 7 mice) challenged via eye scarification with 6.8 × 104 PFUs of McKrae (A), or in noninfected 14‐month‐old 5XFAD (n = 6 mice) (B). Animals were examined at 160–250 h postinfection. AmCtx, amygdala cortex; OTb, olfactory tubercle; Pir, piriform cortex. Insets in A show high magnification images. Arrows point at staining of blood vessels. Scale bars = 50 μm in A and 20 μm in B.
FIGURE 3
FIGURE 3
Lack of association between HSV‐1 and Aβ aggregates in aged 5XFAD mice. Co‐immunostaining for Aβ aggregates (6E10 antibody, green) and HSV‐1 virus (a‐HSV1 antibody, red), or Aβ plaques (H31L21 antibody, green) and HSV‐1 virus (anti‐gD antibody, red) along with nuclei (DAPI, blue) in 14‐month‐old 5XFAD mice (n = 9 mice) (A) or WT mice (n = 6 mice) (B) infected with 3.4 × 105 PFUs per mouse via eye scarification. OTb, olfactory tubercle. Scale bars = 50 or 20 μm.
FIGURE 4
FIGURE 4
Characterization of aged hAβ mice. (A) Western blot of 1‐year‐old hAβ mice (n = 3), control APOE4/Trem2*R47H mice that express mouse APP (hAβ−/−, n = 3) and 5XFAD mouse used as a reference strained with 6E10. (B) Co‐immunostaining of 1‐year‐old hAβ (n = 3), hAβ−/− (n = 3) and 5XFAD mice using 6E10 (red) and anti‐Iba1 (green) antibodies. Expression of cellular APP with humanized Aβ segment is observed in hAβ but not hAβ−/− mice. Both hAβ and hAβ−/− lack extracellular Aβ aggregates that can be seen in 5XFAD mice. Arrows point at Aβ plaques in 5XFAD mice. (C) Co‐immunostaining of 22‐ to 24‐month‐old hAβ mice using 6E10 (red) and anti‐Iba1 (green) antibodies (n = 5). While intracellular expression of APP can be seen in multiple brain regions, no Aβ plaques or extracellular Aβ aggregates can be found. DG, dentate gyrus; MoCtx, motor cortex; TH, thalamus; Pir, piriform cortex; HT, hypothalamus. Scale bars = 50 μm in B and 50 and 10 μm in C.
FIGURE 5
FIGURE 5
Upon challenge of hAβ mice via eye scarification, HSV‐1 replicates in a brain but does not induce Aβ pathology. 12‐month‐old hAβ mice were infected with 6.8 × 104 PFUs McKrae strain of HSV‐1 via eye scarification and examined 160–230 h postchallenge using co‐immunostaining for HSV‐1 replication centers (a‐HSV1 antibody, green) and gD (anti‐gD antibody, red), n = 6 (A); for Aβ aggregates (6E10 antibody, green) and HSV‐1 virus (a‐HSV1 antibody, red), n = 6 (B), or for myeloid cells (anti‐Iba1 antibody, green) and gD (anti‐gD antibody, red), n = 2 (C). Noninfected, age‐matched hAβ control stained with anti‐Iba1 and anti‐gD antibodies is shown in C. Nuclei stained with DAPI (blue). Pir, piriform cortex; OTb, olfactory tubercle; AmCtx, amygdala cortex. Scale bars = 20, 50 or 100 μm. (D) Quantification of percent area covered by 6E10 signal in cortex of hAβ mice infected with HSV‐1 (n = 3), noninfected hAβ mice and noninfected 12‐month old 5XFAD mice (n = 4) provided as references [8, 9, 10, 11, 12, 13, 14, 15, 16, 17, 18, 19, 20, 21, 22] fields of view were analyzed for each group. Data expressed as mean ± SD, unpaired parametric two‐tailed t‐test was used, ****p < 0.0001, ns = not statistically significant.
FIGURE 6
FIGURE 6
HSV‐1 does not induce Aβ pathology in hAβ mice upon intracranial challenge. (A) Survival curves for 13‐month‐old hAβ mice challenged IC with 2 × 103 PFUs (triangles) or 103 PFUs (squares) of McKrae strain per mouse. (B) Co‐immunostaining for HSV‐1 replication centers (a‐HSV1 antibody, green) and gD (anti‐gD antibody, red) along with nuclei (DAPI, blue) in 13‐month‐old hAβ mice (n = 17) that succumbed to acute HSE. (C) Co‐immunostaining of 13‐month‐old hAβ using 6E10 (green) and a‐HSV1 (red) antibodies along with nuclei (DAPI, blue). (D) Co‐immunostaining for HSV‐1 replication centers (a‐HSV1 antibody, green) and 6E10 (green) along with nuclei (DAPI, blue) in 13‐month‐old hAβ mice (n = 6) that survived IC challenge. In B and C, animals were examined at 96–200 h postinfection. In D, animals were examined at 42 days postinfection. AmCtx, amygdala cortex; HT, hypothalamus; CC, corpus callosum; DG, dentate gyrus; TH, thalamus; Pir, piriform cortex; Arrows point at staining of blood vessels. Scale bars = 50 μm. (E) Quantification of percent area covered by 6E10 signal in cortex of noninfected hAβ mice (n = 5), hAβ mice infected with 2 × 103 PFUs of McKrae that succumbed to acute HSE (n = 4) or survived HSV‐1 challenge and examined at 42 days postinfection (n = 4), or noninfected 12‐month old 5XFAD mice (n = 4) provided as references [8, 9, 10, 11, 12, 13, 14, 15, 16, 17, 18, 19, 20, 21] fields of view were analyzed for each group. Data expressed as mean ± SD, unpaired parametric two‐tailed t‐test was used, ****p < 0.0001, ns = not statistically significant.
FIGURE 7
FIGURE 7
HSV‐1 does not induce Aβ pathology in hAβ mice primed with LPS. (A) Survival curves for 13‐month‐old hAβ that were challenged IC with 2 × 103 PFUs of McKrae strain per mouse or injected IP with LPS once per week for 6 consecutive weeks and then challenged IC with McKrae. Statistical significance (p) was calculated using the log‐rank (Mantel‐Cox) test. (B) Co‐immunostaining of hAβ mice that were primed with LPS, challenged with 2 × 103 PFUs of McKrae and succumbed to acute HSE using 6E10 (green) and a‐HSV1 (red) antibodies along with nuclei (DAPI, blue) (n = 6). (C) Schematic diagram illustrating experimental and control hAβ groups, and qantification of percent area covered by 6E10 signal in cortex of mice of the following groups: HSV‐1, hAβ mice challanged with 2 × 103 PFUs of McKrae (n = 3); LPS + HSV‐1, hAβ mice treated with LPS, then challenged with 2 × 103 PFUs of McKrae and succumbed to acute HSE (n = 3); LPS + PBS, hAβ mice treated with LPS, then inoculated IC with PBS (n = 3); PBS, hAβ mice inoculated with PBS for 6 weeks instead of LPS (n = 3). Quantification in noninfected 12‐month old 5XFAD mice (n = 4) provided as references [10, 11, 12, 13, 14, 15, 16, 17, 18, 19, 20, 21, 22] fields of view were analyzed for each group. Data expressed as mean ± SD, unpaired parametric two‐tailed t‐test was used, ****p < 0.0001, ns = not statistically significant. (D) Co‐immunostaining of 13‐month‐old LPS + PBS hAβ control group using 6E10 (green) and a‐HSV1 (red) antibodies along with nuclei (DAPI, blue) (n = 5). AudCtx, auditory cortex; HT, hypothalamus; MoCtx, motor cortex; Pir, piriform cortex. Arrows point at staining of blood vessels. Scale bars = 50 and 10 μm.
FIGURE 8
FIGURE 8
HSV‐1 does not induce Aβ pathology in hAβ mice upon intracranial challenge with high viral doses. (A) Survival curves for 13‐month‐old hAβ mice challenged IC with 106 PFUs per mouse of McKrae (circles) or 17syn + strain (triangles). (B) Co‐immunostaining for HSV‐1 replication centers (a‐HSV1 antibody, red) and 6E10 antibody (red) along with nuclei (DAPI, blue) in 13‐month‐old hAβ mice (n = 9) that succumbed to acute HSE upon challenge with 106 PFUs of McKrae. (C) Co‐immunostaining for HSV‐1 replication centers (a‐HSV1 antibody, red) and 6E10 antibody (green) along with nuclei (DAPI, blue) in 13‐month‐old hAβ mice that survived challenge with 106 PFUs of 17syn + (n = 5). Animals were examined at 336 h postinfection. MoCtx, motor cortex; Pir, piriform cortex; ACA Ctx, anterior cingulate area cortex; TH, thalamus. Scale bars = 20 or 50 μm. (D) Quantification of percent area covered by 6E10 signal in cortex of hAβ mice infected with McKrae (n = 6) or 17Syn + (n = 3) that succumbed to acute HSE, noninfected hAβ mice (n = 5), or noninfected 12‐month old 5XFAD mice (n = 4) provided as references [14, 15, 16, 17, 18, 19, 20, 21, 22, 23, 24, 25, 26, 27] fields of view were analyzed for each group. Data expressed as mean ± SD, unpaired parametric two‐tailed t‐test was used, ****p < 0.0001, ns = not statistically significant.
FIGURE 9
FIGURE 9
HSV‐1 infects APP‐positive and APP‐negative neurons. (A) 13‐month‐old hAβ that succumbed to HSE upon IC challenge with 2 × 103 PFUs of McKrae were co‐immunostained for APP/Aβ (6E10 antibody, green) and HSV‐1 replication centers (a‐HSV1 antibodies, red) along with nuclei (DAPI, blue) and examined using confocal microscopy. Scale bars = 20 μm. (B) Quantification of intracellular APP/Aβ levels using staining with 6E10 antibody in individual HSV‐1‐infected cells in 13‐month‐old hAβ mice that succumbed to acute HSE (n = 3, 447 cells) and in noninfected age‐matched control hAβ mice (n = 3, 1499 cells). Quantification of intracellular APP/Aβ levels in noninfected, age‐matched 5XFAD (n = 3, 519 cells) is provided as reference. The dashed lines in violone plots show the median and quartiles. P is calculated using an unpaired nonparametric two‐tailed Mann–Whitney U test.
FIGURE 10
FIGURE 10
hAβ mice are susceptible to prion disease. hAβ and C57Bl.6J female and male mice were infected with the SSLOW prion strain via the intraperitoneal route. (A) Co‐immunostaining of presymptomatic hAβ mice at 115 days postinfection with SSLOW and age‐matched controls for microglia (anti‐Iba1 antibody, green) and PrPSc (SAF‐84 antibody, red). Arrows point at PrPSc deposits colocalized with microglia. (B) Co‐immunostaining of terminal hAβ mice infected with SSLOW for microglia (anti‐Iba1 antibody, green) and APP (6E10 antibody, red). Arrows point at reactive microglia engulfing neurons. Hp, hippocampus; Ctx, cortex. Scale bars = 20 μm. (C) Incubation time to terminal diseases in hAβ and C57Bl.6J mice inoculated with 1% SSLOW brain homogenate via the intraperitoneal route. The groups were compared by Student's unpaired t test.
FIGURE 11
FIGURE 11
Flow cytometry analysis of resident and infiltrating myeloid cells and their phagocytic activity. 13‐month‐old hAβ mice were challenged IC with 106 PFUs of McKrae per mouse or mock inoculum (Мock CNL) and analyzed by flow cytometry at 72 h postinfection. (A) Representative dot plots show the relative composition of brain‐resident microglia (MG, CD45intCD11b+Ly6C), infiltrating lymphocytes (iLym, CD45hiCD11b), and infiltrating myeloid cells (iMy, CD45hiCD11b+) in control and infected mice. (B) The number of each cell population per hemisphere for each group is quantified. (C) Representative histograms depict the relative intensity level of the neuronal antigen, NeuN, and the phagocytic marker, CD68, inside mock control (in blue) and HSV‐1 (in red) microglia and infiltrating myeloid cells (in orange). (D) The number of NeuN‐positive and CD68‐positive phagocytic myeloid cells per hemisphere is quantified. Representative dot plots illustrate the percentage of microglia and infiltrating myeloid cells that engulfed (E) 0.5 μm and (F) 1.0 μm fluorescent latex beads at 72 h postinfection. (G) The total number of bead‐positive phagocytes in each group is quantified. For panel B, data were combined from two independent experiments. For all experiments, the number of animals were 4–5 per group. For all histograms, fluorescence minus one (FMO) controls are shown in gray. CTL, control; hi, high; HSV‐1, herpes simplex virus‐1; iMy, infiltrating myeloid cells; iLym, infiltrating lymphocytes; int, intermediate; MG, microglia; Max, Maximum; ns, not significant; SSC‐A, side scatter‐area. Data expressed as mean ± SEM. Data were analyzed using two‐way ANNOVA with Sidak's multiple comparisond test, with individual variances computed for each comparison and expressed as mean ± SD (*p < 0.05, ***p < 0.0005, and ****p < 0.00005).
FIGURE 12
FIGURE 12
Infiltration of Gal3‐positive cells in the infection sites of hAβ mice during acute HSE. 13‐month‐old hAβ mice were challenged IC with 2 × 103 PFUs of McKrae per mouse. Mice that succumbed to HSE 96–200 h postinfection were analyzed using co‐immunostaining with anti‐Gal3 (red) and a‐HSV1 (green) antibodies n = 9 (A), or anti‐Gal3 (red) and anti‐Iba1 (green) antibodies n = 9 (B). In A, panel 2 shows field of view different from panels 1 and 3. Panel 4 in A and panel 3 in B show co‐immunostaining of mock age‐matched controls. MoCtx, motor cortex. Scale bars = 20, 50, or 100 μm.

Similar articles

Cited by

References

    1. Glenner GG, Wong CW. Alzheimer's disease: initial report of the purification and characterization of a novel cerebrovascular amyloid protein. Biochem Biophys Res Commun. 1984;120:885–90. - PubMed
    1. Goate A, Chartier‐Harlin MC, Mullan M, Brown J, Crawford F, Fidani L, et al. Segregation of a missense mutation in the amyloid precursor protein gene with familial Alzheimer's disease. Nature. 1991;349:704–6. - PubMed
    1. Hardy JA, Higgins GA. Alzheimer's disease: the amyloid cascade hypothesis. Science. 1992;256(5054):184–5. - PubMed
    1. Piacentini R, De Chiara G, Li Puma DD, Ripoli C, Marcocci ME, Garaci E, et al. HSV‐1 and Alzheimer's disease: more than a hypothesis. Front Pharmacol. 2014;5:97. - PMC - PubMed
    1. Itzhaki RF, Wozniak MA, Appelt DM, Balin BJ. Infiltration of the brain by pathogens causes Alzheimer's disease. Neurobiol Aging. 2004;25(5):619–27. - PubMed

Publication types