. 2022 Sep 5;17(1):60.
doi: 10.1186/s13024-022-00564-6.

Aging exacerbates the brain inflammatory micro-environment contributing to α-synuclein pathology and functional deficits in a mouse model of DLB/PD

Affiliations

Aging exacerbates the brain inflammatory micro-environment contributing to α-synuclein pathology and functional deficits in a mouse model of DLB/PD

Michiyo Iba et al. Mol Neurodegener. .

Retraction in

Abstract

Background: Although ɑ-synuclein (ɑ-syn) spreading in age-related neurodegenerative diseases such as Parkinson's disease (PD) and Dementia with Lewy bodies (DLB) has been extensively investigated, the role of aging in the manifestation of disease remains unclear.

Methods: We explored the role of aging and inflammation in the pathogenesis of synucleinopathies in a mouse model of DLB/PD initiated by intrastriatal injection of ɑ-syn preformed fibrils (pff).

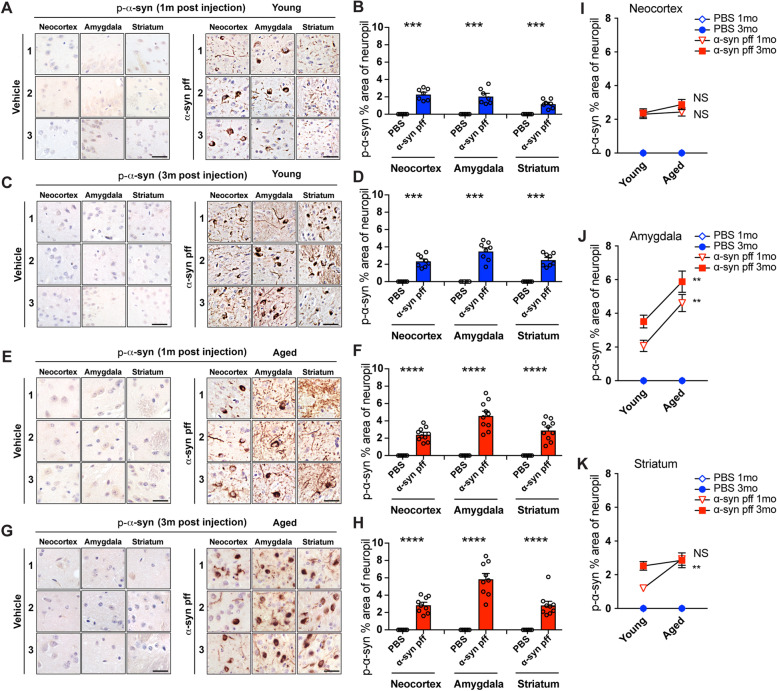
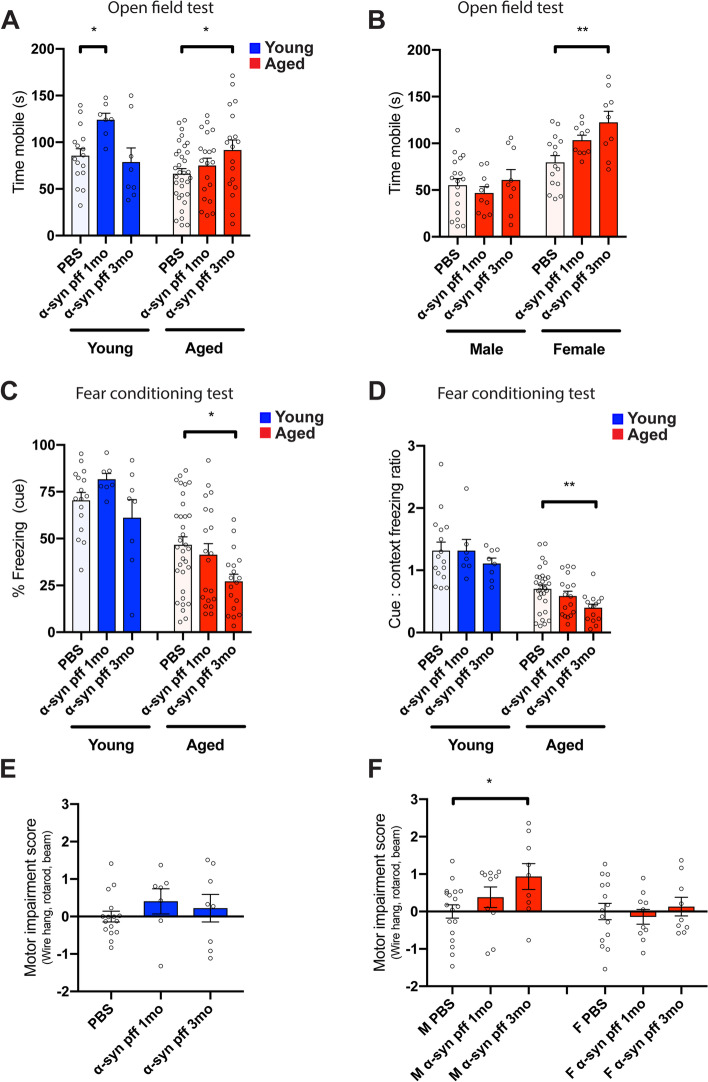
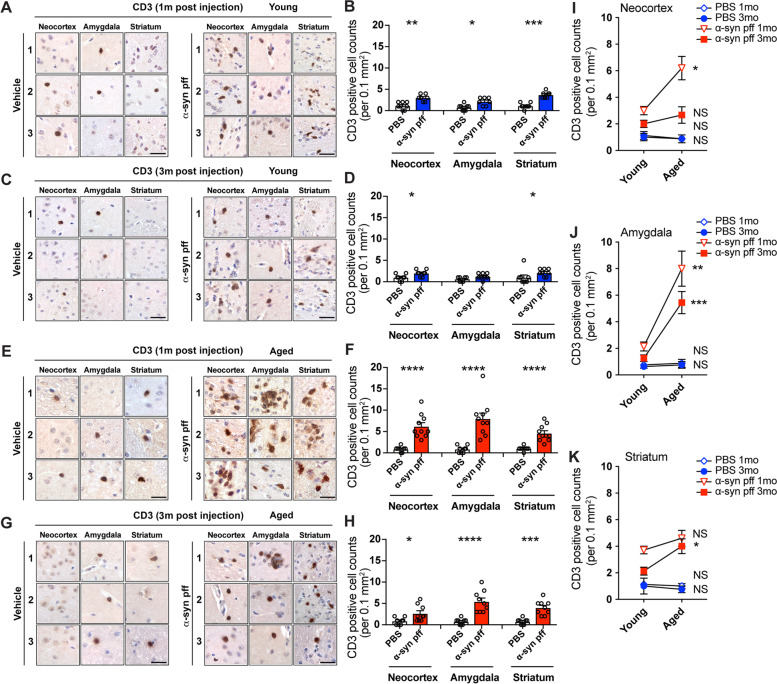
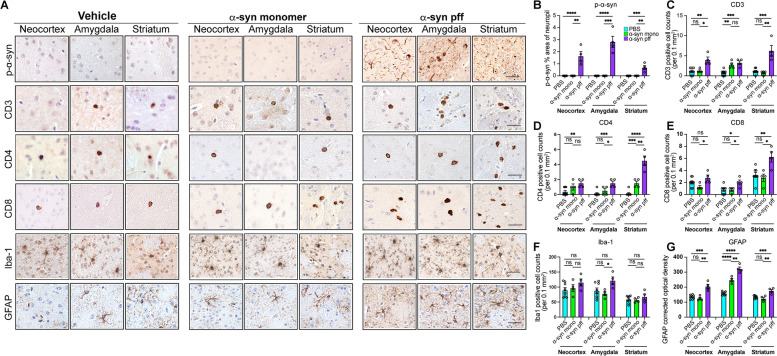
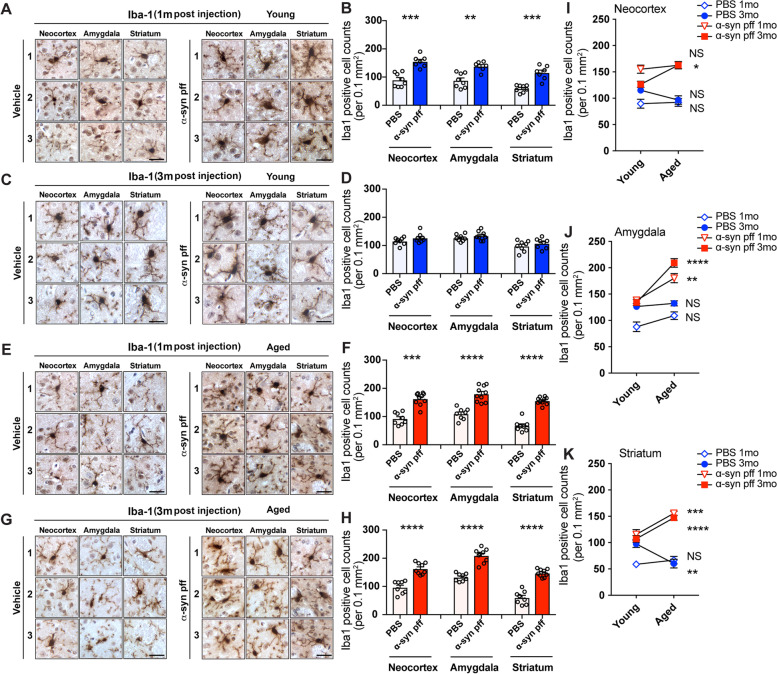
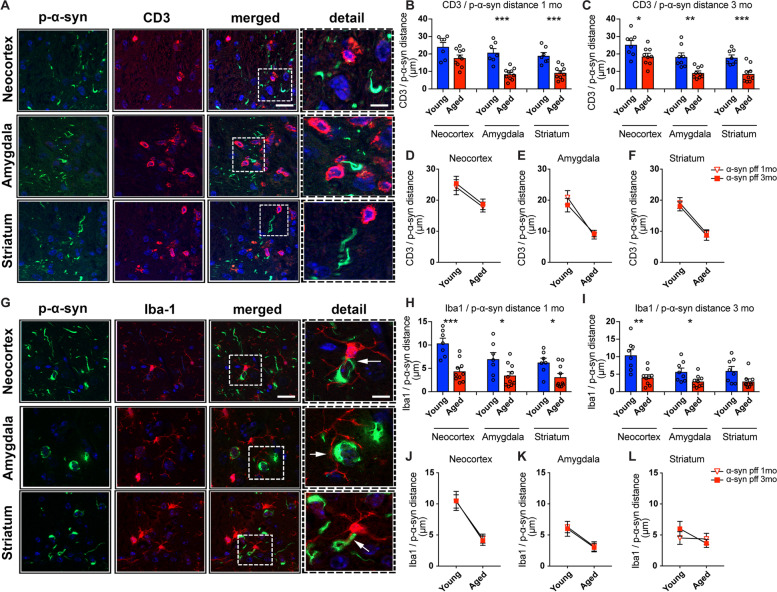
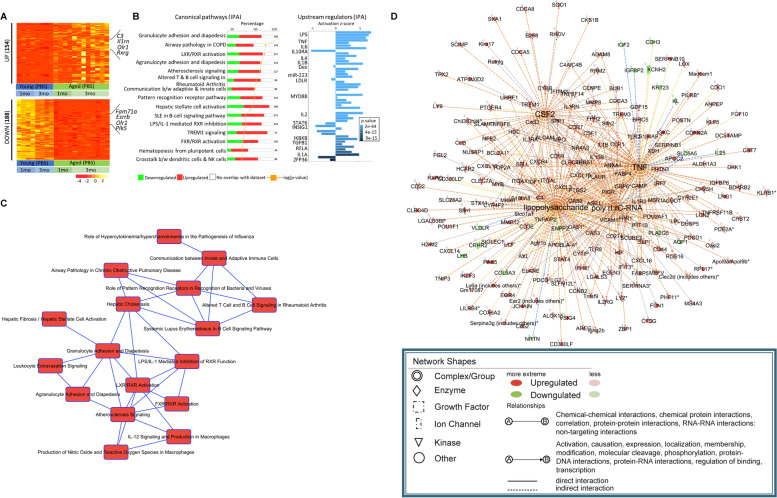
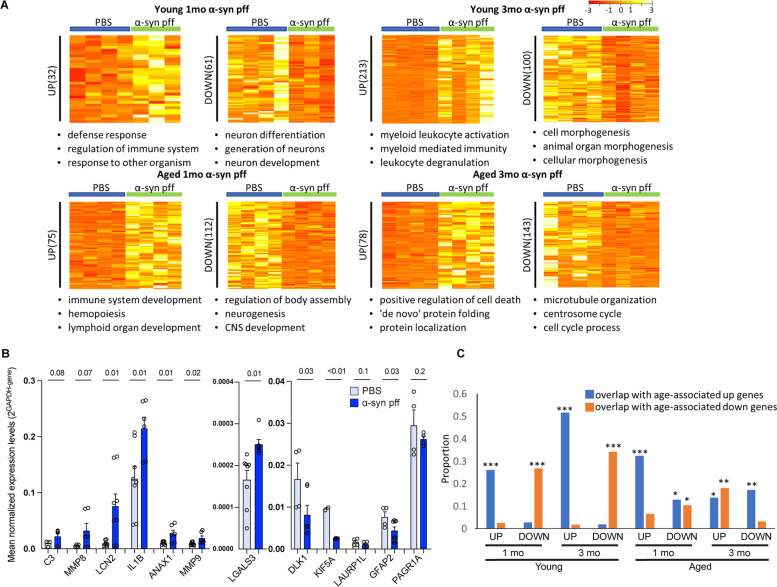
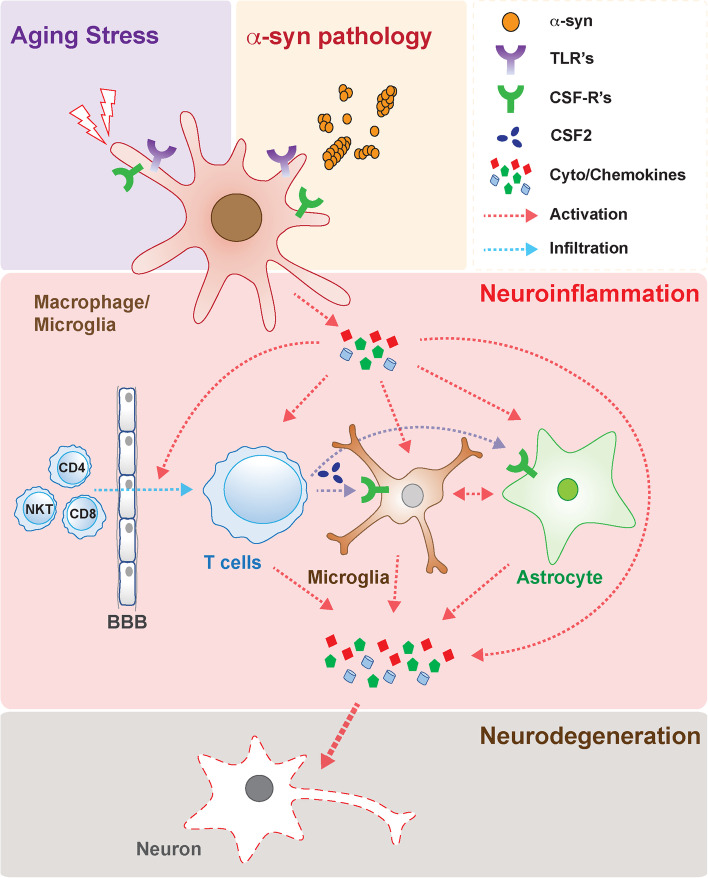
Results: We found that aged mice showed more extensive accumulation of ɑ-syn in selected brain regions and behavioral deficits that were associated with greater infiltration of T cells and microgliosis. Microglial inflammatory gene expression induced by ɑ-syn-pff injection in young mice had hallmarks of aged microglia, indicating that enhanced age-associated pathologies may result from inflammatory synergy between aging and the effects of ɑ-syn aggregation. Based on the transcriptomics analysis projected from Ingenuity Pathway Analysis, we found a network that included colony stimulating factor 2 (CSF2), LPS related genes, TNFɑ and poly rl:rC-RNA as common regulators.

Conclusions: We propose that aging related inflammation (eg: CSF2) influences outcomes of pathological spreading of ɑ-syn and suggest that targeting neuro-immune responses might be important in developing treatments for DLB/PD.

Keywords: Aging; Dementia with Lewy bodies; Inflammation; Microglia; Neurodegeneration; Parkinson’s disease; Preformed fibrils; RNA-seq; T cell infiltration; ɑ-synuclein.


Conflict of interest statement

The authors declare no competing interests.

Figures

Fig. 1
Fig. 1
Phosphorylated-ɑ-syn immunostaining in young and aged mice with PBS or ɑ-syn pff injection. A Representative images of p-ɑ-syn immunostaining in young mouse cohort at 1-month post injection. Images are from three different mice (1, 2 and 3) of three brain regions (M1/M2 or somatosensory cortex (Neocortex), basolateral/basomedial amygdala (Amygdala), and dorsal striatum (Striatum)). Left panels are PBS (vehicle) injected and right are ɑ-syn pff injected. B Image analysis of p-ɑ-syn % area of neuropil of young mouse cohort at 1-month post injection. C p-ɑ-syn immunostaining of young mouse cohort at 3-months post injection. Same format as (A). D Image analysis of p-ɑ-syn % area of neuropil of young mouse cohort at 3-months post injection. E p-ɑ-syn immunostaining of aged mouse cohort at 1-month post injection. Same format as (A). F Image analysis of p-ɑ-syn % area of neuropil of aged mouse cohort at 1-month post injection. G p-ɑ-syn immunostaining of aged mouse cohort at 3-months post injection. Same format as (A). H Image analysis of p-ɑ-syn % area of neuropil of aged mouse cohort at 3-months post injection. I-K Comparison of image analysis of p-ɑ-syn positive % area of neuropil in neocortex (I), amygdala (J) and striatum (K) of ɑ-syn pff injected mice at 1- and 3-months post-injection in young (blue) and aged (red) mouse cohorts. Scale bars, 25 μm. Data are mean ± SEM. Unpaired t test was used. ***p < 0.001; ****p < 0.0001
Fig. 2
Fig. 2
Behavioral analysis of young and aged mice with PBS or ɑ-syn pff injection. A Time mobile (sec) for the first 3-min bin in the open field test in young and aged mouse cohorts. B Time mobile (sec) for the first 3-min bin in the open field test in the aged mouse cohorts separated by sex. C Percentage of freezing time to the cue in the fear conditioning test. D The ratio of freezing to cue:context in the fear conditioning test. E Combined scores from three locomotor tests (wire hang, rota-rod and horizontal beam). F Each test was normalized by calculating how many standard deviations worse than age/sex-matched PBS controls. Data are mean ± SEM. One-way ANOVA with Dunnett’s post-hoc tests were used. *p < 0.05; **p < 0.01
Fig. 3
Fig. 3
CD3 antibody immunostaining in young and aged mice with PBS or ɑ-syn pff injection. A CD3 immunostaining images of young mouse cohort at 1-month post injection. Images are from three different mice (1, 2 and 3) of three brain regions (M1/M2 or somatosensory cortex (Neocortex), basolateral and basomedial amygdala (Amygdala), and dorsal striatum (Striatum)). Left panels are PBS (vehicle) injected and right are ɑ-syn pff injected. B Image analysis of CD3 positive cell counts per 0.1mm2 of young mouse cohort at 1-month post injection. C CD3 immunostaining images of young mouse cohort at 3-months post injection. Same format as (A). D Image analysis of CD3 positive cell counts per 0.1mm2 of young mouse cohort at 3-months post injection. E CD3 immunostaining images of aged mouse cohort at 1-month post injection. Same format as (A). F Quantitative analysis of CD3 positive cell counts per 0.1mm2 of aged mouse cohort at 1-month post injection. G CD3 immunostaining images of aged mouse cohort at 3-months post injection. Same format as (A). H Image analysis of CD3 positive cell counts per 0.1mm2 of aged mouse cohort at 3-months post injection. I-K Comparison of image analysis of CD3 positive cell counts per 0.1 mm.2 in neocortex (I) amygdala (J) and striatum (K) of ɑ-syn pff injected mice at 1- and 3-months post-injection in young (blue) and aged (red) mouse cohorts. Scale bars, 40 μm. Data are mean ± SEM. Unpaired t test was used. *p < 0.05; **p < 0.01; ***p < 0.001; ****p < 0.0001
Fig. 4
Fig. 4
Comparison of the immune response effects of monomeric vs ɑ-syn pff in young mice. A Representative images for p- ɑ-syn, CD3, CD4, CD8, Iba-1 and GFAP immunostaining of young mouse cohort at 1-month post injection. Images are from three brain regions (M1/M2 or somatosensory cortex (Neocortex), basolateral and basomedial amygdala (Amygdala), and dorsal striatum (Striatum)). Left panels are PBS (vehicle) injected, the panels in the middle are from mice injected with the ɑ-syn monomer and to the right are ɑ-syn pff injected. B Image analysis of p-ɑ-syn % area of neuropil. C Image analysis of CD3 positive cell counts per 0.1 mm2. D Image analysis of CD4 positive cell counts per 0.1 mm2. E Image analysis of CD8 positive cell counts per 0.1 mm2. F Image analysis of Iba-1 positive cell counts per 0.1 mm2. G Image analysis of GFAP optical density. Data are mean ± SEM. One-way ANOVA with Tukey’s post hoc test was used. *p < 0.05; **p < 0.01; ***p < 0.001; ****p < 0.0001. Scale bar, 40 μm
Fig. 5
Fig. 5
Iba1 antibody immunostaining in young and aged mice with PBS or ɑ-syn pff injection. A Representative images for Iba1 immunostaining in young mouse cohort at 1-month post injection. Images are from three different mice (1, 2 and 3) of three brain regions (M1/M2 or somatosensory cortex (Neocortex), basolateral and basomedial amygdala (Amygdala), and dorsal striatum (Striatum)). Left panels are PBS (vehicle) injected and right are ɑ-syn pff injected. B Image analysis of Iba1 positive cell counts per 0.1mm2 of young mouse cohort at 1-month post injection. C Iba1 immunostaining of young mouse cohort at 3-months post injection. Same format as (A). D Image analysis of Iba1 positive cell counts per 0.1mm2 of young mouse cohort at 3-months post injection. E Iba1 immunostaining of aged mouse cohort at 1-month post injection. Same format as (A). F Image analysis of Iba1 positive cell counts per 0.1mm2 of aged mouse cohort at 1-month post injection. G Iba1 immunostaining of aged mouse cohort at 3-months post injection. Same format as (A). H Image analysis of Iba1 positive cell counts per 0.1mm2 of aged mouse cohort at 3-months post injection. I-K Comparison of image analysis of Iba1 positive cell counts per 0.1mm2 in cortex (I) amygdala (J) and striatum (K) of ɑ-syn pff injected mice at 1- and 3-months post-injection in young (blue) and aged (red) mouse cohorts. Scale bars, 20 μm. Data are mean ± SEM. Unpaired t test was used. **p < 0.01; ***p < 0.001; ****p < 0.0001
Fig. 6
Fig. 6
Double immune-fluorescence analysis in young and aged mice with ɑ-syn pff injection. A Double immunofluorescence staining with phosphorylated ɑ-syn (p-ɑ-syn, 81A) and CD3 antibodies. Split and merged representative microscopy images from the somatosensory cortex, basolateral and basomedial amygdala, and dorsal striatum of ɑ-syn pff injected aged mouse double labeled with antibodies against p-ɑ-syn (green) and CD3 cells (T cells, red channel). B, C Quantitative analysis of distances between p-ɑ-syn and CD3 cells in neocortex, amygdala, and striatum in 1-month (B) or 3-months (C) post injection. D-F Comparison of image analysis of proximity between p-ɑ-syn and CD3 cells in neocortex, amygdala, and striatum in young and aged mouse cohorts. G Double immunofluorescence staining with Iba1 and CD3 antibodies. Split and merged representative microscopy images from the neocortex, amygdala, and striatum of ɑ-syn pff injected aged mouse double labeled with antibodies against p-ɑ-syn (green) and Iba1 (microglia cells, red channel). H, I Quantitative analysis of distances between p-ɑ-syn and microglia cells in neocortex, amygdala, and striatum in 1-month (H) or 3-months (I) post injection. J-L Comparison of image analysis of proximity between p-ɑ-syn and microglia cells in neocortex, amygdala, and striatum in young and aged mouse cohorts. Scale bars, 20 μm in low magnification, 10 μm in the high magnification. Data are mean ± SEM. Unpaired t test was used. * p < 0.05; ** p < 0.01; *** p < 0.001
Fig. 7
Fig. 7
Characterization of age-associated genes in microglia. A RNA from microglia of PBS injected young and aged mice were compared to identify the age-associated differentially expressed genes (DEGs). The RNA-Seq identified 622 up- and 188 downregulated genes (≥ twofold change, p < 0.05) (for visual purpose, 154 ≥ fourfold upregulated genes have been shown). For the age-associated comparison, PBS injected control mice from 1- and 3-months (including repeats) post injection groups were combined and the TpM normalized values of the DEGs are represented in the heatmap. The number of DEGs are mentioned on the left of the heatmap with few of the prominent genes mentioned on the right. B The age-associated differentially expressed genes (both up- and downregulated) were analyzed with IPA to identify enriched canonical pathways (left), and upstream regulators of the genes (right). The canonical pathways show the most enriched biological processes along with the percentage of up-(red) and downregulated (green) genes in each pathway with total number of genes mentioned outside the bar graphs. The -log p-value from the enrichment analysis is represented by a yellow dot. The upstream regulator plot identifies the cascade of upstream transcriptional regulators whose expression is affected by aging. Prominent immune regulators are noted. The bar graph shows the activation Z-score where a positive score implies activation of the transcriptional regulator while the negative score indicates repression. The color of the bar graph represents the p-value. C Based on the canonical pathways derived from IPA, a network was constructed comprising of pathways with more than 5 common enriched genes (or other molecules) that changed with age. D Based on the transcriptional upstream regulators obtained from IPA, a network of the top upstream regulators (CSF2, LPS, TNF and poly rl:rC-RNA) and their target genes (or other molecules) was constructed. This plot shows how the upstream regulator networks overlap via their target genes
Fig. 8
Fig. 8
Effect of ɑ-syn pff injection on microglial gene expression. A Genes dysregulated by 1- and 3-months of ɑ-syn pff injection in young and aged mice were identified by DESeq2 (fold change ≥ 2, p < 0.05). The expression levels of the DEGs are represented as TpM normalized values for young mice in the upper row and for the aged mice in the lower row. The number of DEGs are indicated to the left of the heatmap. The top 3 pathways associated with each group were determined from ToppGene database as shown below the respective heatmaps. B RNA-Seq results were validated by qRT-PCR for selected candidates. Samples were analyzed in duplicate and expression levels were normalized against Gapdh. The mean and standard error are derived from combining all samples in a group. C3, Mmp8 and Lcn2 go up with ɑ-syn pff injection while Dlk1, Kif5a, Laurp1l, Gfap2 and Pagr1a go down with ɑ-syn pff injection as also observed in RNA-Seq results. The p-value from the t-test between PBS and ɑ-syn pff data is shown above the bar graphs. C Comparison of ɑ-syn pff-induced genes with age-associated genes in microglia. Genes that were up- or downregulated in response to ɑ-syn pff (X axis) were compared with genes up- (purple bars) or downregulated (orange bars) with age. Data shown is for young and aged mice as indicated 1or 3 months after ɑ-syn pff injection. The significance of overlap was confirmed by hypergeometric test. * p < 0.05; ** p < 0.01; *** p < 0.001
Fig. 9
Fig. 9
Schematic depiction of the potential microglial networks and pathways that interact in aging and synucleinopathies. The effects of aging processes and extracellular ɑ-syn convergence in the macrophages/microglia in the CNS probably by engaging both Toll-like receptors (TLRs) such as TLR2 and colony stimulating factor receptors (CSF-R) that in turn activate pro-inflammatory LPS-like pathways with increased production of cytokines including TNFɑ, IL6, IL10ɑ and activation of networks involving CSF2. This in turn results in a cascade of events involving further activation of microglia, astrocytes and trafficking of T cells into the CNS parenchyma that jointly produce pro-inflammatory neurotoxic factors leading to neurodegeneration

References

    1. Hou Y, Dan X, Babbar M, Wei Y, Hasselbalch SG, Croteau DL, Bohr VA. Ageing as a risk factor for neurodegenerative disease. Nat Rev Neurol. 2019;15:565–81. - PubMed
    1. Goedert M. Alpha-synuclein and neurodegenerative diseases. Nat Rev Neurosci. 2001;2:492–501. - PubMed
    1. Kotzbauer PT, Trojanowsk JQ, Lee VM. Lewy body pathology in Alzheimer’s disease. J Mol Neurosci. 2001;17:225–32. - PubMed
    1. Twohig D, Nielsen HM. α-synuclein in the pathophysiology of Alzheimer’s disease. Mol Neurodegener. 2019;14:23. - PMC - PubMed
    1. Alafuzoff I, Hartikainen P. Alpha-synucleinopathies. Handb Clin Neurol. 2017;145:339–53. - PubMed

Publication types

Substances