. 2022 Sep 5;13(1):457.
doi: 10.1186/s13287-022-03144-z.

Synovial membrane-derived mesenchymal progenitor cells from osteoarthritic joints in dogs possess lower chondrogenic-, and higher osteogenic capacity compared to normal joints

Affiliations

Synovial membrane-derived mesenchymal progenitor cells from osteoarthritic joints in dogs possess lower chondrogenic-, and higher osteogenic capacity compared to normal joints

M Teunissen et al. Stem Cell Res Ther. .

Abstract

Background: Synovial membrane-derived mesenchymal progenitor cells (SM-MPCs) are a promising candidate for the cell-based treatment of osteoarthritis (OA) considering their in vitro and in vivo capacity for cartilage repair. However, the OA environment may adversely impact their regenerative capacity. There are no studies for canine (c)SM-MPCs that compare normal to OA SM-MPCs, even though dogs are considered a relevant animal model for OA. Therefore, this study compared cSM-MPCs from normal and OA synovial membrane tissue to elucidate the effect of the OA environment on MPC numbers, indicated by CD marker profile and colony-forming unit (CFU) capacity, and the impact of the OA niche on tri-lineage differentiation.

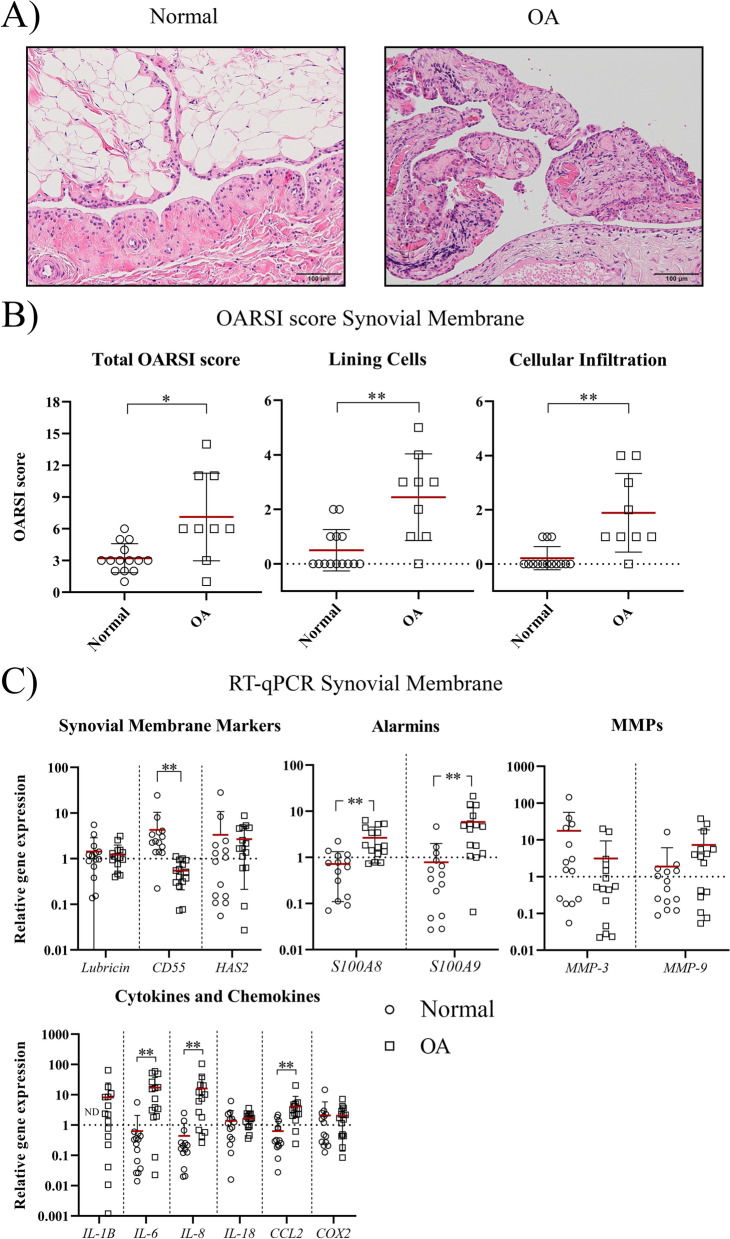
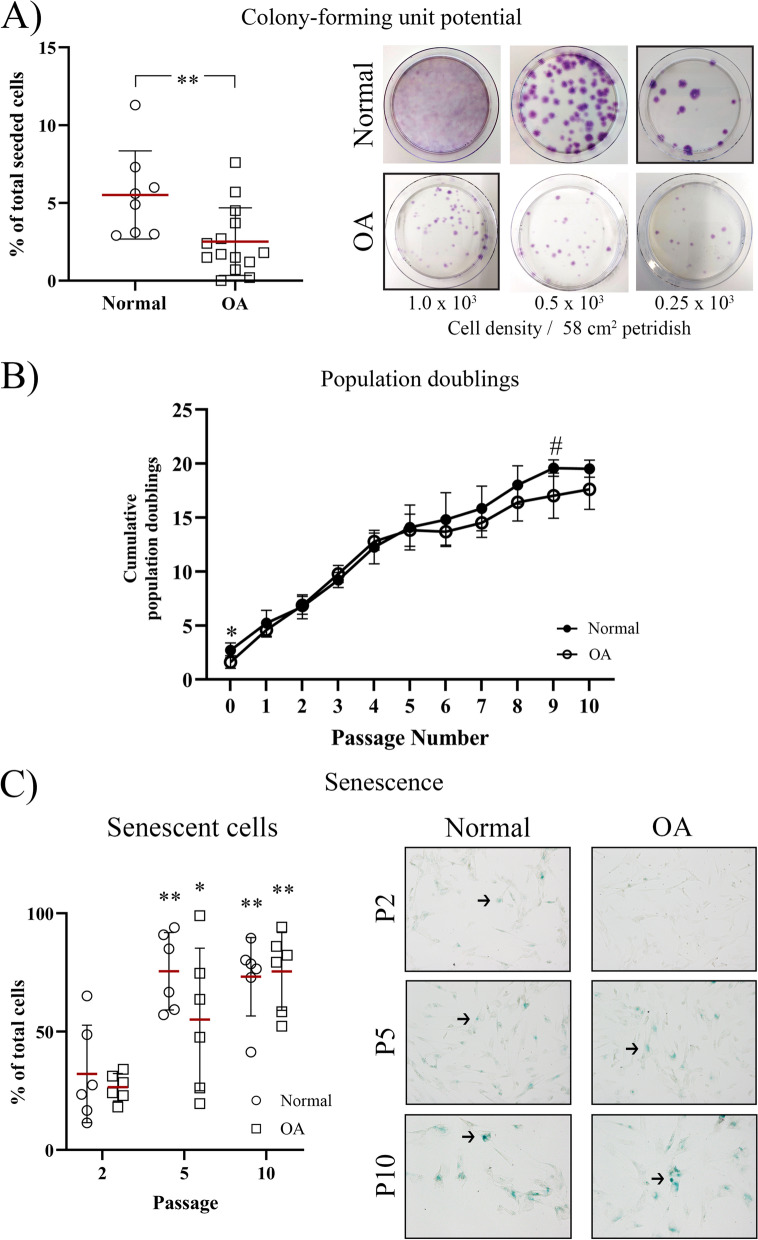
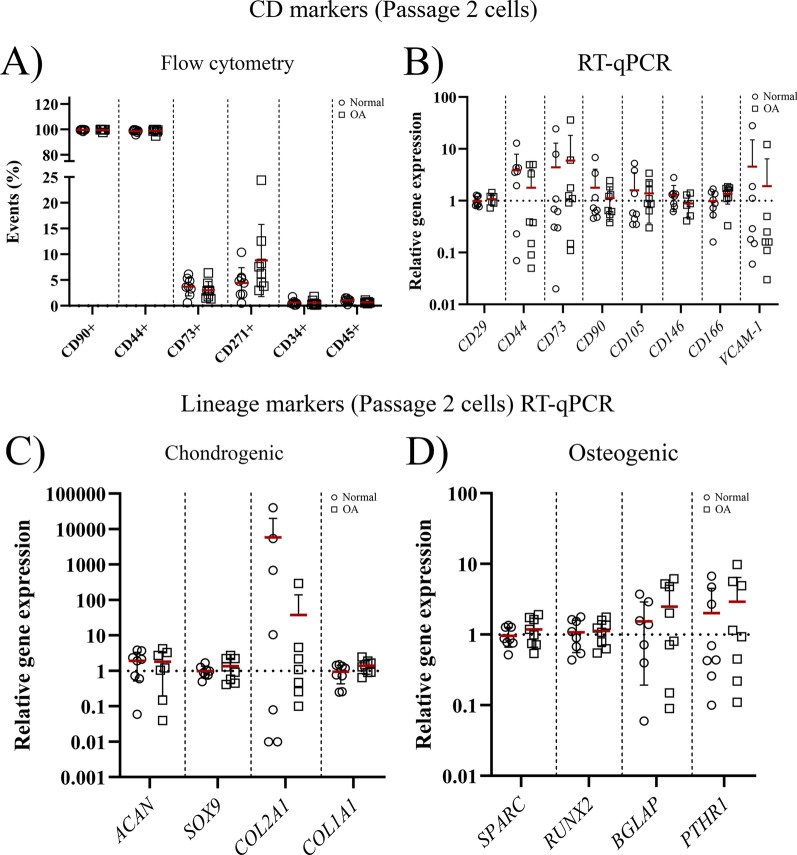
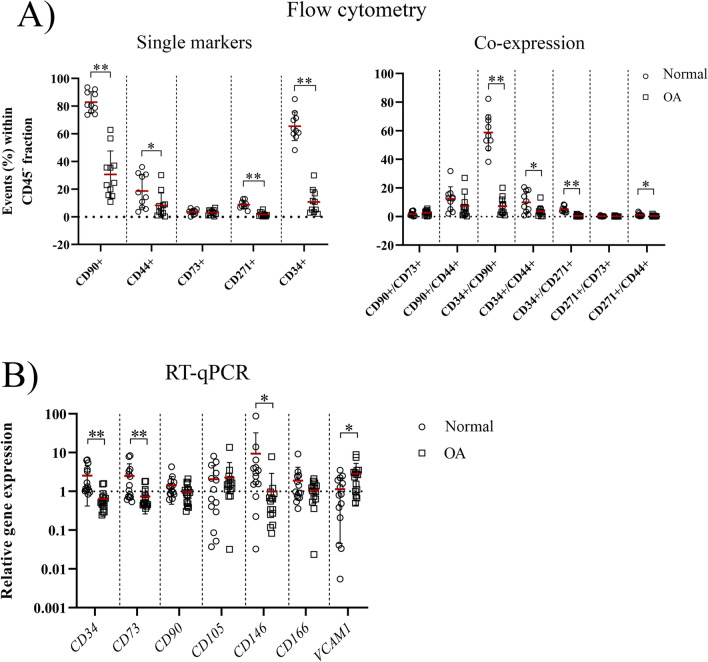
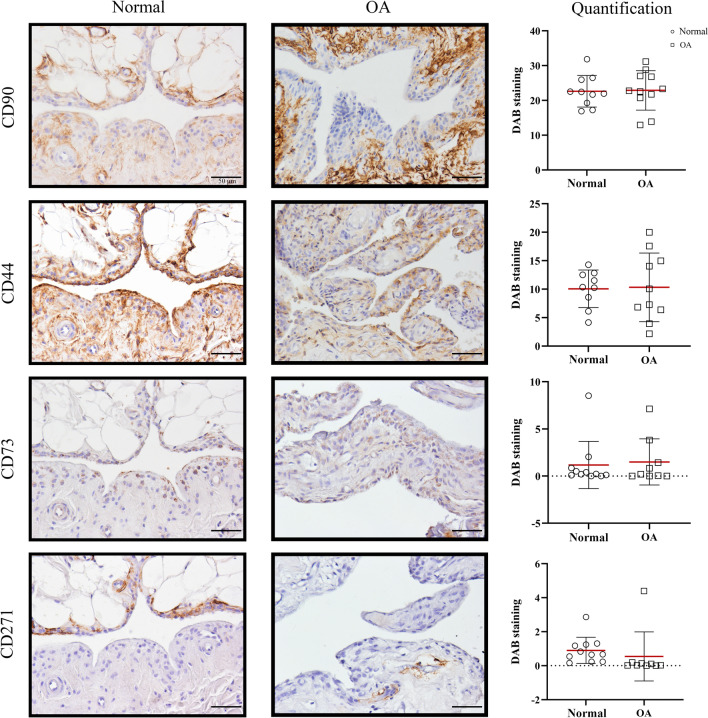
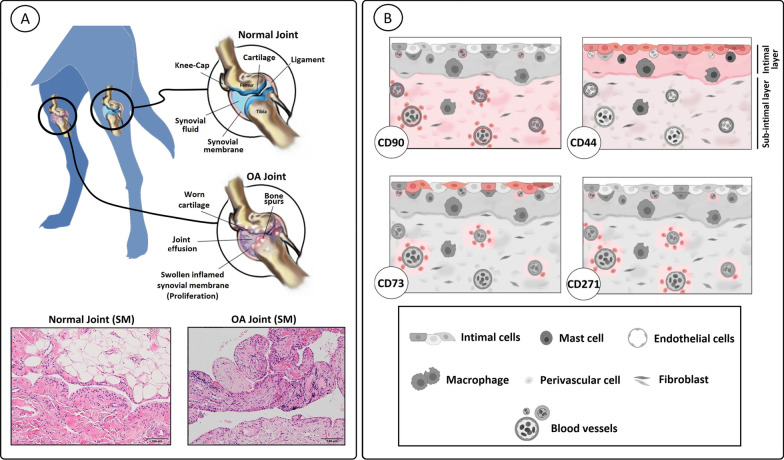
Methods: Normal and OA synovial membrane were collected from the knee joints of healthy dogs and dogs with rupture of the cruciate ligaments. The synovium was assessed by histopathological OARSI scoring and by RT-qPCR for inflammation/synovitis-related markers. The presence of cSM-MPCs in the native tissue was further characterized with flow cytometry, RT-qPCR, and immunohistochemistry, using the MPC markers; CD90, CD73, CD44, CD271, and CD34. Furthermore, cells isolated upon enzymatic digestion were characterized by CFU capacity, and a population doublings assay. cSM-MPCs were selected based on plastic adherence, expanded to passage 2, and evaluated for the expression of MPC-related surface markers and tri-lineage differentiation capacity.

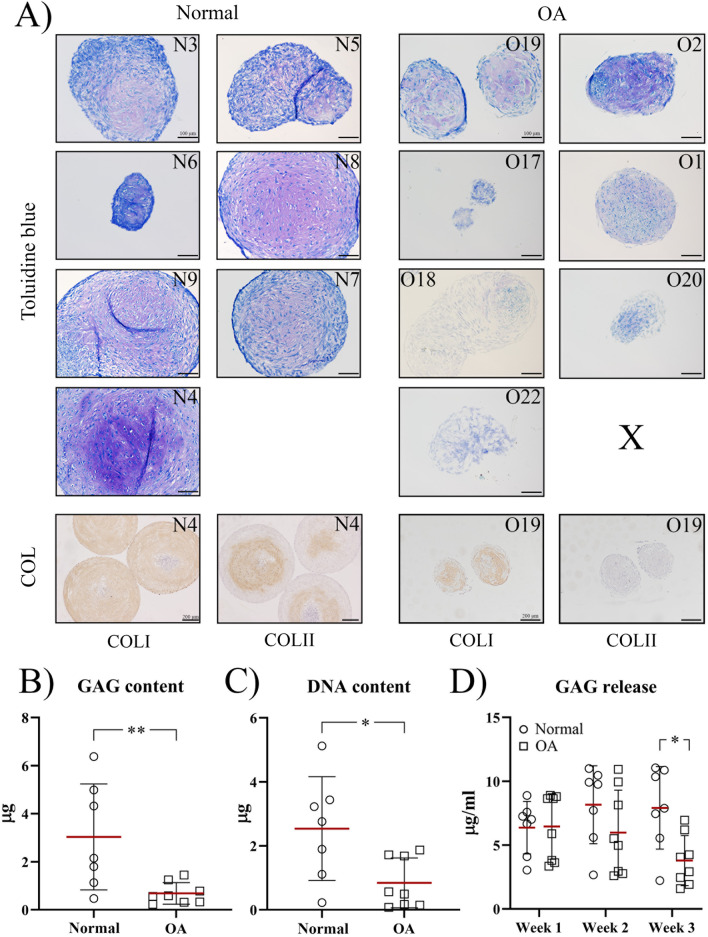
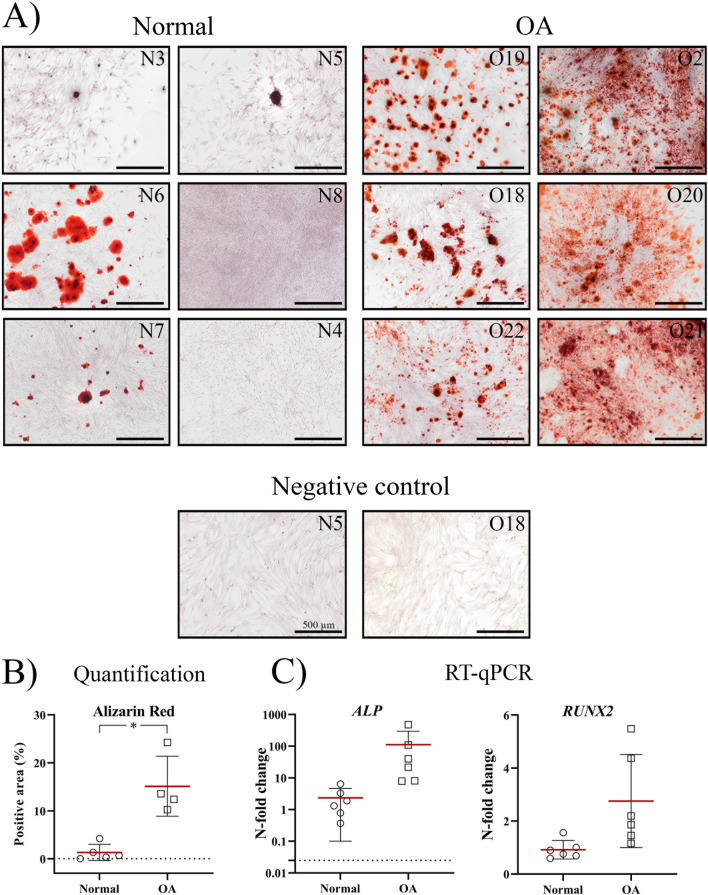
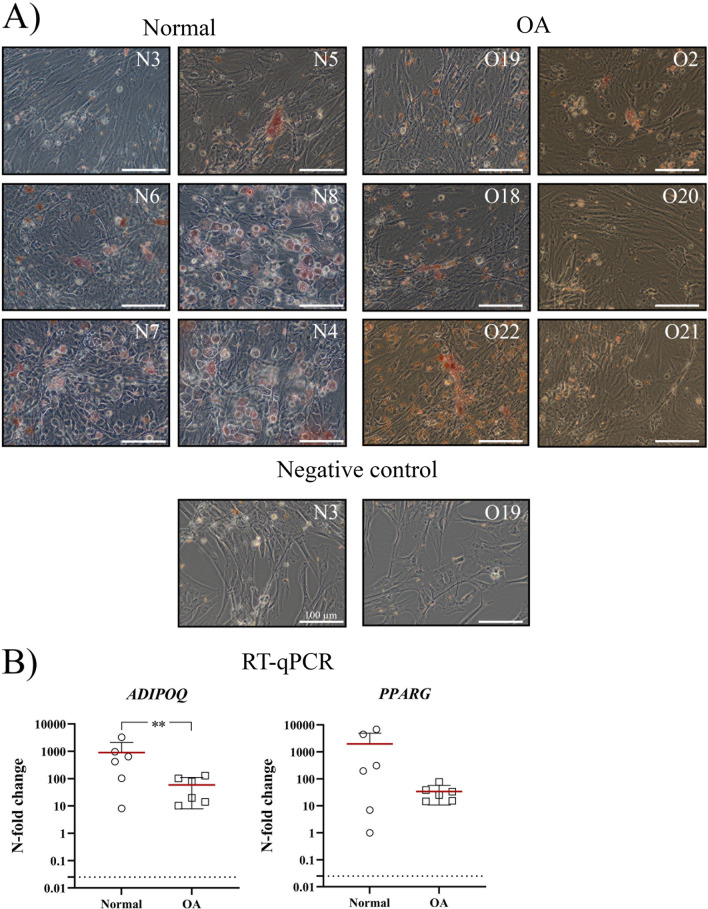
Results: Synovial tissue collected from the OA joints had a significantly higher OARSI score compared to normal joints, and significantly upregulated inflammation/synovitis markers S100A8/9, IL6, IL8, and CCL2. Both normal and OA synovial membrane contained cells displaying MPC properties, including a fibroblast-like morphology, CFU capacity, and maintained MPC marker expression over time during expansion. However, OA cSM-MPCs were unable to differentiate towards the chondrogenic lineage and had low adipogenic capacity in contrast to normal cSM-MPCs, whereas they possessed a higher osteogenic capacity. Furthermore, the OA synovial membrane contained significantly lower percentages of CD90+, CD44+, CD34+, and CD271+ cells.

Conclusions: The OA environment had adverse effects on the regenerative potential of cSM-MPCs, corroborated by decreased CFU, population doubling, and chondrogenic capacity compared to normal cSM-MPCs. OA cSM-MPCs may be a less optimal candidate for the cell-based treatment of OA than normal cSM-MPCs.

Keywords: CD271; CD34; Flow cytometry; Immunohistochemistry; Mesenchymal progenitor cells; Synovial membrane; Tri-lineage differentiation.


Conflict of interest statement

The authors declare that they have no competing interests.

Figures

Fig. 1
Fig. 1
Assessment of inflammation in the synovial membrane. A Representative images of normal and osteoarthritic (OA) synovial membrane stained with hematoxylin/eosin. The scale bar is set at 100 µM. B OARSI scoring of normal (circle) and OA (square) synovial membrane. The total OARSI score consists of the sum of the individual categories; lining cell characteristics, lining characteristics (not shown), and the evaluation of cellular infiltration. C RT-qPCR analysis of markers of the synovial membrane and synovitis. Gene expression is shown on a log scale as the relative gene expression compared to the mean of all samples within a gene. IL-1β was not detected (ND) in the normal samples. Each dot represents an individual donor. *p < 0.05; **p < 0.01
Fig. 2
Fig. 2
Cell culture characteristics. A Colony-forming unit (CFU) potential. The optimal seeding cell density was determined for normal (circle) and osteoarthritic (OA, square) donors by testing three densities. For OA donors, a cell density of 1.0*103 was chosen, and for the normal donors a cell density of 0.25*103. The amount of CFUs was displayed as the percentage of CFU of the total seeded cells. B Population doublings are displayed as the cumulative population doublings per passage for normal (black dots) and OA (clear dots). # p < 0.15 with a large effect size and *p < 0.05 in the normal compared to the OA cSM-MSCs C Senescence of the normal and OA cSM-MSCs was investigated using a β-galactosidase assay in passage (P) 2, 5, and 10. The number of senescent cells (stained blue in the microscopic images (black arrows)) was depicted as the percentage of senescent cells of the total cells. Each dot represents an individual donor. *p < 0.05; **p < 0.01 compared to the percentage of senescent cells at P2
Fig. 3
Fig. 3
Marker expression in passage 2 (P2) cultured cSM-MSCs. A Evaluation of CD markers by flow cytometry in P2 cultured normal (circle) and OA (square) cSM-MSCs. Expression is shown as the percentage (%) of positive cells (events) of all live cells for CD90, CD44, CD73, CD271, CD34, and CD45. RT-qPCR analysis of B CD marker expression, C chondrogenic lineage and D osteogenic lineage markers in P2 cultured cSM-MSCs. Gene expression of the markers is shown on a log scale as the relative gene expression compared to the mean of all samples within a gene. Each dot represents an individual donor
Fig. 4
Fig. 4
Chondrogenic differentiation of normal and osteoarthritic (OA) synovial membrane-derived cMSCs. A Evaluation of glycosaminoglycan (GAG) deposition and collagen content. 5 µm sections of pellets cultured for 21 weeks in chondrogenic differentiation medium containing 10 ng/ml TGF-β1 and 100 ng/ml BMP-2 were stained with toluidine blue (scale bar = 100 µM). A representative image of every donor is shown. One donor (X) was lost during processing. Additionally, immunohistochemical analysis of collagen (COL) content was performed for COL type I and II using DAB (3, 3'-diaminobenzidine, orange/brown staining) (scale bar = 200 µm). The donor numbers of clinically normal (N) and OA (O) donors correspond to the donor numbers and information in Additional file 1: Table S1. Biochemical evaluation of the GAG (B) and DNA (C) content in µg. Each dot represents an individual donor. *p < 0.05; **p < 0.01
Fig. 5
Fig. 5
Evaluation of osteogenic differentiation by Alizarin Red staining. A Calcium (stained in red) and the presence of noduli are representative of successful osteogenic differentiation. Representative images of every donor were obtained using the brightfield setting of an Olympus IX51 inverted microscope. The negative controls received expansion medium for 21 days. The scale bar is set at 500 µm. The donor numbers of clinically normal (N) and OA (O) donors correspond to the donor numbers and information in Additional file 1: Table S1. B The percentage (%) of Alizarin Red positive area was measured using Image J (Fiji) software in at least 3 image per donor per condition. C Gene expression of the osteogenic markers alkaline phosphatase (ALP) and RUNX2 is shown as the N-fold change of the cells treated with osteogenic differentiation medium compared to their own negative control. Each dot represents an individual donor
Fig. 6
Fig. 6
Evaluation of adipogenic differentiation by Oil Red O staining. Lipid droplets (stained in red) and the more rounded cell morphology are representative of successful adipogenic differentiation. Representative images of every donor were obtained using the phase contrast setting of an Olympus IX51 inverted microscope. The negative controls received expansion medium for 21 days. The scale bar is set at 100 µm. The donor numbers of clinically normal (N) and OA (O) donors correspond to the donor numbers and information in Additional file 1: Table S1. B Gene expression of the osteogenic markers adiponectin (ADIPOQ) and peroxisome proliferator-activated receptor gamma (PPARG) is shown as the N-fold change of the cells treated with osteogenic differentiation medium compared to their own negative control. Each dot represents an individual donor. *p < 0.05
Fig. 7
Fig. 7
Quantitative evaluation of CD marker expression in the synovial membrane. A Evaluation of CD markers by flow cytometry. Expression is shown as the percentage of positive cells (events) within the CD45 negative cell population for each single marker and for the co-expression of markers for normal (circle) and osteoarthritic (OA, square) synovial membrane. B RT-qPCR analysis of CD marker expression in the synovial membrane. Gene expression of the CD markers is shown on a log scale as the relative gene expression compared to the mean of all samples within a gene. Each dot represents an individual donor. *p < 0.05; **p < 0.01
Fig. 8
Fig. 8
Evaluation of the CD marker location in the synovial membrane. Immunohistochemical analysis using DAB (3, 3'-diaminobenzidine, orange/brown staining) was performed to identify the location of CD90, CD44, CD73, CD271, and CD34 expression in the normal (circle) and osteoarthritic (OA, square) synovial membrane. Representative images, containing both fibrous and adipose type synovial membrane, were chosen. The scale bar is set at 50 µm. Quantification of the DAB staining was performed with Image ProPlus 6.0 software (Media Cybernetics) in 3 to 6 random regions of interest (ROI) per donor, resulting in a mean percentage of DAB positive staining areas for each donor
Fig. 9
Fig. 9
Graphical overview of the CD marker expression in the synovial membrane. A Synovial membrane (SM) was collected from normal and OA knee joints B Immunohistochemical staining was performed for CD90, CD44, CD73, and CD271. Tissue expression of these markers is visualized in red. Immunopositivity of CD90 was observed mainly in the subintimal and perivascular layer. CD44 was mainly expressed in the intimal lining cells, although variable expression was observed in the subintimal layer and perivascular. CD73 positive cells were mostly observed in the intimal lining and perivascular layer. CD271 was expressed perivascular and in the normal SM also in the intimal layer of the adipose parts of the synovial membrane

Similar articles

Cited by

References

    1. Sacchetti B, Funari A, Remoli C, Giannicola G, Kogler G, Liedtke S, et al. No identical “Mesenchymal Stem Cells” at different times and sites: human committed progenitors of distinct origin and differentiation potential are incorporated as adventitial cells in microvessels. Stem Cell Rep. 2016;6:897–913. doi: 10.1016/J.STEMCR.2016.05.011. - DOI - PMC - PubMed
    1. de Bari C, Dell’Accio F, Tylzanowski P, Luyten FP. Multipotent mesenchymal stem cells from adult human synovial membrane. Arthritis Rheum. 2001;44:1928–1942. doi: 10.1002/1529-0131(200108)44:8<1928::AID-ART331>3.0.CO;2-P. - DOI - PubMed
    1. Kurth TB, Dell’Accio F, Crouch V, Augello A, Sharpe PT, de Bari C. Functional mesenchymal stem cell niches in adult mouse knee joint synovium in vivo. Arthritis Rheum. 2011;63:1289–1300. doi: 10.1002/art.30234. - DOI - PubMed
    1. Roelofs AJ, Zupan J, Riemen AHK, Kania K, Ansboro S, White N, et al. Joint morphogenetic cells in the adult mammalian synovium. Nat Commun. 2017;8:1–14. doi: 10.1038/ncomms15040. - DOI - PMC - PubMed
    1. de Bari C, Roelofs AJ. Stem cell-based therapeutic strategies for cartilage defects and osteoarthritis. Curr Opin Pharmacol. 2018;40:74–80. doi: 10.1016/J.COPH.2018.03.009. - DOI - PubMed

Publication types