Clinical Trial
. 2022 Sep;28(9):1813-1822.
doi: 10.1038/s41591-022-01956-3. Epub 2022 Sep 5.

Transplantation of human neural progenitor cells secreting GDNF into the spinal cord of patients with ALS: a phase 1/2a trial

Affiliations
Clinical Trial

Transplantation of human neural progenitor cells secreting GDNF into the spinal cord of patients with ALS: a phase 1/2a trial

Robert H Baloh et al. Nat Med. 2022 Sep.

Abstract

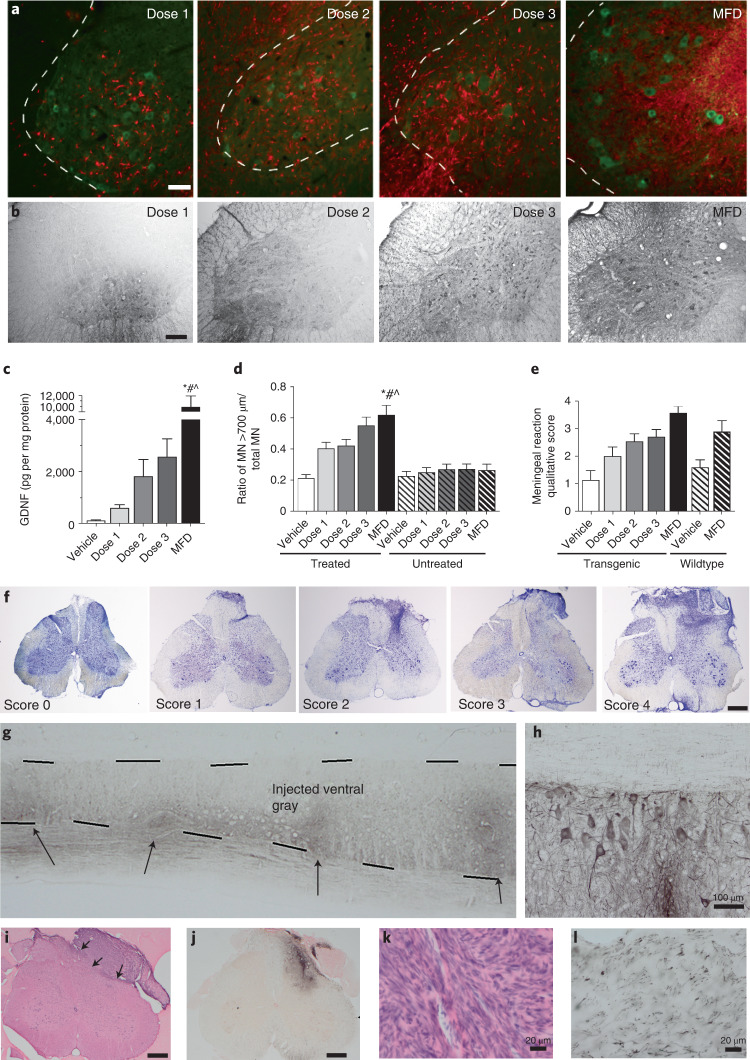
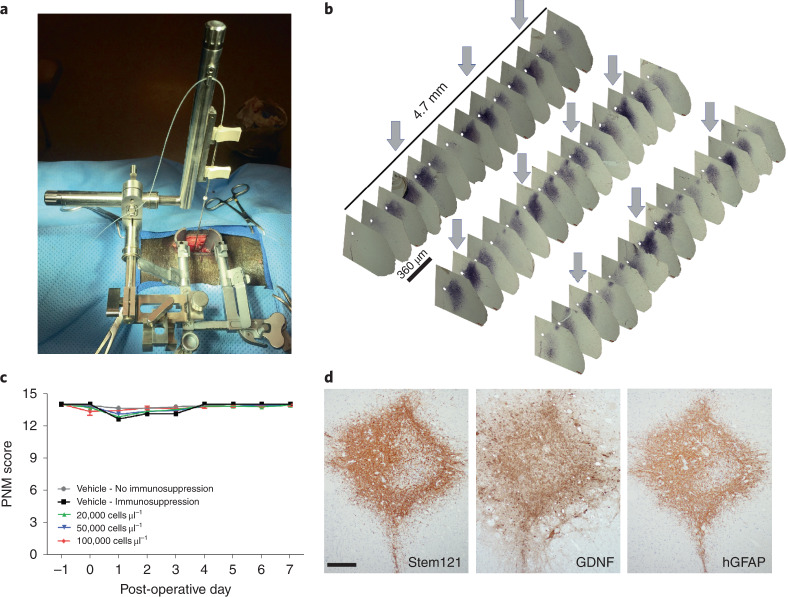
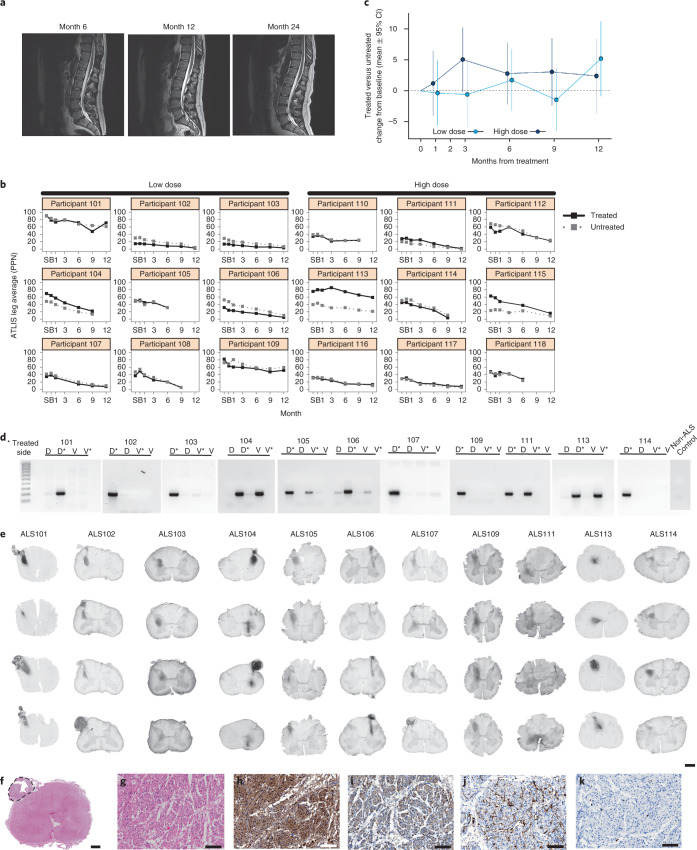
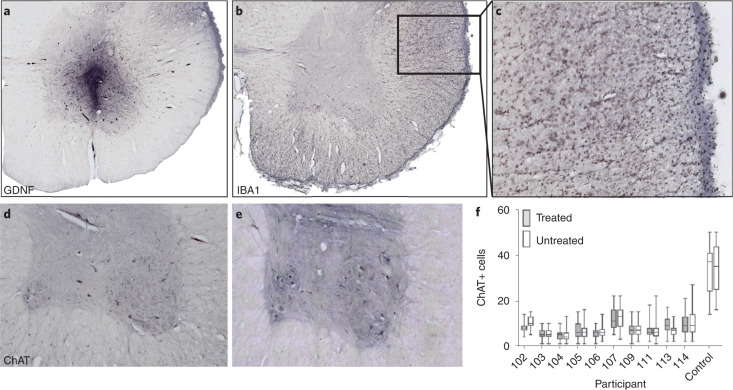
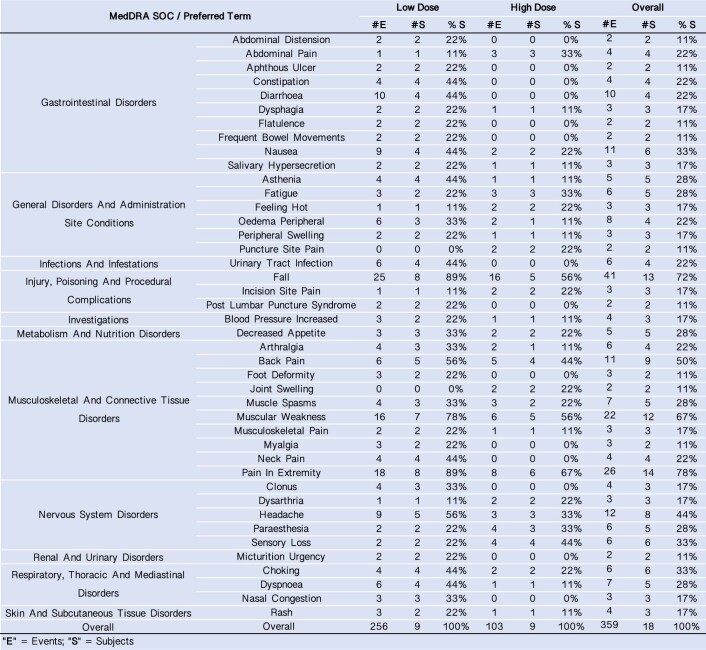
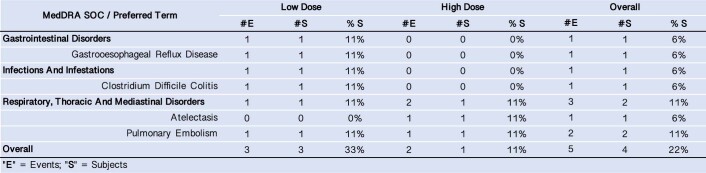
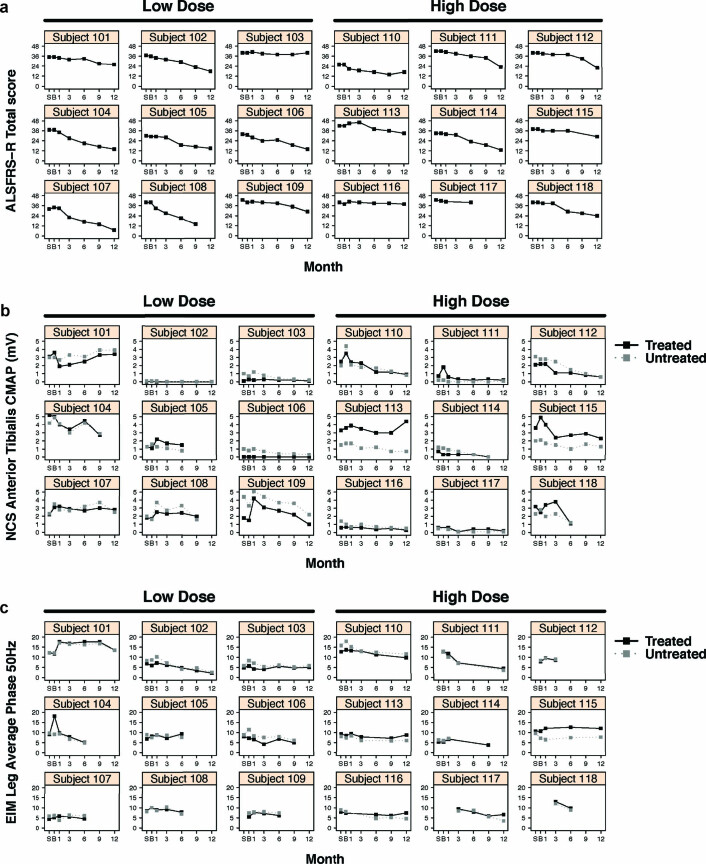
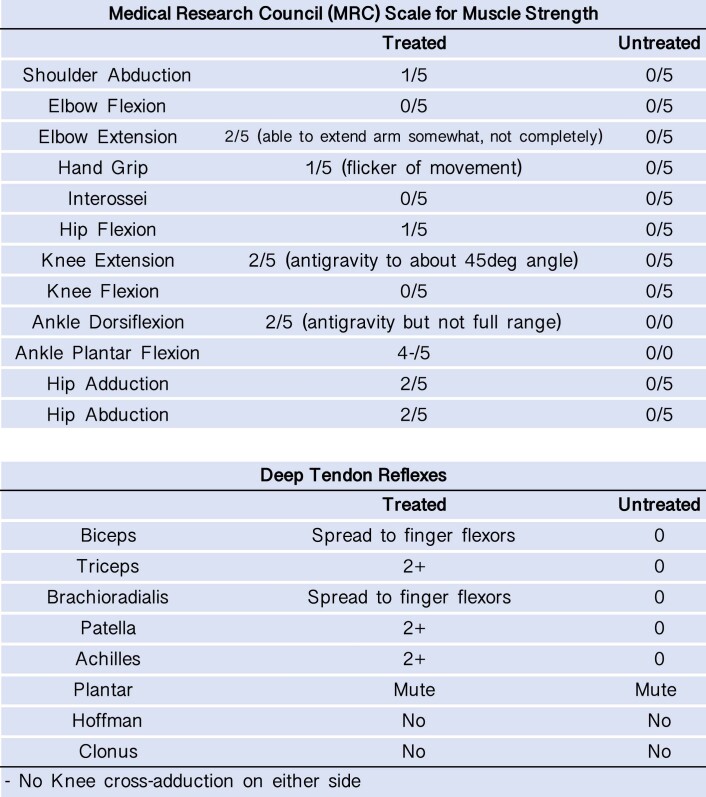
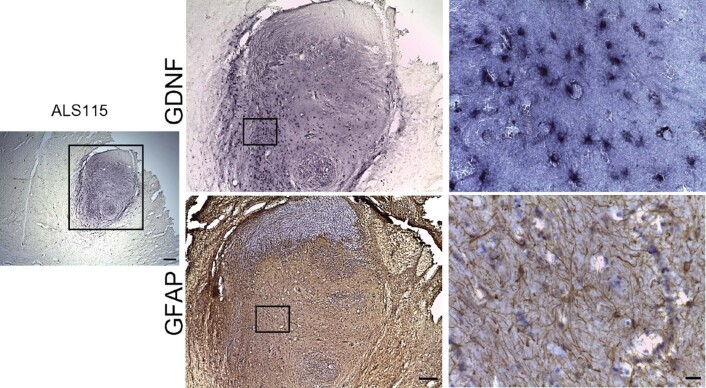
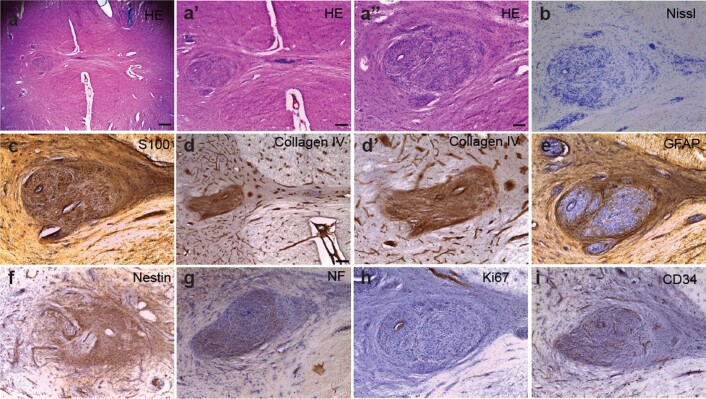
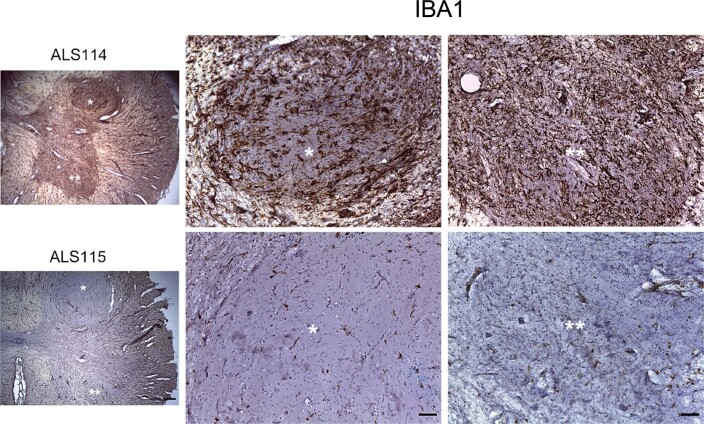
Amyotrophic lateral sclerosis (ALS) involves progressive motor neuron loss, leading to paralysis and death typically within 3-5 years of diagnosis. Dysfunctional astrocytes may contribute to disease and glial cell line-derived neurotrophic factor (GDNF) can be protective. Here we show that human neural progenitor cells transduced with GDNF (CNS10-NPC-GDNF) differentiated to astrocytes protected spinal motor neurons and were safe in animal models. CNS10-NPC-GDNF were transplanted unilaterally into the lumbar spinal cord of 18 ALS participants in a phase 1/2a study (NCT02943850). The primary endpoint of safety at 1 year was met, with no negative effect of the transplant on motor function in the treated leg compared with the untreated leg. Tissue analysis of 13 participants who died of disease progression showed graft survival and GDNF production. Benign neuromas near delivery sites were common incidental findings at post-mortem. This study shows that one administration of engineered neural progenitors can provide new support cells and GDNF delivery to the ALS patient spinal cord for up to 42 months post-transplantation.


Conflict of interest statement

Cedars-Sinai owns the patent application related to the frame and cannula tested in this study. Pablo Avalos and Doniel Drazin are named on the patent application.

Figures

Fig. 1
Fig. 1. Cell product survives and protects motor neurons and is safe in the spinal cord.
a, Immunohistochemistry with human-specific nuclear marker SC121 (red) demonstrated dose–response engraftment of CNS10-NPC-GDNF, around host spinal cord ChAT-positive motor neurons (green). b,c, Human-specific GDNF antibody revealed a large region of staining post-transplantation of all cell doses (b), with quantification showing a clear dose-dependence at disease onset (c). d, Dose-dependent increase in motor neuron (MN) survival. e, A meningeal reaction occurred at disease onset in SOD1 and wild-type rats receiving all cell doses and vehicle, and was qualitatively larger at higher doses. f, Nissl stain of meningeal reaction at the surgical site in the region of the dorsal root entry, with qualitative score (0–4). Sample size n = 15 biologically independent animals for each dose and n = 10 for vehicle. g,h, Immunohistochemistry with human-specific GDNF antibody showed immunodeficient rats had GDNF production at multiple transplant sites for up to 180 d (g), with GDNF uptake by host motor neurons (h). i, H&E stain showed a meningeal reaction associated with the DREZ near the cannula insertion site. jl, Immunohistochemistry showed that these structures occasionally had (j) the cellular product within them based on a human-specific marker for nestin, (k) were positive for Schwann-like cells based on S100b and (l) contained numerous small-diameter axons based on a neurofilament heavy stain. Sample size n = 12 and n = 40 biologically independent animals for 30- and 180-d timepoints, respectively. Scale bars, 75 µm (a); 500 µm (b,f,i,j); 100 µm (h); 20 µm (k,l). A general linear regression model was used for ELISA (c) and was Tukey-adjusted for multiple comparisons. *MFD versus vehicle and MFD versus dose 1, P < 0.0001; #MFD versus dose 2, P = 0.0027; ^MFD versus dose 3 P = 0.0009. A mixed-model regression with compound symmetry covariance structure was used for the motor neuron counts (d) and Tukey-adjusted for multiple comparisons. *MFD versus vehicle and MFD versus untreated conditions, P < 0.0001; #MFD versus dose 1 P = 0.01387; ^MFD versus dose 2, P = 0.02299. Differences were considered significant at the two-sided level of P < 0.05. Error bars, ±s.e.m.
Fig. 2
Fig. 2. Cell product survives in large animal spinal cord.
a, Newly developed stereotaxic frame mounted on the Medtronic MAST Quadrant minimally invasive retractor system. b, Immunohistochemistry with human-specific GDNF antibody showed robust and widespread GDNF production along the lumbar spinal cord, with arrows highlighting the 2-mm injection intervals. c, A GLP study showed that only a few animals exhibited lower PNM scores during the first 3 d post-surgery, with all animals presenting PNM scores of at least 13 from day 4 until designated termination. Sample size n = 52 biologically independent animals. d, Immunohistochemistry with human-specific antibodies demonstrated cell survival (Stem121), GDNF production and differentiation into GFAP-positive astrocytes. Scale bar, 200 µm.
Fig. 3
Fig. 3. Clinical trial meets safety endpoint and shows cell product survival and GDNF production.
a, MRI scans were normal throughout the study for all participants, apart from one with mild increased T2 hyperintensity in the area of the graft, that resolved after surgery. b, Measuring the decline in strength for the quadriceps (knee extension) over time for all participants from both dose cohorts showed that both legs became weaker, at varying rates. c, Although not statistically significant, the largest relative difference in the treated leg compared with the untreated leg in the low-dose cohort occurred at 12 months. The high-dose cohort showed a consistently slower rate of decline in the treated leg at all time points. d, Cell survival was shown in all participants by nested PCR, performed on four quadrants of the spinal cord for dorsal (D) and ventral (V) on both the treated (asterisk) and untreated sides. e, Immunohistochemistry revealed GDNF production in all participants. f,g, H&E staining demonstrated an (f) exophytic mass composed of (g) spindle cells arranged in a haphazard and intersecting fascicular growth pattern. h, Immunohistochemistry showed that the spindle cells were positive for S100, consistent with a Schwann cell origin. i, Neurofilament staining showed numerous punctae and irregularly shaped structures consistent with disorganized and regenerative axons mixed with the Schwann cells. j,k, CD34 staining showed (j) normal-appearing blood vessels within the mass and (k) cells were only infrequently Ki67-positive. Scale bar, 1 mm (e, f); 100 µm (gk). Source data
Fig. 4
Fig. 4. Motor neurons were similar between treated and untreated sides.
a,b, Immunohistochemistry showed graft survival with a high level of GDNF (a), yet very low levels of IBA1 staining (b). c, Descending motor neuron tracts showed an inflammatory response with hypertrophic microglia and IBA1 staining. d,e, Immunohistochemistry showed that ChAT-positive motor neurons were (d) lost in the ALS lumbar spinal cord and (e) preserved in the control spinal cord. f, The treated and untreated spinal cord sides showed similar numbers of ChAT-positive motor neurons across participants; motor neurons were significantly lower in participant 102 (p = 0.0001) and significantly higher (p = 0.0013) in 113 on the treated compared to untreated side. Box plots depict median and 25th to 75th percentiles, with min and max whiskers. Sample size n = 47 (on average) independent participant spinal cord sections, n = 25 independent control spinal cord sections. Magnification, ×2.5 (a,b); ×20 (c); ×5 (d,e).
Extended Data Fig. 1
Extended Data Fig. 1. Cell product survival and safety in rodent spinal cord.
Cell product survival and safety in rodent spinal cord. Kaplan-Meier curves show no significant differences in (a) disease onset or (b) lifespan between SOD1 cohorts receiving vehicle or CNS10-NPC-GDNF at Dose 1, Dose 2, Dose 3, or maximal feasible dose (MFD). The BBB score showed (c) no difference on functional decline for ipsilateral (treated) hindlimbs over time prior to and following intraspinal injection of vehicle or increasing doses of CNS10-NPC-GDNF and (d) no difference on functional decline for ipsilateral and contralateral (untreated) hindlimbs. All groups showed dip at 7-days post-transplantation, considered an artifact of surgical procedure. No cell dose had an effect on ipsilateral (treated) hindlimb pain in SOD1 rats, or MFD in wildtype rats, as demonstrated by the (e, f) Flinch Jump, (g) Randall-Sellito and (h) Von Frey tests. (i) Immunohistochemistry with human-specific cytoplasmic marker SC121 (red) demonstrated engraftment of CNS10-NPC-GDNF around ChAT-positive motor neurons (green). A human-specific GDNF antibody revealed a large region of staining (j) on the transplant side at disease endpoint, but (k) not on the contralateral side with MFD at disease onset or endpoint. (l) Meningeal reaction occurred in SOD1 and wildtype rats at disease endpoint, receiving all cell doses and receiving vehicle. Sample size n = 15 biologically independent animals for each dose and n = 10 for vehicle. Error bars ± s.e.m. Scale bars: (i) 5 µm; (j, k) 500 µm.
Extended Data Fig. 2
Extended Data Fig. 2. Cell product differentiation into astrocytes.
Cell product differentiation into astrocytes. Representative image and quantification of double immunofluorescence for (a, b) CNS10-NPC-GDNF labeled with Stem101 (nuclear specific, green) and human nestin, a neural progenitor marker, and with (c, d) GFAP, an astrocyte marker (red). (e) Double immunofluorescence shows that many cells are positive for human nestin and GFAP. (f) Confocal microscopy images show that CNS10-NPC-GDNF labeled with Stem 121 (cytoplasmic specific, red) co-localized with mature astrocyte markers aquaporin 4 (AQP4) and Glast (green). Nuclei counterstained with DAPI (blue). White arrows indicate CNS10-NPC-GDNF co-expressing the markers. Sample size n = 15 biologically independent animals for each dose and n = 10 for vehicle. Error bars ± s.e.m. Scale bars: (a, c) 10 µm; (e) = 75 µm; (f low mag) 10 µm; (f high mag) 5 µm.
Extended Data Fig. 3
Extended Data Fig. 3. Adverse events.
Adverse events reported by at least 20% of participants. #e = number of events; #s = number of participants.
Extended Data Fig. 4
Extended Data Fig. 4. Serious adverse events.
No serious adverse events during the trial were attributed to the product.
Extended Data Fig. 5
Extended Data Fig. 5. Additional measures collected for all participants.
Additional measures collected over the course of the study for all participants included (a) ALSFRS-R score, (b) compound motor action potential (CMAP) of the tibialis anterior and (c) electrical impedance myography (EIM).
Extended Data Fig. 6
Extended Data Fig. 6. Additional tests collected for Participant 113 at 3 years post-transplantation.
Muscle strength, based on Medical Research Council (MRC) scale, and deep tendon reflexes were collected as additional tests only for Participant 113, after trial completion at 3 years post-transplantation, as ATLIS was not available at this timepoint.
Extended Data Fig. 7
Extended Data Fig. 7. Astrocytes and GDNF within the transplants.
Immunohistochemistry shows GFAP-positive astrocytes and GDNF-positive cells within solid oval transplants. Scale bars: Panels left 400 μm; middle 200 μm; right 20 μm.
Extended Data Fig. 8
Extended Data Fig. 8. Neuromas within the Virchow-Robin space.
In some cases, neuromas extended down into the Virchow-Robin space of the dorsal and ventral horns of the spinal cord, shown with (aa”) H&E and (b) Nissl. Structures stained positive for (c) S100 and (d) Collagen IV, and (e) negative for GFAP. Structures stained positive for (f) nestin and (g) neurofilament (NF). (h) There was no observed staining for Ki67. (i) CD34 demonstrated normal appearing blood vessels within the structures. Scale bars: (a) 400 μm; (a’, d) 200 μm; (a”) 100 μm; (b, c, d’, e-i) are all the same 100 μm scale bar size shown in a”.
Extended Data Fig. 9
Extended Data Fig. 9. IBA1 staining in Participant 114.
Immunohistochemistry shows IBA1 staining in Participant 114, which is not observed in other participants, with a representative image from participant 115. Scale bars: Panels left 400 μm; middle and right 100 μm.

Comment in

Similar articles

Cited by

References

    1. Jaiswal MK. Riluzole and edaravone: a tale of two amyotrophic lateral sclerosis drugs. Med. Res. Rev. 2019;39:733–748. - PubMed
    1. Harms MB, Baloh RH. Clinical neurogenetics: amyotrophic lateral sclerosis. Neurol. Clin. 2013;31:929–950. - PMC - PubMed
    1. Mueller C, et al. SOD1 suppression with adeno-associated virus and microRNA in familial ALS. N. Engl. J. Med. 2020;383:151–158. - PMC - PubMed
    1. Miller T, et al. Phase 1–2 trial of antisense oligonucleotide tofersen for SOD1 ALS. N. Engl. J. Med. 2020;383:109–119. - PubMed
    1. Du Z-W, et al. Generation and expansion of highly pure motor neuron progenitors from human pluripotent stem cells. Nat. Commun. 2015;6:6626. - PMC - PubMed

Publication types

Substances

Associated data