. 2022 Sep 5;13(1):5208.
doi: 10.1038/s41467-022-32871-3.

Adipocyte-derived lactate is a signalling metabolite that potentiates adipose macrophage inflammation via targeting PHD2

Affiliations

Adipocyte-derived lactate is a signalling metabolite that potentiates adipose macrophage inflammation via targeting PHD2

Tianshi Feng et al. Nat Commun. .

Abstract

Adipose tissue macrophage (ATM) inflammation is involved with meta-inflammation and pathology of metabolic complications. Here we report that in adipocytes, elevated lactate production, previously regarded as the waste product of glycolysis, serves as a danger signal to promote ATM polarization to an inflammatory state in the context of obesity. Adipocyte-selective deletion of lactate dehydrogenase A (Ldha), the enzyme converting pyruvate to lactate, protects mice from obesity-associated glucose intolerance and insulin resistance, accompanied by a lower percentage of inflammatory ATM and reduced production of pro-inflammatory cytokines such as interleukin 1β (IL-1β). Mechanistically, lactate, at its physiological concentration, fosters the activation of inflammatory macrophages by directly binding to the catalytic domain of prolyl hydroxylase domain-containing 2 (PHD2) in a competitive manner with α-ketoglutarate and stabilizes hypoxia inducible factor (HIF-1α). Lactate-induced IL-1β was abolished in PHD2-deficient macrophages. Human adipose lactate level is positively linked with local inflammatory features and insulin resistance index independent of the body mass index (BMI). Our study shows a critical function of adipocyte-derived lactate in promoting the pro-inflammatory microenvironment in adipose and identifies PHD2 as a direct sensor of lactate, which functions to connect chronic inflammation and energy metabolism.


Conflict of interest statement

The Authors declare no competing interests.

Figures

Fig. 1
Fig. 1. Lactate production in adipocyte is increased in diet-induced obesity.
a Gene expression changes in glucose metabolic pathways (KEGG ID mmu00010 and mmu00020) in epididymal white adipose tissue (eWAT) of C57BL/6 mice fed with low or high fat diet for 3 months. Original data were obtained from GSE91067 (GSM2420432 - GSM2420439). Genes significantly up- or downregulated in obese eWAT were highlighted in pink (Up) and blue (Down). Width of the edge is proportional to the fold change of the gene. bh 8-week-old male C57BL/6J mice were fed with standard chow (STC) or high fat diet (HFD) for 3 months. bc Lactate levels in b different tissues (n = 4 biologically independent animals) and in c serum (STC: n = 4; HFD: n = 5 biologically independent animals) of mice. d Western blotting of LDHA in mouse eWAT. e Densitometry quantification of LDHA level by Western blotting. n = 3 biologically independent samples. f LDH activity in mouse eWAT. n = 4 biologically independent animals. g The amount of lactate in mature adipocytes and stromal vascular fraction (SVF) isolated from the whole eWAT fat pad. n = 5 biologically independent animals. h Lactate level in eWAT of wildtype (WT), adipocyte (AKO) and myeloid cell-specific Ldha knockout (MKO) mice. STC-WT: n = 4; STC-AKO: n = 5; STC-MKO: n = 5; HFD-WT: n = 8; HFD-AKO: n = 7; HFD-MKO: n = 5 biologically independent animals. Data represent mean ± SEM; Significance was calculated by two-way ANOVA with post hoc Bonferroni correction (b, g, h) or two-tailed student’s t test (c, e, f).
Fig. 2
Fig. 2. Adipocyte-specific deletion of Ldha protects against glucose intolerance and insulin resistance in obese mice.
Wildtype (WT) and adipocyte-specific Ldha knockout (AKO) mice were fed with standard chow (STC) or high fat diet (HFD) for 4 months. a Body weight of the mice. WT-STC: n = 6; WT-HFD: n = 5; AKO-STC: n = 7; AKO-HFD: n = 9 biologically independent animals. b Body composition of the mice at the end of the treatment. STC-WT: n = 6; STC-AKO: n = 5; HFD-WT: n = 7; HFD-AKO: n = 5 biologically independent animals. c Glucose tolerance test (GTT) and d Area under the curve (AUC) of the GTT. STC-WT: n = 7; STC-AKO: n = 4; HFD-WT: n = 12; HFD-AKO: n = 8 biologically independent animals. e Fasting serum insulin level. STC-WT: n = 8; STC-AKO: n = 5; HFD-WT: n = 10; HFD-AKO: n = 8 biologically independent animals. f, g Insulin tolerance test (ITT). WT-STC: n = 7; WT-AKO: n = 4; WT-HFD: n = 7; AKO-HFD: n = 4 biologically independent animals. h HOMA-IR and i HOMA-β of the mice. WT-STC: n = 7; WT-AKO: n = 4; WT-HFD: n = 7; AKO-HFD: n = 4 biologically independent animals. Data represent mean ± SEM; Significance was calculated by two-way ANOVA with post hoc Bonferroni correction (c-i).
Fig. 3
Fig. 3. Obesity-induced adipose inflammation is attenuated by lactate depletion in adipocytes.
Wildtype (WT) and adipocyte-specific Ldha knockout (AKO) mice were fed with standard chow (STC) or high fat diet (HFD) for 4 months before epididymal white adipose tissue (eWAT) was isolated for analysis. a HE staining of eWAT; scale bar, 100 μm. b Immunofluorescence staining of iNOS and F4/80 in eWAT; scale bar, 100 μm. cf SVF in eWAT was subjected to flowcytometry analysis for macrophage subtypes. STC-WT: n = 5 (cf); STC-AKO: n = 4 (c–f); HFD-WT: n = 12 (d) or n = 11(e) or n = 10 (f); HFD-AKO: n = 7 (cf) biologically independent animals. gj mRNA expression of g Il-1β (STC-WT: n = 5; STC-AKO: n = 4; HFD-WT: n = 6; HFD-AKO: n = 6 biologically independent animals), h Cd11c (STC-WT: n = 4; STC-AKO: n = 4; HFD-WT: n = 7; HFD-AKO: n = 6 biologically independent animals), i Tnf (STC-WT: n = 4; STC-AKO: n = 4; HFD-WT: n = 9; HFD-AKO: n = 6 biologically independent animals) and j Ccl12 (STC-WT: n = 4; STC-AKO: n = 4; HFD-WT: n = 8; HFD-AKO: n = 7 biologically independent samples) in eWAT. kl Serum levels of k IL-1β and l MCP1. n = 4 biologically independent animals. Data represent mean ± SEM; Significance was calculated by two-way ANOVA with post hoc Bonferroni correction (d-i).
Fig. 4
Fig. 4. Lactate potentiates IL-1β expression in mouse and human inflammatory macrophage.
ad Conditioned medium (CM) of epididymal white adipose tissue (eWAT) was collected from wildtype (WT) and adipocyte-specific Ldha knockout (AKO) mice. Bone marrow derived macrophages (BMDM) were cocultured in CM for 24 hr. a Illustration of the co-culture experiment. b, c BMDM mRNA expression of b Il-1β, n = 4 biologically independent animals, and c Tnf, STC-WT: n = 4; STC-AKO: n = 3; HFD-WT: n = 3; HFD-AKO: n = 4 biologically independent animals. d Il-1β mRNA in BMDMs cocultured in CM from WT and AKO eWAT. One group of BMDM was cocultured in CM from obese eWAT with AZD3965 (100 nM). n = 4 biologically independent samples. ei Unelicited or inflammatory BMDMs were treated with 20 mM lactate or 20 mM NaCl as control in vitro. ef Lactate content in cell lysate was measured after BMDM was cultured with medium containing 20 mM C3-13C lactate for 24 hr. e Lactate containing zero, 1, 2 and 3 13Carbons (m + 0, m + 1, m + 2, m + 3) in cell lysate. n = 3 biologically independent samples. f Relative enrichment of endogenous and m + 1 13C lactate in cell lysate. g, h mRNA level of g Il-1β and h Tnf. n = 4 biologically independent samples. i Concentration of IL-1β in BMDM medium. n = 4 biologically independent samples. j mRNA level of iNOS. n = 4 biologically independent samples. k Western blotting of iNOS. ln Human CD14+ monocytes were differentiated to macrophages and treated with 20 mM lactate or 20 mM NaCl as control. mRNA levels of l IL-1β and m TNF were examined by real time PCR. n = 4 biologically independent samples. n IL-1β concentration in medium. n = 5 biologically independent samples. Data represent mean ± SEM; Significance was calculated by two-way ANOVA with post hoc Bonferroni correction (bd, gj, ln).
Fig. 5
Fig. 5. HIF-1α protein level is increased by lactate in pro-inflammatory macrophages.
ah Mouse BMDMs were treated with lactate (20 mM) or NaCl (20 mM) and AZD3965 (100 nM). a Western blotting of HIF-1α in macrophages. b Densitometry quantification of HIF-1α level by Western blotting. c HIF-1α activity in macrophages. M0: n = 5; M1: n = 5; M1 + Lac: n = 5; M1 + Lac + MCTi: n = 4 biologically independent samples. df mRNA expressions of HIF-1α downstream genes. n = 4 biologically independent samples. g Immunofluorescence staining of HIF-1α in BMDMs with lactate or NaCl treatment; scale bar, 20 μm. h Relative fluorescence intensity of HIF-1α in g. n = 5 biologically independent samples. i Western blotting of HIF-1α in eWAT of lean and obese WT and AKO mice. j Densitometry quantification of HIF-1α level in (i). n = 3 biologically independent samples. k mRNA level of Hif1a in epididymal white adipose tissue (eWAT). STC-WT: n = 4; STC-AKO: n = 3; HFD-WT: n = 10; HFD-AKO: n = 7 biologically independent animals. l Immunofluorescence staining of HIF-1α and F4/80 in eWAT; scale bar, 100 μm. m Relative fluorescence intensity of HIF-1α in (l). n = 5 biologically independent samples. Data represent mean ± SEM; Significance was calculated by two-way ANOVA with post hoc Bonferroni correction (b, c, h, j, k) or two-tailed student’s t test (df, m).
Fig. 6
Fig. 6. Lactate directly binds and inhibits the activity of PHD2.
a Egln1 mRNA level in macrophages with 20 mM lactate or NaCl. n = 4 biologically independent samples. b mRNA of Egln1 in epididymal white adipose tissue (eWAT) of wildtype (WT) and adipocyte-specific Ldha knockout (AKO) mice. STC-WT: n = 4; STC-AKO: n = 4; HFD-WT: n = 8; HFD-AKO: n = 8 biologically independent animals. c In vitro fluorometric PHD2 activity assay in the presence of 20 mM lactate or NaCl. n = 4 biologically independent samples. d His-tagged HIF-1α was incubated with PHD2 in presence of 20 mM lactate or NaCl. Time-dependent HIF-1α hydroxylation was examined by Western blotting. e Pull down assay between PHD2 and lactate. His-tagged PHD2 protein was incubated with 14C-labeled lactate. Unlabeled lactate or α-ketoglutarate (α-KG) was added where indicated. Count per min (CPM) in Ni-NTA beads was measured by liquid scintillation counter. Group 1: n = 3; Group 2,3,4,5: n = 4 biologically independent samples. f Isothermal titration calorimetry (ITC) of PHD2 with lactate and α-KG. Sequential heat pulses for each injection (upper panel) and the integrated data (lower panels). α-KG → PHD2: injecting α-KG to PHD2; Lac→PHD2: injecting lactate to PHD2; α-KG → PHD2 + Lactate: injecting α-KG to PHD2 + lactate mixture. g, h Representative images of autodocking for catalytic domain of PHD2, lactate and α-KG. Blue: α-KG, Green: lactate, yellow dash lines: hydrogen bonds. i, j Egln1 gene was knocked out by Crispr/Cas9 mediated method in immortalized mouse BMDM. The macrophages were treated with lactate or vehicle control. i Western blotting of PHD2 in WT and Egln1 KO macrophage. j mRNA level of Il-1β in WT and Egln1 KO macrophages with 20 mM lactate or NaCl. n = 4 biologically independent samples. Data represent mean ± SEM; Significance was calculated by two-way ANOVA with post hoc Bonferroni correction (a, b, e, j) or two-tailed student’s t test (c).
Fig. 7
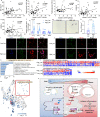
Fig. 7. Human adipose lactate level is positively correlated with adipose inflammation and insulin resistance independent of BMI.
ae Correlation between lactate levels in human omental adipose tissues with a BMI, b fasting insulin, c fasting glucose, d HOMA-IR and e HOMA-β index. n = 65 subjects. fm 7 omental fat samples were randomly selected from low and high lactate groups (Low_Lac vs. High_Lac). f Inflammatory cytokines mRNA level in adipose. n = 7 individuals. g HE staining of omental fat; scale bar, 200 μm. Arrows point at the crown like structures (CLSs). h CLS numbers in omental fat. n = 7 individuals. i, j Immunofluorescence staining of iNOS and HIF-1α and human macrophage marker CD14; scale bar, 40 μm. k, l RNASeq of omental fat (n = 7 individuals). k GO enrichment of upregulated pathways in High_Lac group. l Heatmap showing differentially expressed genes in GO:0002274 and GO:0002253. m Transcription factor (TF) enrichment in upregulated genes in High_Lac group. Significantly enriched TFs (p < 0.05) were highlighted in blue. HIF-1α was shown in the enlarged region. n Illustration of the study hypothesis. Data represent mean ± SEM; Statistics were performed using spearman correlation analysis (ae), two-way ANOVA with post hoc Bonferroni correction (f) or two-tailed student’s t test (h).

References

    1. Rosen ED, Spiegelman BM. What we talk about when we talk about fat. Cell. 2014;156:20–44. doi: 10.1016/j.cell.2013.12.012. - DOI - PMC - PubMed
    1. Osborn O, Olefsky JM. The cellular and signaling networks linking the immune system and metabolism in disease. Nat. Med. 2012;18:363–374. doi: 10.1038/nm.2627. - DOI - PubMed
    1. Xu H, et al. Chronic inflammation in fat plays a crucial role in the development of obesity-related insulin resistance. J. Clin. Invest. 2003;112:1821–1830. doi: 10.1172/JCI200319451. - DOI - PMC - PubMed
    1. Weisberg SP, et al. Obesity is associated with macrophage accumulation in adipose tissue. J. Clin. Invest. 2003;112:1796–1808. doi: 10.1172/JCI200319246. - DOI - PMC - PubMed
    1. Lumeng CN, Bodzin JL, Saltiel AR. Obesity induces a phenotypic switch in adipose tissue macrophage polarization. J. Clin. Invest. 2007;117:175–184. doi: 10.1172/JCI29881. - DOI - PMC - PubMed

MeSH terms