. 2022 Sep;3(9):1071-1087.
doi: 10.1038/s43018-022-00431-9. Epub 2022 Sep 5.

Ectopic JAK-STAT activation enables the transition to a stem-like and multilineage state conferring AR-targeted therapy resistance

Affiliations

Ectopic JAK-STAT activation enables the transition to a stem-like and multilineage state conferring AR-targeted therapy resistance

Su Deng et al. Nat Cancer. 2022 Sep.

Erratum in

Abstract

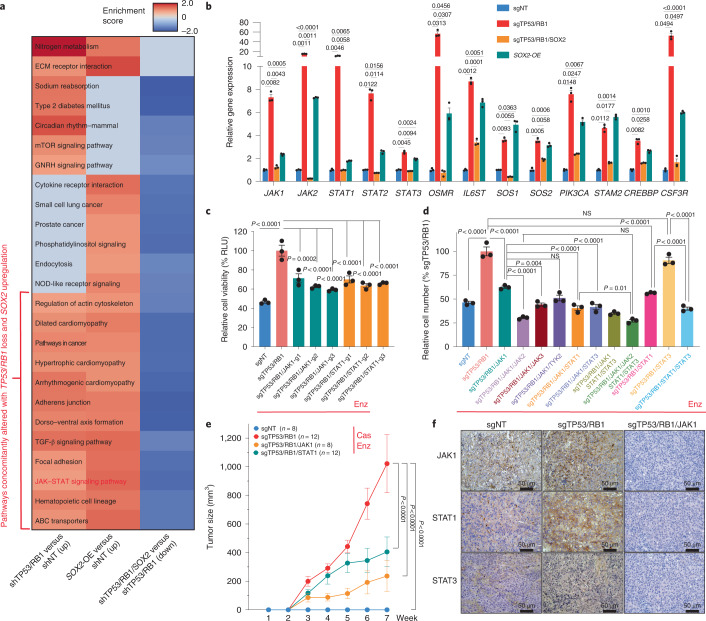
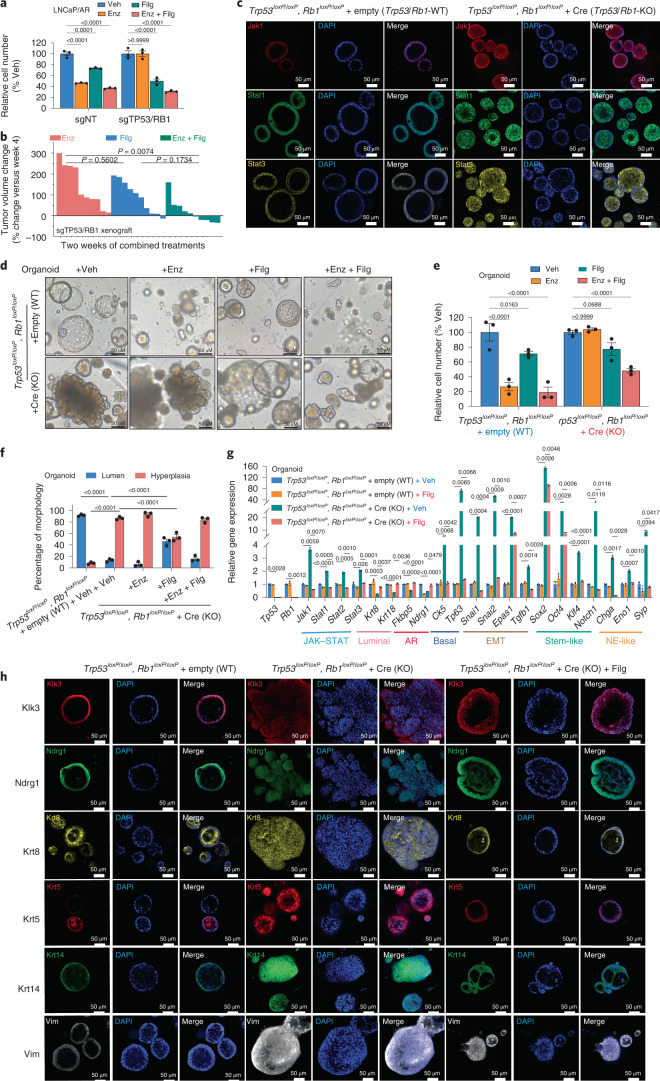
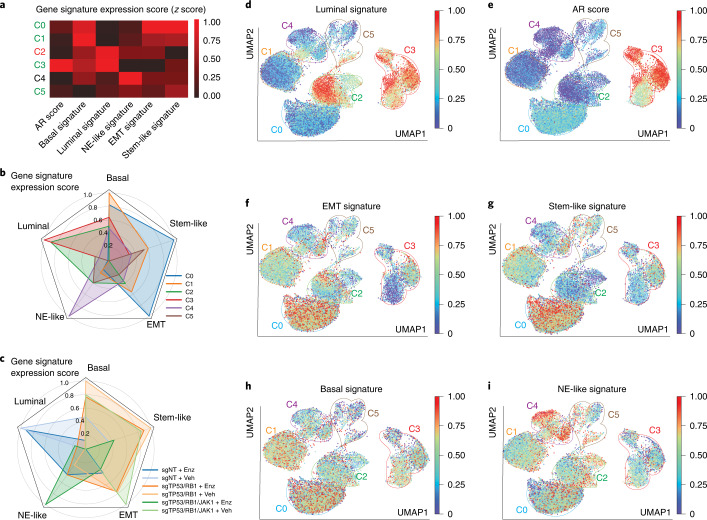
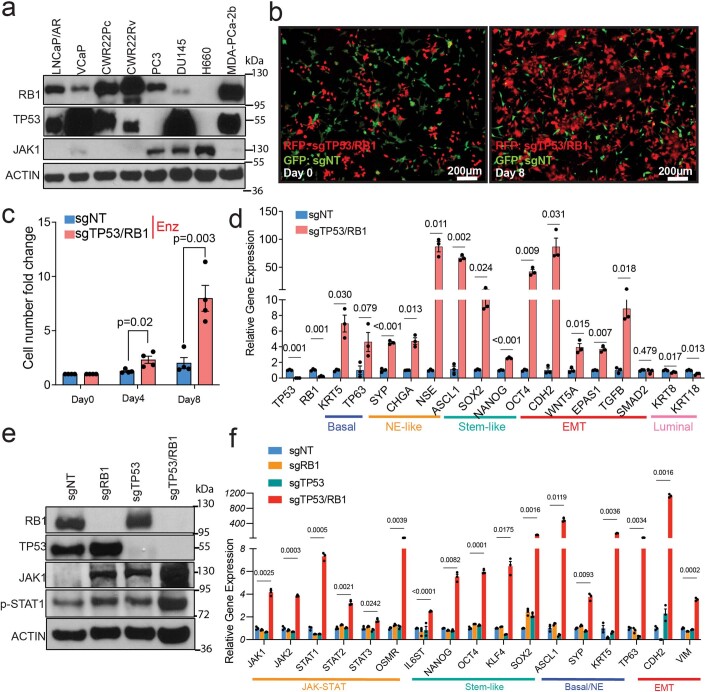
Emerging evidence indicates that various cancers can gain resistance to targeted therapies by acquiring lineage plasticity. Although various genomic and transcriptomic aberrations correlate with lineage plasticity, the molecular mechanisms enabling the acquisition of lineage plasticity have not been fully elucidated. We reveal that Janus kinase (JAK)-signal transducer and activator of transcription (STAT) signaling is a crucial executor in promoting lineage plasticity-driven androgen receptor (AR)-targeted therapy resistance in prostate cancer. Importantly, ectopic JAK-STAT activation is specifically required for the resistance of stem-like subclones expressing multilineage transcriptional programs but not subclones exclusively expressing the neuroendocrine-like lineage program. Both genetic and pharmaceutical inhibition of JAK-STAT signaling resensitizes resistant tumors to AR-targeted therapy. Together, these results suggest that JAK-STAT are compelling therapeutic targets for overcoming lineage plasticity-driven AR-targeted therapy resistance.


Conflict of interest statement

G.R. holds issued and pending patents, which have been licensed to EtiraRx. G.R. serves or has served in an advisory role to Bayer, Johnson and Johnson, Myovant, EtiraRx, Amgen, Pfizer and Astellas. G.R. has or has had grant support from Bayer, EtiraRx and Johnson and Johnson. All other authors declare that they have no competing interests.

Figures

Fig. 1
Fig. 1. JAK–STAT signaling is required for Enz resistance in TP53/RB1-deficient mCRPC.
a, Heat map representing the significantly changed signaling pathways in LNCaP/AR cell lines transduced with annotated shRNAs based on GSEA analysis. Three comparisons are presented. Reads from n = 3 independently treated cell cultures in each group were used for analysis. Signaling pathways concomitantly altered with TP53/RB1 loss and SOX2 upregulation are labeled with a red bracket. b, Relative gene expression of canonical genes activated in the JAK–STAT signaling pathway in LNCaP/AR cells transduced with Cas9 and annotated guide RNAs; n = 3 independently treated cell cultures. P values were calculated using a two-way ANOVA with a Bonferroni multiple-comparison test. c, Relative cell numbers of LNCaP/AR cells transduced with Cas9 and annotated CRISPR guide RNAs. Cells were treated with 10 µM Enz for 8 d, and cell numbers (viability) were measured using a CellTiter-Glo assay, with all values normalized to the sgTP53/RB1 group; n = 3 independently treated cell cultures. P values were calculated by one-way ANOVA with a Bonferroni multiple-comparison test; RLU, relative light units. d, Relative cell numbers of LNCaP/AR cells transduced with Cas9 and annotated CRISPR guide RNAs. Cells were treated with 10 µM Enz for 8 d, and cell numbers (viability) were measured using a CellTiter-Glo assay, with all values normalized to the sgTP53/RB1 group; n = 3 independently treated cell cultures. P values were calculated by one-way ANOVA with a Bonferroni multiple-comparison test; NS, not significant. e, Tumor growth curve of xenografted LNCaP/AR cells transduced with Cas9 and annotated guide RNAs in castrated mice. Cas denotes castration 2 weeks before grafting. Enz denotes Enz treatment at 10 mg kg–1 from day 1 of grafting; n = number of independent xenografted tumors in each group (two tumors per mouse); sgNT, n = 8 tumors; sgTP53/RB1, n = 12 tumors; sgTP53/RB1/JAK1, n = 8 tumors; sgTP53/RB1/STAT1, n = 12 tumors. P values were calculated by two-way ANOVA with a Bonferroni multiple-comparison test. f, IHC staining of JAK–STAT proteins on annotated xenografted tumor slides showing representative images of n = 2 independent tumors. Source data
Fig. 2
Fig. 2. JAK1 KO stagnates the lineage transition to a stem-like and multilineage state.
ae, Relative expression of canonical AR target genes and lineage marker genes in LNCaP/AR cells transduced with Cas9 and annotated guide RNAs; n = 3 independently treated cell cultures. P values were calculated by two-way ANOVA with a Bonferroni multiple-comparison test. f, Representative images of an LNCaP/AR cell transwell migration assay of three independent treated cell cultures. g, Quantification of the migrated cell numbers of nine representative images taken from three independent treated cell cultures for each of the cell lines. P values were calculated by one-way ANOVA with a Bonferroni multiple-comparison test. h, Representative images of an LNCaP/AR cell invasion assay of three independent treated cell cultures. i, Quantification of the numbers of invading cells of nine representative images taken from three independent treated cell cultures for each of the cell lines. P values were calculated by one-way ANOVA with a Bonferroni multiple-comparison test. j, Representative images of an LNCaP/AR cell prostasphere formation assay of three independent treated cell cultures. k, Quantification of the prostaspheres formed from three independent treated cell cultures for each of the cell lines. P values were calculated by one-way ANOVA with a Bonferroni multiple-comparison test. Unless otherwise noted, data are represented as mean ± s.e.m. Source data
Fig. 3
Fig. 3. Ectopic JAK–STAT activation correlates with poor clinical outcomes.
a, IHC staining of annotated JAK–STAT proteins on benign prostate tissues or PCa samples; n = 2 independent tumors in each group. b,c, Relative expression of JAK1 (b) and STAT1 (c) in benign prostate tissues or PCa samples. The center line indicates the median, the box limits indicate upper and lower quartiles and the whiskers indicate maximum and minimum values. P values were calculated by a two-sided Mann–Whitney test; n = 10 benign prostate samples; n = 11 PCa tumors. d, Schematic figure representing the generation and examination of the PDE model. The figure was created with BioRender.com; Veh, vehicle. e, Relative expression of JAK1 in a series of PDEs treated with vehicle (DMSO) or Enz (10 µM) for 24 h. f, Relative expression of STAT1 in a series of PDEs treated with vehicle (DMSO) or Enz (10 µM) for 24 h. For e and f, n = 7 independent PDEs, and data show mean ± s.e.m. P values were calculated by two-sided t-test. g, Principal-component analysis (PCA) plots of human CRPC biopsy samples; participant 1, n = 2,691 cells, CRPC-adeno; participant 5, n = 2,123 cells, CRPC-NE. For each sample, single-cell transcriptomic profiles are colored by the expression (log2 CPM) of selected genes representing canonical signaling pathways and lineage-related transcriptional programs. The schematic figure was created with BioRender.com. hl, Violin plots representing the expression scores of canonical JAK–STAT signaling, AR signaling and lineage marker genes in subclones with high versus low TP53/RB1 expression in both participants 1 and 5. The center line indicates the median, upper and lower lines indicate upper and lower quartiles and violin limits indicate maximum and minimum values; TP53/RB1-high: participant 1 n = 2,215 cells and participant 5 n = 1,796 cells; TP53/RB1-low: participant 1 n = 476 cells and participant 5 n = 327 cells. P values were calculated by two-sided Mann–Whitney test. Source data
Fig. 4
Fig. 4. JAK1 inhibitor restores Enz sensitivity.
a, Relative cell number of LNCaP/AR cells transduced with Cas9 and annotated CRISPR guide RNAs and treated with annotated treatments in CSS medium and normalized to the vehicle group; Enz, 10 μM Enz; Filg, 5 μM Filg; Enz + Filg, combination of Enz and Filg; vehicle, DMSO treatment with equal volume as Enz. Cells were treated for 8 d, and cell numbers were measured by a CellTiter-Glo assay. b, Waterfall plot displaying changes in tumor size of xenografted LNCaP/AR-sgTP53/RB1 cells after 2 weeks of treatments. All animals were treated with Enz at 10 mg kg–1 orally 1 d after grafting. Beginning from week 3 of xenografting, animals were randomized into three groups and treated with Enz only at 10 mg kg–1 orally, Filg only at 20 mg kg–1 orally twice daily or a combination of Enz plus Filg; n = the number of independent xenografted tumors in each group (two tumors per mouse); Enz, n = 10 tumors; Filg, n = 10 tumors; Enz + Filg, n = 10 tumors. P values were calculated by one-way ANOVA with a Bonferroni multiple-comparison test. c, IF staining of the Trp53loxP/loxPRb1loxP/loxP + empty (Trp53/RB1-WT) and Trp53loxP/loxPRb1loxP/loxP + Cre (Trp53/RB1-KO) organoids in 3D with annotated antibodies; representative images of n = 2 independent treated cell cultures are shown. d, Brightfield images of annotated organoids treated with DMSO (vehicle), 1 μM Enz, 5 μM Filg or Enz and Filg (Enz + Filg) for 6 d; representative images of n = 3 independent treated cell cultures are shown. e, Relative cell numbers of annotated organoids treated with annotated treatments for 6 d normalized to the vehicle group. Treatments are the same as described in d. f, Percentage of organoids that display lumen or hyperplasia morphology. Treatments are the same as described in d. g, Relative expression of JAKSTAT and lineage marker genes in organoids treated with the treatments annotated in d. h, IF staining of the annotated organoids with antibodies targeting the proteins encoded by AR target genes and lineage marker genes; representative images of n = 2 independent treated cell cultures are shown. Unless otherwise noted, n = 3 independent treated cell cultures, and data represent mean ± s.e.m. P values were calculated by two-way ANOVA with a Bonferroni multiple-comparison test. Source data
Fig. 5
Fig. 5. SOX2 enables JAK–STAT activation in a positive feedback fashion.
ad, SOX2 ChIP–qPCR of JAK1 (a,c) and STAT1 (b,d) genomic loci in LNCaP/AR cells transduced with annotated CRISPR guide RNAs or overexpressing constructs. e, Relative cell numbers of LNCaP/AR cells transduced with annotated constructs and treated with Enz or vehicle, normalized to the vehicle group; Enz, 10 μM Enz; vehicle, DMSO treatment with equal volume as Enz. Cells were treated for 6 d, and cell numbers were measured by cell proliferation assay. f, Relative cell number fold change of LNCaP/AR cells transduced with annotated constructs. Data are normalized to the SOX2-OE + sgNT group; Enz, 10 μM Enz treatment for 8 d. Cell numbers were measured by a CellTiter-Glo assay. P values were calculated by one-way ANOVA with a Bonferroni multiple-comparison test. g, Relative expression of canonical lineage marker genes in LNCaP/AR SOX2-OE cells transduced with annotated constructs. h, Relative expression of canonical lineage marker genes in LNCaP/AR cells transduced with JAK1 or STAT1 cDNA constructs. SOX2 expression is highlighted in red. i, Relative expression of SOX2 in LNCaP/AR cells transduced with annotated guide RNAs. j, Relative expression of SOX2 in LNCaP/AR cells treated with 5 µM Filg or 5 µM ruxolitinib (Rux) or DMSO for 8 d. P values in i and j were calculated by one-way ANOVA with a Bonferroni multiple-comparison test. k, Relative gene expression levels of canonical JAK–STAT signaling and lineage marker genes in the inducible shTP53/RB1 LNCaP/AR cells treated with Dox for various lengths of time. Data are normalized to 0 h. Unless otherwise noted, n = 3 independent treated cell cultures, and data represent mean ± s.e.m. P values were calculated by two-way ANOVA with a Bonferroni multiple-comparison test. Source data
Fig. 6
Fig. 6. JAK–STAT is required for AR therapy resistance of heterogenous subclones.
ac, UMAP plots of single-cell transcriptomic profiles of LNCaP/AR cells transduced by annotated CRISPR guide RNAs and treated with vehicle (DMSO) or 10 µM Enz for 5 d; sgNT (Veh, n = 14,268 cells; Enz, n = 15,149 cells; a); sgTP53/RB1 (Veh, n = 12,267 cells; Enz, n = 9,850 cells; b); sgTP53/RB1/JAK1 (Veh, n = 25,200 cells; Enz, n = 11,096 cells; c). Cells on the left are colored according to sample origin, while cells on the right are colored by predicted cell cycle phase. d, Bar plot presenting the percent distribution of single cells in different cell cycle phases in each sample. The numbers of cells (n) are the same as in ac. P values were calculated by two-sided Fisher’s exact test. e, Single-cell profile of LNCaP/AR cells based on clustering. A UMAP plot of single cells colored by unsupervised clustering of six subsets is presented; cluster 0 (C0), n = 26,944 cells; C1, n = 15,994 cells; C2, n = 14,029 cells; C3, n = 14,278 cells; C4, n = 10,025 cells; C5, n = 6,560 cells. f, Single-cell profile of LNCaP/AR cells based on subclustering. A UMAP plot of single cells colored by unsupervised clustering of 13 subclusters is presented; C0, n = 26,944 cells; C1, n = 15,994 cells; C2-1, n = 9,513 cells; C2-2, n = 2,402 cells; C2-3, n = 2,114 cells; C3-1, n = 2,578 cells; C3-2, n = 6,079 cells; C3-3, n = 5,621 cells; C4-1, n = 3,680 cells; C4-2, n = 3,459 cells; C4-3, n = 2,886 cells; C5-1, n = 4,775 cells; C5-2, n = 1,785 cells. g, Single-cell profile of LNCaP/AR cells transduced with annotated CRISPR guide RNAs and treated with vehicle or Enz. A UMAP plot of single cells colored by samples is represented. The area and number of clusters in e are highlighted with colored circles. h, Single-cell profile of LNCaP/AR cells based on cell cycle states. A UMAP plot of single cells colored by cell cycle prediction is presented. The area and number of clusters in e are highlighted with colored circles. i, Bar plot presenting the percent distribution of single cells in different cell cycle phases in each of the six clusters. The number of cells (n) in each sample is the same as in e. P values were calculated by two-sided Fisher’s exact test. Source data
Fig. 7
Fig. 7. JAK–STAT is required for stem-like and multilineage subclones.
a, Heat map representing the lineage scores of canonical lineage marker gene signatures in cell clusters. Winner clusters (without increased cell cycle arrest) are highlighted in green, and the loser cluster (with increased cell cycle arrest) is highlighted in red. b, Radar plot representing the lineage scores and distribution of different cell clusters. c, Radar plot representing the lineage scores and distribution of different samples. In ac, lineage scores were scaled from 0 to 1 across all clusters. d, UMAP plot of single-cell transcriptomic profiles colored by luminal gene signature score (z score) for each cell (dot). e, UMAP plot of single-cell transcriptomic profiles colored by AR gene signature score (z score) for each cell (dot). f, UMAP plot of single-cell transcriptomic profiles colored by EMT gene signature score (z score) for each cell (dot). g, UMAP plot of single-cell transcriptomic profiles colored by stem cell-like gene signature score (z score) for each cell (dot). h, UMAP plot of single-cell transcriptomic profiles colored by basal gene signature score (z score) for each cell (dot). i, UMAP plot of single-cell transcriptomic profiles colored by NE-like gene signature score (z score) for each cell (dot). In di, distribution areas of each cluster are labeled in color circles. The color density of each cell is scaled by the color bar. For all data, the numbers (n) of cells in each sample and cluster are the same as in Fig. 6, and lineage scores were scaled from 0 to 1 across all cells.
Fig. 8
Fig. 8. Dynamics of lineage plasticity driven by ectopic JAK–STAT activation.
a, UMAP plots represent the reconstructive trajectory of single cells in each of the samples. b, UMAP plots represent the reconstructive trajectory of single cells in each of the subclusters. c, UMAP plots represent the pseudotime reconstructive trajectory of single cells. Color intensity represents the pseudotime estimation of each single cell. Arrows and the dotted line represent the direction of pseudotime flow. d, UMAP plots represent the S phase score per cell in each single cell within the pseudotime reconstructive trajectory. eh, UMAP plots represent the AR signaling and lineage scores per cell in each single cell within the pseudotime reconstructive trajectory. i, UMAP plots represent the pseudotime reconstructive trajectory of single cells of cluster 4. Color intensity represents the pseudotime estimation of each single cell. Arrows and the dotted line represent the direction of pseudotime flow. jl, UMAP plots represent lineage scores per cell in each single cell within the pseudotime reconstructive trajectory of single cells of cluster 4. m, Schematic figure illustrating that SOX2 ectopically activates JAK–STAT signaling, which enables the transition of mCRPC to a stem-like and multilineage state. Figure created with BioRender.com. The numbers (n) of cells in each sample and cluster are the same as in Fig. 6.
Extended Data Fig. 1
Extended Data Fig. 1. JAK–STAT signaling pathway is enriched in Enz resistant mCRPC with TP53/RB1-deficiency.
a, Heat map represents the significantly changed signaling pathways in LNCaP/AR cell lines transduced with annotated shRNAs and treated with Enz or vehicle, based on GSEA analysis. Signaling pathways specifically enriched in shTP53/RB1 Enz-resistant cells are labeled with red bracket. Three comparations are presented and reads from n = 3 independently treated cell cultures were used for analysis. b, Venn diagram represents the signaling pathways concomitantly altered with TP53/RB1-Loss and SOX2-OE, while also specifically enriched in in shTP53/RB1 Enz-resistant cells. c-g, GSEA analysis of JAK–STAT signaling pathway (KEGG_JAK_STAT_Signaling_Pathway) expression in: (c) SOX2-OE group compared to shNT group; (d) shTP53/RB1 group compared to shNT group; (e) shTP53/RB1 group compared to shTP53/RB1/SOX2 group; (f) shTP53/RB1 + Enz group compared to shNT-Veh group; (g) shTP53/RB1 + Enz group compared to shTP53/RB1 + Veh group. For panel c-g, reads from n = 3 independently treated cell cultures were used for analysis. GSEA p-values were calculated with two-sided permutation test by simulations.
Extended Data Fig. 2
Extended Data Fig. 2. LNCaP/AR-sgTP53/RB1 is a highly resistant and lineage plastic cell line model.
a, Western Blot represents the level of RB1, TP53, JAK1 and ACTIN proteins in a series of human PCa cell line models; representative pictures of 2 repeats with similar results were shown. b, Fluorescence microscope imaging shows the cell mixtures of sgTP53/RB1-RFP cells (red) and sgNT-GFP cells (green) on Day 0 and Day 8 of the competition assay cultured in CSS medium and 10 µM Enz; representative pictures of n = 4 independently treated cell cultures were shown. c, Relative cell number fold change of LNCaP/AR cells transduced with Cas9 and annotated guide RNAs measured in the competition assay. The cell mixtures of sgNT-GFP and sgTP53/RB1-RFP were treated in CSS medium with 10 µM Enz for 8 days and the number of GFP/RFP positive cells were measured by FACS on Day 0, 4 and 8. n = 4 independently treated cell cultures. d, Relative expression of canonical lineage marker genes in LNCaP/AR cells transduced with Cas9 and annotated guide RNAs. For panel (c-d), p-values were calculated using two-tailed multiple t-test with Welch’s correction and annotated in figure. e, Western Blot represents the level of RB1, TP53, JAK1, p-STAT1 and ACTIN proteins in LNCaP/AR cells transduced with Cas9 and annotated guide RNAs; representative of 2 repeats with similar results were shown. f, Relative expression of canonical JAK–STAT signaling and lineage marker genes in LNCaP/AR mCRPC cells transduced with Cas9 and annotated guide RNAs. p-values were calculated using two-way ANOVA with Bonferroni multiple-comparison test and annotated in figure. For all panels unless otherwise noted, n = 3 independently treated cell cultures and mean ± s.e.m. is represented. Source data
Extended Data Fig. 3
Extended Data Fig. 3. JAK–STAT signaling is specifically required for AR therapy resistance.
a, Relative expression of JAK–STAT genes in LNCaP/AR-sgTP53/RB1 cells transduced with Cas9 and annotated guide RNAs. p-values were calculated using two-tailed multiple t-test with Welch’s correction. b, Western blot of JAK1-3 and STAT1-3 proteins in LNCaP/AR cells transduced with Cas9 and annotated guide RNAs; representative pictures of 2 repeats with similar results were shown. c, Relative cell number of LNCaP/AR cells transduced with annotated CRISPR guide RNAs. Cells were treated with 10 µM enzalutamide (Enz) for 8 days, and cell numbers (viability) were measured using CellTiter-Glo assay, all normalized to sgTP53/RB1 group. p-values were calculated using one-way ANOVA with Bonferroni multiple-comparison test. d, Relative cell number of CWR22Pc cells transduced with annotated shRNAs. e, Relative cell number of CWR22Pc cells transduced with annotated shRNAs and/or Cas9 and CRISPR guide RNAs. For panel d-e, cell numbers were measured by cell proliferation assay, normalized to Veh condition, and p-values were calculated using two-way ANOVA with Bonferroni multiple-comparison. f, Relative cell number of LNCaP/AR-sgNT cells transduced with Cas9 annotated CRISPR guide RNAs. Cells were treated with 10 µM enzalutamide (Enz) for 8 days and cell number was measured using CellTiter-Glo assay, all normalized to sgNT group. p-values were calculated using one-way ANOVA with Bonferroni multiple-comparison test. g, Relative cell number of LNCaP/AR-sgTP53/RB1 cells transduced with Cas9 annotated CRISPR guide RNAs. Cells were treated with DMSO for 8 days and cell number was measured using CellTiter-Glo assay, all normalized to sgTP53/RB1 group. p-values were calculated using one-way ANOVA with Bonferroni multiple-comparison test. For all panels unless otherwise noted, n = 3 independently treated cell cultures and mean ± s.e.m. is represented. p-values were annotated in figures. Source data
Extended Data Fig. 4
Extended Data Fig. 4. JAK1-KO reversed the acquisition of lineage plasticity.
a, Western blot of JAK1, pSTAT1 and lineage marker proteins in LNCaP/AR cells transduced with Cas9 and annotated guide RNAs; representative pictures of 2 repeats with similar results were shown. b, Relative expression of canonical JAK–STAT genes in LNCaP/AR mCRPC cells transduced with Cas9 and annotated guide RNAs. n = 3 independently treated cell cultures and mean ± s.e.m. is represented. p-values were calculated using two-way ANOVA with Bonferroni multiple-comparison test and annotated in figure. c, IF staining of LNCaP/AR cells transduced with Cas9 and annotated guide RNAs with annotated antibodies; representative pictures of n = 2 independent treated cell cultures were shown. Source data
Extended Data Fig. 5
Extended Data Fig. 5. JAK1 and STAT1 genomic alterations is correlated with poor outcome of patients with mCRPC.
a, Number of PCa cases with genomic alterations (amplification or mutation) in the loci of key JAK–STAT signaling genes in the mCRPC tumors of the SU2C cohort, compared to the number in the primary tumors of the TCGA PanCancer cohort. TCGA PanCancer = 489 tumors, SU2C = 444 tumors. b, Number of PCa cases with genomic alterations (amplification or mutation) in the loci of key JAK–STAT signaling genes in the mCRPC tumors of the SU2C cohort, compared to the frequency in the primary tumors of the TCGA Cell 2015 cohort. TCGA Cell 2015 = 333 tumors, SU2C = 444 tumors. For panel (a-b), p-values were calculated using two-tails Fisher’s exact test and annotated in figures. c, Expression (RSEM) of JAK–STAT signaling genes in patients with regional lymph nodes metastasis (N1, n = 80 tumors) compared to patients without regional lymph nodes metastasis (N0, n = 345 tumors). d, Expression (RSEM) of JAK–STAT signaling genes in the high-grade tumors (Gleason score ≥ 8, n = 206 tumors) compared to the low-grade tumors (Gleason score ≤ 7, n = 292 tumors). For panel (c-d), mean ± s.d. is represented and p-values were calculated using two-sided Mann–Whitney test and annotated in figures. Source data
Extended Data Fig. 6
Extended Data Fig. 6. JAK–STAT inhibition reversed the lineage plasticity-driven AR therapy resistance in PDO.
a, Schematic figure represents the generation and examination of patient-derived organoid (PDO) model. Figure was created with BioRender.com. b, Relative expression of JAK–STAT genes in a series of PDOs based on RNA-seq results (see Methods). c, Bright field pictures of PDO MSKPCa8 and MSKPCa9 cultured in 3D matrigel and treated with DMSO (Veh), 10 μM enzalutamide (Enz), 5 μM filgotinib (Filg) or the combination of Enz and Filg (Enz + Filg) for 6 days, representative pictures of n = 3 independent treated cell cultures. d, Relative cell number of PDO MSKPCa8 and MSKPCa9 treated with annotated treatments for 6 days, normalized to “Veh” group. Treatment’s denotation is same as panel (c). n = 3 independently treated cell cultures and mean ± s.e.m. is represented. p-values were calculated using two-way ANOVA with Bonferroni multiple-comparison test and annotated in figure. Source data
Extended Data Fig. 7
Extended Data Fig. 7. JAK inhibitor impairs lineage plasticity and restores Enz sensitivity.
a, Enz dose–response curve of LNCaP/AR cells transduced with Cas9 and annotated CRISPR guide RNAs. b, Filg dose–response curve of LNCaP/AR cells transduced with annotated Cas9 and CRISPR guide RNAs. For panel (a-b), p-values were calculated by non-linear regression with two-sided extra sun-of-squares F test. c, Relative cell number of CWR22Pc cells transduced with annotated shRNAs and treated with various treatments, normalized to “Veh” group. Enz denotes 1 μM Enz, Filg denotes 5 μM filgotinib, Enz + Filg denotes the combination of Enz and Filg and Veh denotes DMSO treatment with equal volume as Enz. Cells were treated for 4 days and cell numbers were counted. d, Relative expression of canonical lineage marker genes in CWR22Pc cells transduced with annotated shRNAs and treated with vehicle or Filg, normalized to “shNT + Veh” group. Filg denotes 5 μM filgotinib, and Veh denotes DMSO treatment with equal volume as Filg. e, Cell number of DU145 cells upon treatment administration, measured by cell proliferation assay. f, Cell number of PC3 cells upon treatment administration, measured by cell proliferation assay. For e-f panels, Filg denotes 5 µM Filgotinib and Veh denotes DMSO treatment for 9 days. For all panels unless otherwise noted, n = 3 independently treated cell cultures and mean ± s.e.m. is represented; p-values were calculated using two-way ANOVA with Bonferroni multiple-comparison test and were annotated in figures. Source data
Extended Data Fig. 8
Extended Data Fig. 8. JAK–STAT inhibitors have combined inhibitory effect on PCa cells with lineage plasticity.
a, IHC of the Trp53loxP/loxP, Rb1loxP/loxP + Empty (TP53/RB1-WT) and Trp53loxP/loxP, Rb1loxP/loxP + Cre (TP53/RB1-KO) organoids cultured in 3D, with annotated antibodies. b, IF of annotated organoids cultured in 3D, with annotated antibodies targeting canonical AR target genes and lineage marker genes. For panels a and b, representative pictures of n = 2 independent treated cell cultures were shown. c, Relative cell number of LNCaP/AR cells treated with annotated treatment: 10 µM enzalutamide (Enz), 5 µM filgotinib (Filg), 5 µM ruxolitinib (Ruxo), 1 µM fludarabine (Flu), 0.2 µM niclosamide (Nic) and DMSO for 8 days and cell numbers (viability) were measured using CellTiter-Glo assay, all normalized to vehicle group. p-values were calculated using one-way ANOVA with Bonferroni multiple-comparison test. d, Relative gene expression of JAK–STAT genes in xenograft-derived Enz resistant cell lines with CHD1-deficiency. e-g, Cell number of xenografted-derived Enz resistant cells upon treatment administration, measured by cell proliferation assay. For panels (e-g), Enz denotes 10 µM enzalutamide, Filg denotes 5 µM filgotinib, Rux denotes 5 µM ruxolitinib and Veh denotes DMSO treatment for 7 days. For all panels unless otherwise noted, n = 3 independently treated cell cultures and mean ± s.e.m. is represented. p-values were calculated using two-way ANOVA with Bonferroni multiple-comparison test and annotated in figures. Source data
Extended Data Fig. 9
Extended Data Fig. 9. Canonical JAK–STAT genes are among the prostate cancer-specific gene targets of SOX2 in mCRPC.
a, H3K27ac ChIP-qPCR of the JAK1 genomic locus in LNCaP/AR cells transduced with annotated constructs. b, H3K27me3 ChIP-qPCR of the JAK1 genomic locus in LNCaP/AR cells transduced with annotated constructs. For panels (a,b), p-values were calculated using one-way ANOVA with Bonferroni multiple-comparison test. c, Representative SOX2 binding sites in the genomic loci of JAK–STAT signaling genes in the mCRPC CWR-R1 cell line based on ChIP-seq analysis. d, SOX2 binding peak score in the genomic loci of JAK–STAT signaling genes in the mCRPC CWR-R1 cell (prostate cancer specific binding) compared to human ESC cell line WA01. Reads from n = 3 independent cell cultures and matching input controls were used for analysis. e, Relative cell numbers of LNCaP/AR cells transduced with annotated constructs and treated with various treatments in CSS medium for 8 days, normalized to “Veh” group. Enz denotes 10 μM enzalutamide, Filg denotes 5 μM filgotinib, Enz + Filg denotes the combination of Enz and Filg, Veh denotes DMSO treatment with equal volume as Enz, for 8 days and cell numbers were counted, normalized to Veh group. f, Relative expression of canonical lineage marker genes in LNCaP/AR-SOX2-OE cells treated with annotated treatments. Filg denotes 5 μM filgotinib, and Veh denotes DMSO treatment with equal volume as Filg. Cells were treated for 6 days. p-values were calculated using two-way ANOVA with Bonferroni multiple-comparison test. For all panels unless otherwise noted, n = 3 independently treated cell cultures and mean ± s.e.m. is represented; p-values were annotated in figures. Source data
Extended Data Fig. 10
Extended Data Fig. 10. AR signaling partially restored in the subclones with TP53/RB1/JAK1-KD and vehicle treatment.
a, Bar plot presents the number of single cells expressing high level (expression level in the top 20% of all single cells of all samples) of AR targeted genes (partial AR Score genes as shown in Supplemental Table). p-values are calculated with two-sided Chi-square test with Yates correction and annotated in figure. (Veh n = 14268 cells, Enz n = 15149 cells), sgTP53/RB1 (Veh n = 12267 cells, Enz n = 9850 cells), sgTP53/RB1/JAK1 (Veh n = 25200 cells, Enz n = 11096 cells). b-f, UMAP plot of single cell transcriptomic profiles colored by expression of selected AR target genes (z-score, AR Score genes) for each cell (dot). LNCaP/AR cells were transduced with Cas9 and annotated CRISPR guide RNAs and treated with vehicle or Enz for 5 days. Fields of different sample groups are labeled with different color. g, UMAP plot of single cells in cluster 4, colored by unsupervised clustering of 3 sub-clusters. h, Bar plot presents the percentage distribution of each single cell in different cell cycle phases from subcluster 4-1, 4-2 and 4-3. n of cells in each cluster: C4-1 n = 3680 cells, C4-2 n = 3459 cells, C4-3 n = 2886 cells. p-values are calculated with two-sided Fisher’s Exact Test. i-r, UMAP plot of single cell transcriptomic profiles colored by expression of canonical JAK–STAT target genes (z-score) for each cell (dot) of LNCaP/AR cells in Cluster 4. For panel i-r, distribution area of subcluster 4-1, 4-2, 4-3 are labeled with red, blue, and black. For all panels, color density of each cell is scaled by the color bar and p-values were annotated in figures. Source data

Comment in

References

    1. Watson PA, Arora VK, Sawyers CL. Emerging mechanisms of resistance to androgen receptor inhibitors in prostate cancer. Nat. Rev. Cancer. 2015;15:701–711. - PMC - PubMed
    1. Beltran H, et al. The role of lineage plasticity in prostate cancer therapy resistance. Clin. Cancer Res. 2019;25:6916–6924. - PMC - PubMed
    1. Bishop JL, et al. The master neural transcription factor BRN2 is an androgen receptor–suppressed driver of neuroendocrine differentiation in prostate cancer. Cancer Discov. 2017;7:54–71. - PubMed
    1. Ku SY, et al. Rb1 and Trp53 cooperate to suppress prostate cancer lineage plasticity, metastasis, and antiandrogen resistance. Science. 2017;355:78–83. - PMC - PubMed
    1. Mu P, et al. SOX2 promotes lineage plasticity and antiandrogen resistance in TP53- and RB1-deficient prostate cancer. Science. 2017;355:84–88. - PMC - PubMed

Publication types