. 2022 Sep 6:11:e77877.
doi: 10.7554/eLife.77877.

Structural model of microtubule dynamics inhibition by kinesin-4 from the crystal structure of KLP-12 -tubulin complex

Affiliations

Structural model of microtubule dynamics inhibition by kinesin-4 from the crystal structure of KLP-12 -tubulin complex

Shinya Taguchi et al. Elife. .

Abstract

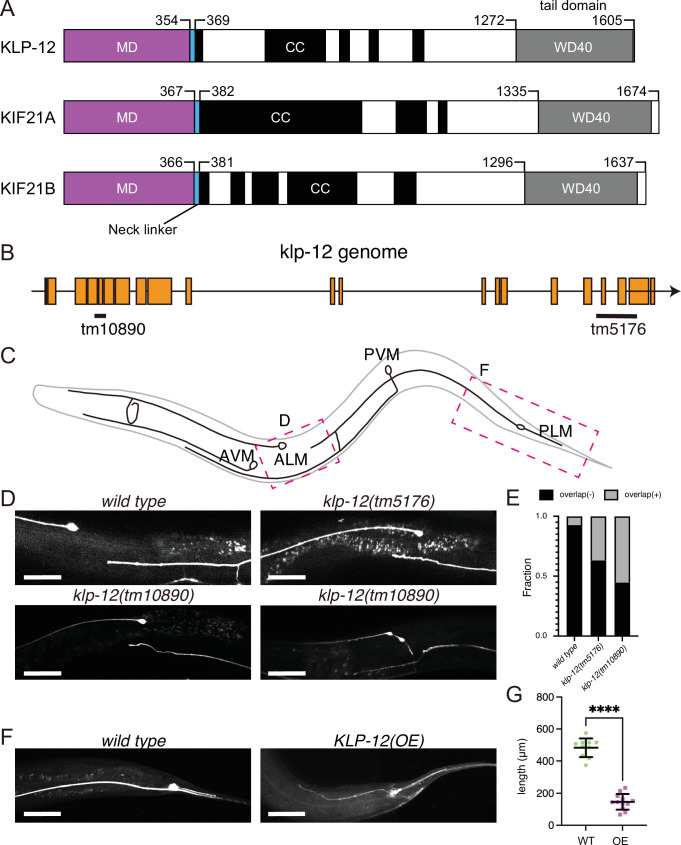
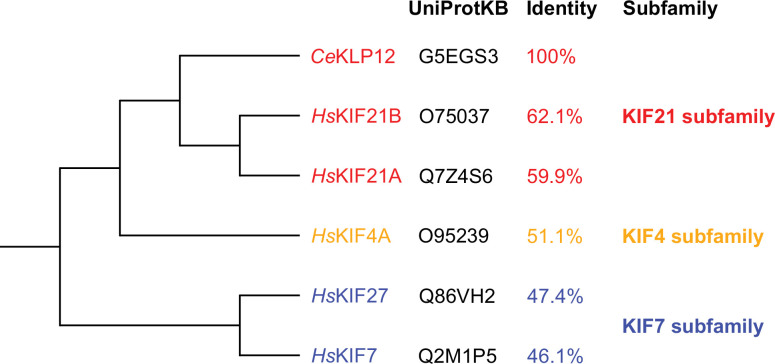
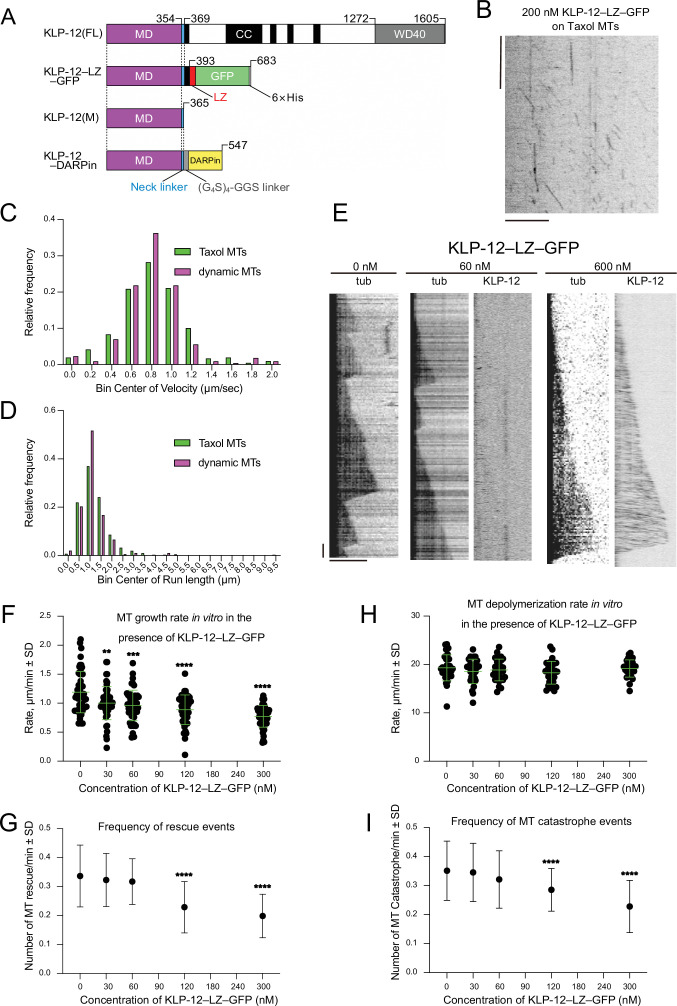
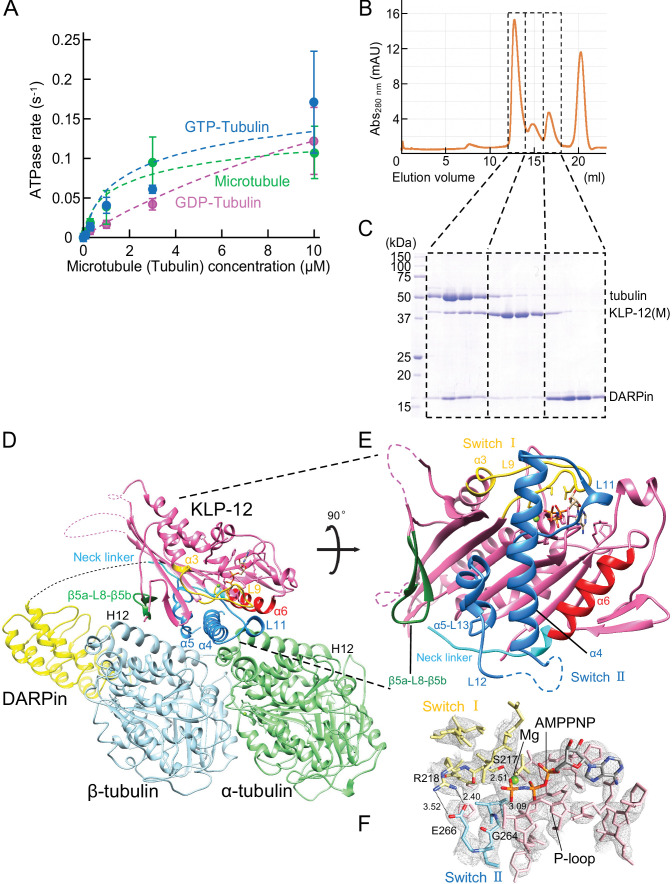
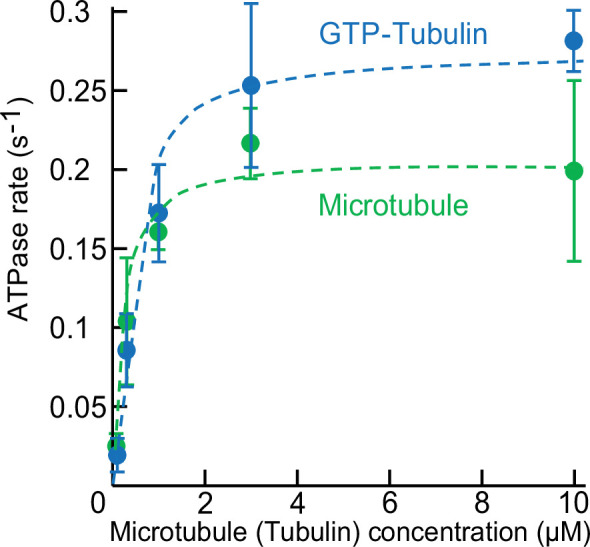
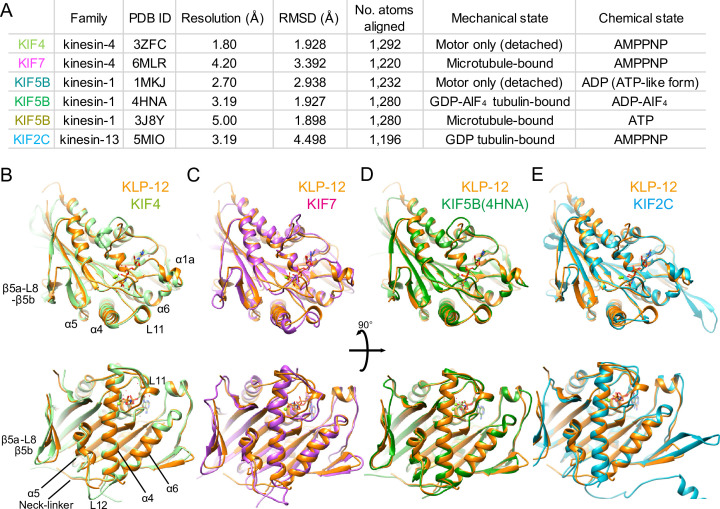
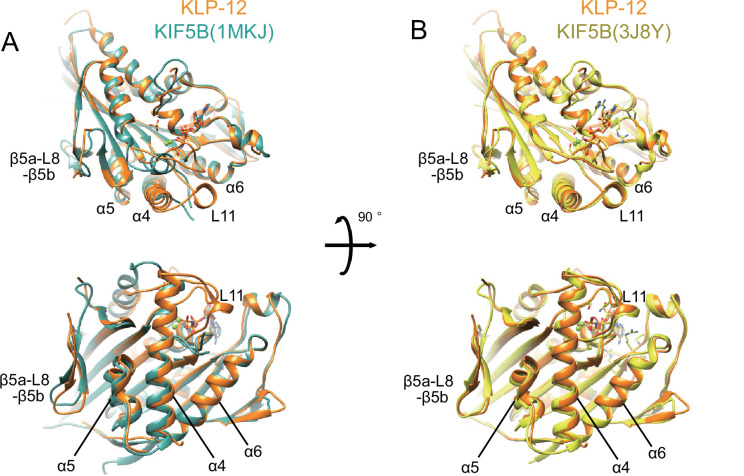
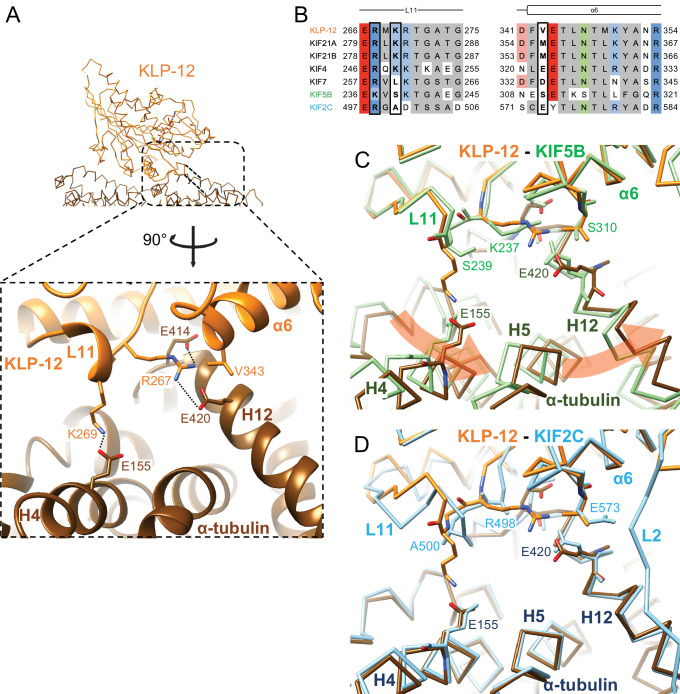
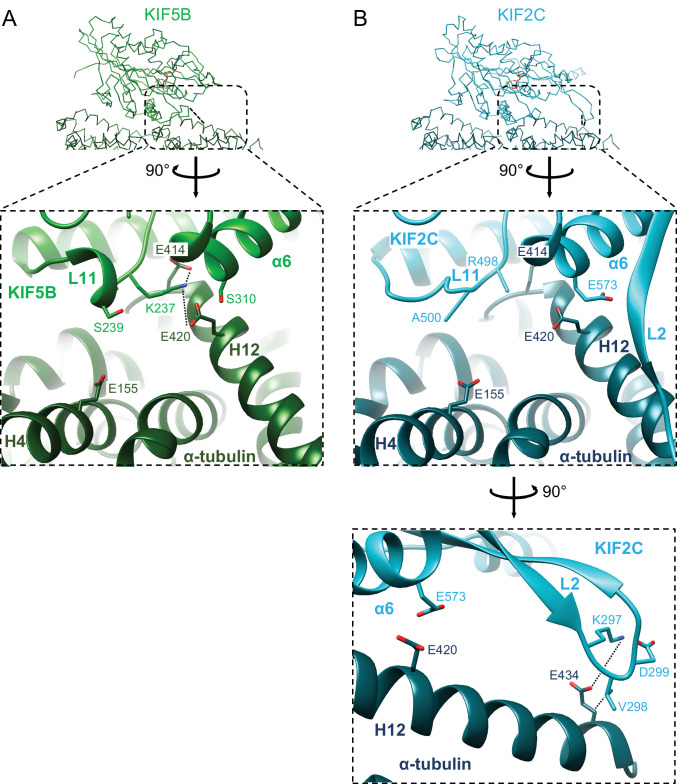
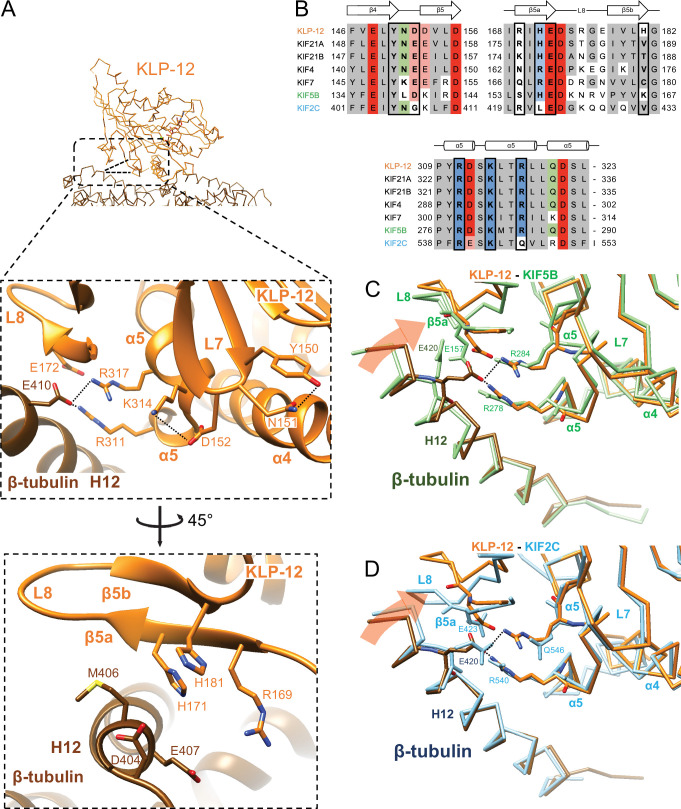
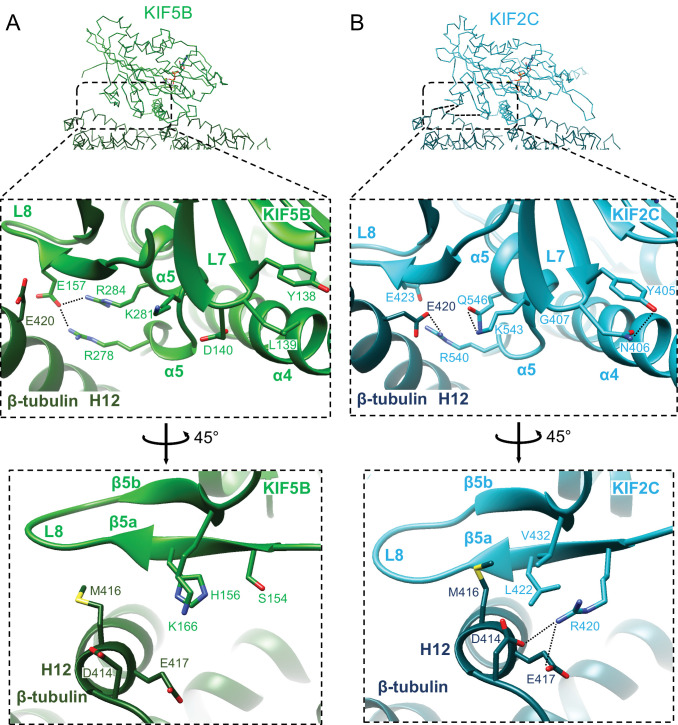
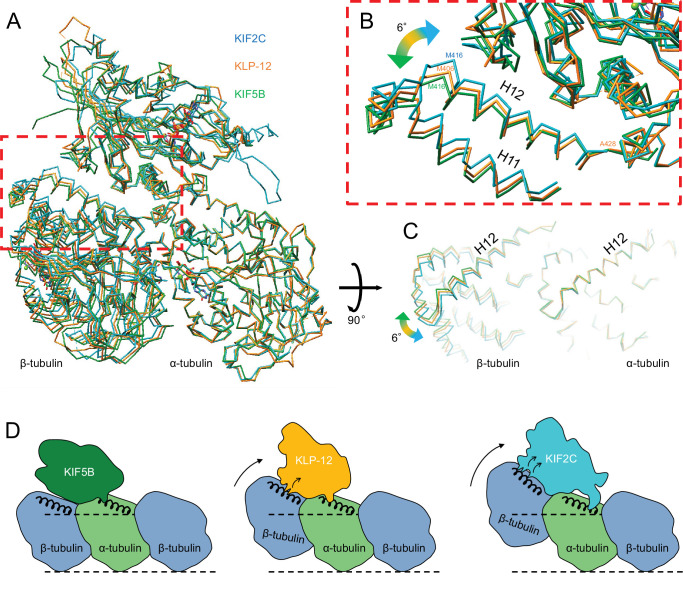
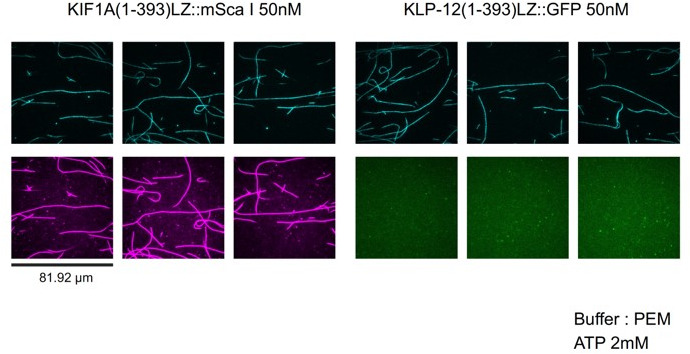
Kinesin superfamily proteins are microtubule-based molecular motors driven by the energy of ATP hydrolysis. Among them, the kinesin-4 family is a unique motor that inhibits microtubule dynamics. Although mutations of kinesin-4 cause several diseases, its molecular mechanism is unclear because of the difficulty of visualizing the high-resolution structure of kinesin-4 working at the microtubule plus-end. Here, we report that KLP-12, a C. elegans kinesin-4 ortholog of KIF21A and KIF21B, is essential for proper length control of C. elegans axons, and its motor domain represses microtubule polymerization in vitro. The crystal structure of the KLP-12 motor domain complexed with tubulin, which represents the high-resolution structural snapshot of the inhibition state of microtubule-end dynamics, revealed the bending effect of KLP-12 for tubulin. Comparison with the KIF5B-tubulin and KIF2C-tubulin complexes, which represent the elongation and shrinking forms of microtubule ends, respectively, showed the curvature of tubulin introduced by KLP-12 is in between them. Taken together, KLP-12 controls the proper length of axons by modulating the curvature of the microtubule ends to inhibit the microtubule dynamics.

Keywords: C. elegans; KIF21A; KIF21B; KLP-12; kinesin-4; microtubule; molecular biophysics; neuroscience; structural biology; tubulin.

Plain language summary

From meter-long structures that allow nerve cells to stretch across a body to miniscule ‘hairs’ required for lung cells to clear mucus, many life processes rely on cells sporting projections which have the right size for their role. Networks of hollow filaments known as microtubules shape these structures and ensure that they have the appropriate dimensions. Controlling the length of microtubules is therefore essential for organisms, yet how this process takes place is still not fully elucidated. Previous research has shown that microtubules continue to grow when their end is straight but stop when it is curved. A family of molecular motors known as kinesin-4 participate in this process, but the exact mechanisms at play remain unclear. To investigate, Tuguchi, Nakano, Imasaki et al. focused on the KLP-12 protein, a kinesin-4 equivalent which helps to controls the length of microtubules in the tiny worm Caenorhabditis elegans. They performed genetic manipulations and imaged the interactions between KLP-12 and the growing end of a microtubule using X-ray crystallography. This revealed that KLP-12 controls the length of neurons by inhibiting microtubule growth. It does so by modulating the curvature of the growing end of the filament to suppress its extension. A ‘snapshot’ of KLP-12 binding to a microtubule at the resolution of the atom revealed exactly how the protein helps to bend the end of the filament to prevent it from growing further. These results will help to understand how nerve cells are shaped. This may also provide insights into the molecular mechanisms for various neurodegenerative disorders caused by problems with the human equivalents of KLP-12, potentially leading to new therapies.


Conflict of interest statement

ST, JN, TI, TK, YS, NS, HS, HO, TS, EN, SK, SM, SN, RN No competing interests declared

Figures

Figure 1.
Figure 1.. KLP-12 is an ortholog of KIF21A and KIF21B that regulates axonal length.
(A) Schematic presentation of the domain organization of the KIF21 subfamily: C. elegans KLP-12, human KIF21A, and KIF21B consist of a motor domain (MD; magenta), neck linker (blue), coiled-coil domains (CC; black), and WD40 domain (WD40; gray). Phylogenetic tree and sequence alignment of kinesin-4 family are available in Figure 1—figure supplement 1 and Figure 1—figure supplement 2, respectively. (B) Schematic presentation of the genomic structure of C. elegans klp-12 and mutant alleles used in this study. tm10890 is a deletion mutant that induces frameshift, whereas tm5176 deletes WD repeats domain. (C) Schematic presentation of the mechanosensory neurons in C. elegans. Areas observed in panels (D) and (F) are shown by magenta boxes. ALM: anterior lateral mechanosensory, AVM: anterior ventral mechanosensory, PLM: posterior lateral mechanosensory, and PVM: posterior ventral mechanosensory neurons. (D and E) The tiling of ALM and PLM neurons. (D) Representative images of ALM and PLM neurons in wild type and klp-12 mutant worms. The axonal tip of PLM neurons does not overlap with the cell body of ALM neurons in wild type, while the axonal tip of PLM neuron overlaps with the ALM cell body in klp-12(tm5176) and klp-12(tm10890) mutant alleles. Bars, 50 µm. (E) The percentage of ALM and PLM overlap in wild-type, klp-12(tm5176), and klp-12(tm10890) mutant alleles in day 3 adult worms. n=55 in wild type, 60 in klp-12(tm5176), and 58 in klp-12(tm10890) worms. (F and G) Overexpression of KLP-12 suppresses the elongation of mechanosensory axon. (F) The morphology of wild type and klp-12-overexpressed PLM neurites. Bar, 50 µm. (G) The lengths of PLM neurites are plotted. Each dots show the length of axons in each worm. Bars represent mean ± standard deviation. n=10 in wild-type and 12 in KLP-12-expressing axons. ****, p<0.0001, Welch’s t test.
Figure 1—figure supplement 1.
Figure 1—figure supplement 1.. Phylogenetic tree of representative kinesin-4 family member motor domains.
This phylogenetic tree was created with reference to Yue et al., 2018. The identities were calculated by SIM (https://web.expasy.org/sim/).
Figure 1—figure supplement 2.
Figure 1—figure supplement 2.. The sequence alignment of kinesin-4 family proteins with KIF5B and KIF2C.
The sequence alignment of kinesin-4 family proteins CeKLP-12, HsKIF21A, HsKIF21B, MmKIF4, MmKIF7, Kinesin-1 family HsKIF5B, and kinesin-13 family HsKIF2C motor domain with the secondary structure of KLP-12(M). Well-conserved residues among Kinesin-4 motors are indicated by coloring. Alignment was generated by Clustal Omega (https://www.ebi.ac.uk/Tools/msa/clustalo/).
Figure 2.
Figure 2.. KLP-12 is a plus-end directed motor that represses microtubule polymerization.
(A) Schematic presentation of the KLP-12 constructs. KLP-12(FL): full-length KLP-12, KLP-12–LZ–GFP: KLP-12 (1-393) with GFP connected with a leucine zipper, KLP-12(M): KLP-12 motor domain (1-365), KLP-12–DARPin: KLP-12(M) with DARPin connected with a flexible linker. (B) A representative kymograph showing the motility of KLP-12–LZ–GFP on taxol-stabilized microtubules. Horizontal and vertical bars show 10 μm and 10 s, respectively. (C) Histogram showing the velocity of KLP-12–LZ–GFP on taxol-stabilized (green) or dynamic (magenta) microtubules. 0.81±0.32 µm/s (n=407) and 0.82±0.31 µm/s (n=215) on taxol-stabilized and dynamic microtubules, respectively. Mean ± standard deviation. No statistically significant differences were detected by Student’s t-test. (D) Histogram showing the run length of KLP-12–LZ–GFP on taxol-stabilized (green) or dynamic (magenta) microtubules. n=407 molecules. 1.30±0.89 µm (n=407) and 1.11±0.57 µm (n=215) on taxol-stabilized and dynamic microtubules, respectively. Mean ± standard deviation. No statistically significant differences were detected by Student’s t-test. (E) Representative kymographs showing the microtubule dynamics and the motility of KLP-12–LZ–GFP. 10 μM of fluorescently labeled microtubules were polymerized from GMPCPP stabilized microtubule seeds fixed on the cover glass in the presence of 0, 60, or 600 nM KLP-12–LZ–GFP at 30 °C. Horizontal and vertical bars show 5 μm and 60 s, respectively. (F–I) The effect of KLP-12–LZ–GFP on microtubule dynamics. 10 μM of fluorescently labeled microtubules were observed in the presence of indicated concentrations of KLP-12–LZ–GFP at 30 °C. (F) Microtubule growth rate in vitro in the presence of KLP-12–LZ–GFP. Green bars show mean ± standard deviation. **, Adjusted p=0.0022, ***, Adjusted p=0.0001, ****, Adjusted p<0.0001, compared with control (0 nM). One-way ANOVA followed by Dunnett’s multiple comparisons test. n=52 microtubules. (G) Frequency of microtubule catastrophe events. The number of microtubule catastrophe in vitro was normalized by minute. mean ± standard deviation. ****, Adjusted p<0.0001, compared with control (0 nM). One-way ANOVA followed by Dunnett’s multiple comparisons test. n=101 microtubules. (H) Microtubule depolymerization rate in vitro in the presence of KLP-12–LZ–GFP. Green bars show mean ± standard deviation. No statistically significant differences were detected by One-Way ANOVA. n=30 microtubules. (I) Frequency of microtubule rescue events. The number of microtubule rescue events in vitro was normalized by minute. ****, Adjusted p<0.0001, compared with control (0 nM). One-way ANOVA followed by Dunnett’s multiple comparisons test. n=99 microtubules. The effect of microtubule growth rate by kinesin-4 family motors is available in Figure 2—figure supplement 1.
Figure 2—figure supplement 1.
Figure 2—figure supplement 1.. The effect of microtubule growth rate by kinesin-4 family motors.
The growth rates of the microtubules were normalized by those of microtubules without kinesin, which was set to the value of 1.0. The vertical axis indicates the ratio of the microtubule growth, and the horizontal axis indicates the kinesin concentration. The current study measures the values of the KLP-12, and the other kinesins were plotted based on the previous studies (Bieling et al., 2010; van der Vaart et al., 2013; Yue et al., 2018). Note that Bieling et al performed the experiment at 28°C ± 1°C (Xklp1), van der Vaart et al (KIF21A), Yue et al (KIF7 and KIF27), and our study was performed at 37 °C.
Figure 3.
Figure 3.. Crystal structure of KLP-12-tubulin complex.
(A) The steady-state ATPase activity of KLP-12(M) measured with GDP tubulin heterodimers, GTP tubulin heterodimers, and microtubules at 30 °C. Error bars represent standard deviation. Tubulin or microtubule GTPase effect was canceled by subtracting control without KLP-12(M). (B) Size exclusion chromatography (SEC) of tubulin mixed with KLP-12(M) and DARPin. (C) SDS–PAGE analysis of the SEC peaks of tubulin mixed with KLP-12(M) and DARPin. SDS-PAGE analysis of the SEC peaks of tubulin combined with KLP-12–DARPin is available in Figure 3—figure supplement 2. (D) Crystal structure of the tubulin–KLP-12–DARPin complex. Disordered linkers were drawn as a dotted line. α-tubulin is colored in light green, β-tubulin is in light blue, DARPin is in yellow, and KLP-12 is in magenta. See also Video 1 for details. (E) KLP-12 structure viewed from the interface with tubulin. The residues of the important structure are shown in color. β5a-L8-β5b is green, switch I is yellow, switch II is blue, α6 is red, and the neck linker is cyan. (F) Nucleotide binding pocket of KLP-12. The 2Fo-Fc map around AMP-PNP was calculated with coefficient 2Fo− Fc and contoured at 2.0 σ.
Figure 3—figure supplement 1.
Figure 3—figure supplement 1.. ATPase activity of KLP-12–LZ–GFP with microtubule or GTP-Tubulin.
The steady-state ATPase activity of KLP-12–LZ–GFP was measured with microtubules or GTP tubulin heterodimers at 30 °C. Error bars represent standard deviation. KM,microtubules and KM,GTP-tubulin was 0.272 μM and 0.753 μM,.
Figure 3—figure supplement 2.
Figure 3—figure supplement 2.. The complex formation of KLP-12–DARPin and tubulin dimers.
(A) Size exclusion chromatography (SEC) of tubulin mixed with KLP-12–DARPin. (B) SDS-PAGE analysis of the SEC peaks.
Figure 4.
Figure 4.. Structural comparison of KLP-12 motor domain with the other kinesins.
(A) Structural comparison of KLP-12 with the other reported kinesin motor domain structures in various states. (B) Superimposition of KLP-12 and KIF4 (Light green). (C) Superimposition of KLP-12 and KIF7 (Pink). (D) Superimposition of KLP-12 and KIF5B (Green). (E) Superimposition of KLP-12 and KIF2C (Cyan).
Figure 4—figure supplement 1.
Figure 4—figure supplement 1.. Structural comparison of KLP-12 motor domain with KIF5B structures.
(A) Superimposition of KLP-12 and motor only structure of ADP state KIF5B (Dark green). (B) Superimposition of KLP-12 and KIF5B (Yellow) bound to microtubule.
Figure 5.
Figure 5.. Microtubule binding interface of kinesin-4 KLP-12 at α-tubulin.
(A) KLP-12 Arg267 and Lys269 in loop L11 interact with α-tubulin Glu414 and Glu420 in helix H12 and Glu155 in helix H4, respectively. See Video 2 for detail. The interfaces of KIF5B and KIF2C at α-tubulin are available in Figure 4—figure supplement 1. (B) Sequence alignment of the kinesin-4, KIF5B, and KIF2C residues at the interacting area. Interacting residues are marked by squares. (C) Superimposition of Cα chain trace models of the KLP-12 complex (orange) and KIF5B complex (green) at kinesin. The rotation direction of α-tubulin between KLP-12 and KIF5B at helices H4, H5, and H12 is illustrated as a red arrow. (D) Superimposition of Cα chain trace models of the KLP-12 complex (orange) and KIF2C complex (cyan) at kinesin.
Figure 5—figure supplement 1.
Figure 5—figure supplement 1.. Microtubule binding interface of KIF5B and KIF2C at α-tubulin.
(A) KIF5B Lys237 in L11 interacts with α-tubulin Glu414 and Glu420 in H12. (B) KIF2C Lys297 and Val298 in loop L2 KVD motif interact with α-tubulin Glu434 in H12. Arg498 was modeled as alanine in the reported structure (PDB ID: 5MIO). KVD motif residues Lys297, Val298, and Asp299 are displayed.
Figure 6.
Figure 6.. Microtubule binding interface of kinesin-4 KLP-12 at β-tubulin helix H12.
(A) Close-up display of KLP-12 and β-tubulin interaction around β-tubulin helix H12 from the same view as upper panel (middle panel) and 45° rotated view (bottom panel). Glu410 of β-tubulin H12 interacts with Arg311 and Arg317 of KLP-12 helix α5. Tyr150 and Asn151 of KLP-12 form intramolecular interactions. See Video 3 for detail. The interfaces of KIF5B and KIF2C at β-tubulin are available in Figure 5—figure supplement 1. (B) Sequence alignment with the secondary structure of the kinesin-4, KIF5B, and KIF2C residues at the interacting area. (C) Superimposition of Cα chain trace models of the KLP-12 complex (orange) and KIF5B complex (green) at kinesin around β-tubulin H12. (D) Superimposition of Cα chain trace models of the KLP-12 complex (orange) and KIF2C complex (cyan) at kinesin around β-tubulin H12.
Figure 6—figure supplement 1.
Figure 6—figure supplement 1.. Microtubule binding interface of KIF5B and KIF2C at β-tubulin helix H12.
(A) KIF5B and β-tubulin interface. Glu420 (bovine Glu420 corresponds to Glu410 of porcine) of β-tubulin H12 has no interaction with KIF5B; instead, KIF5B Glu157 forms an intramolecular interaction with Arg278 and Arg284 of KIF5B α5. (B) KIF2C and β-tubulin interaction. Glu420 (bovine Glu420 corresponds to Glu410 of porcine) of β-tubulin H12 interacts with Arg540 of KIF2C α5. Tyr405 and Asn406 of KIF2C form intramolecular interactions. In addition, KIF2C Arg420, which is supported by Leu422, interacts with Asp414 and Glu417 of β-tubulin H12.
Figure 7.
Figure 7.. Microtubule plus-end control mechanism by kinesin-4.
(A) Superimposition of KLP-12, KIF5B, and KIF2C complexes at α-tubulin. See Video 4 for detail. (B) Close-up view of superimposed models at the β-tubulin interaction surface. (C) Tubulin dimer interface view from kinesin side. (D) Models of the microtubule plus-end curving mechanism by kinesins. The kinesin-1 family protein KIF5B does not affect the curvature of microtubules to maintain the conformation of GTPs. Kinesin-4 family protein KLP-12 slightly curves the plus-end by interacting with the mid-portion of β-tubulin H12 to stabilize the plus-end. Kinesin-13 family protein KIF2C strongly curves plus-end by interacting with the N-terminal portion of β-tubulin H12 to destabilize the microtubule.
Author response image 1.

Similar articles

Cited by

References

    1. Ahmad S, Pecqueur L, Dreier B, Hamdane D, Aumont-Nicaise M, Plückthun A, Knossow M, Gigant B. Destabilizing an interacting motif strengthens the association of a designed ankyrin repeat protein with tubulin. Scientific Reports. 2016;6:28922. doi: 10.1038/srep28922. - DOI - PMC - PubMed
    1. Al-Bassam J. Reconstituting dynamic microtubule polymerization regulation by TOG domain proteins. Methods in Enzymology. 2014;540:131–148. doi: 10.1016/B978-0-12-397924-7.00008-X. - DOI - PubMed
    1. Barrett JC, Hansoul S, Nicolae DL, Cho JH, Duerr RH, Rioux JD, Brant SR, Silverberg MS, Taylor KD, Barmada MM, Bitton A, Dassopoulos T, Datta LW, Green T, Griffiths AM, Kistner EO, Murtha MT, Regueiro MD, Rotter JI, Schumm LP, Steinhart AH, Targan SR, Xavier RJ, Libioulle C, Sandor C, Lathrop M, Belaiche J, Dewit O, Gut I, Heath S, Laukens D, Mni M, Rutgeerts P, Van Gossum A, Zelenika D, Franchimont D, Hugot J-P, de Vos M, Vermeire S, Louis E, Cardon LR, Anderson CA, Drummond H, Nimmo E, Ahmad T, Prescott NJ, Onnie CM, Fisher SA, Marchini J, Ghori J, Bumpstead S, Gwilliam R, Tremelling M, Deloukas P, Mansfield J, Jewell D, Satsangi J, Mathew CG, Parkes M, Georges M, Daly MJ, NIDDK IBD Genetics Consortium. Belgian-French IBD Consortium. Wellcome Trust Case Control Consortium Genome-wide association defines more than 30 distinct susceptibility loci for Crohn’s disease. Nature Genetics. 2008;40:955–962. doi: 10.1038/ng.175. - DOI - PMC - PubMed
    1. Bianchi S, van Riel WE, Kraatz SHW, Olieric N, Frey D, Katrukha EA, Jaussi R, Missimer J, Grigoriev I, Olieric V, Benoit RM, Steinmetz MO, Akhmanova A, Kammerer RA. Structural basis for misregulation of kinesin KIF21A autoinhibition by CFEOM1 disease mutations. Scientific Reports. 2016;6:30668. doi: 10.1038/srep30668. - DOI - PMC - PubMed
    1. Bieling P, Telley IA, Surrey T. A minimal midzone protein module controls formation and length of antiparallel microtubule overlaps. Cell. 2010;142:420–432. doi: 10.1016/j.cell.2010.06.033. - DOI - PubMed

Publication types