

Vesalius: high-resolution in silico anatomization of spatial transcriptomic data using image analysis
- PMID: 36065846
- PMCID: PMC9446088
- DOI: 10.15252/msb.202211080
Vesalius: high-resolution in silico anatomization of spatial transcriptomic data using image analysis
Abstract
Characterization of tissue architecture promises to deliver insights into development, cell communication, and disease. In silico spatial domain retrieval methods have been developed for spatial transcriptomics (ST) data assuming transcriptional similarity of neighboring barcodes. However, domain retrieval approaches with this assumption cannot work in complex tissues composed of multiple cell types. This task becomes especially challenging in cellular resolution ST methods. We developed Vesalius to decipher tissue anatomy from ST data by applying image processing technology. Vesalius uniquely detected territories composed of multiple cell types and successfully recovered tissue structures in high-resolution ST data including in mouse brain, embryo, liver, and colon. Utilizing this tissue architecture, Vesalius identified tissue morphology-specific gene expression and regional specific gene expression changes for astrocytes, interneuron, oligodendrocytes, and entorhinal cells in the mouse brain.
Keywords: anatomical territories; spatial domains; spatial transcriptomics; tissue architecture; tissue heterogeneity.
© 2022 The Authors. Published under the terms of the CC BY 4.0 license.
Figures

- A
Vesalius embeds ST data into RGB‐colored images. This is achieved by preprocessing ST data and reducing dimensionality. In parallel, punctual ST coordinates are converted into tiles. Finally, the UMAP latent space (or PCA loading values) is transformed into an RGB color space, and the color code attributed to each barcode is assigned to its respective tile.
- B
Vesalius applies image analysis techniques to RGB images describing the transcriptional landscape of a tissue with the aim of isolating tissue territories.
- C
Vesalius enables a territory‐based ST framework including spatial territory clustering, territory comparison, tissue border expression, and morphology‐driven expression.

- A
Adjusted Rand Index score between Vesalius, BayesSpace, Giotto, Seurat, STAGATE, SpaGCN, and SEDR. Overall, Vesalius outperforms other tools in retrieving spatial domains in high‐resolution simulated data sets (Kruskal–Wallis and star notation using Wilcoxon rank‐sum test for the multiple comparisons with n = 10 simulation replicates).
- B
The high performance of Vesalius compared with competitors is also highlighted using the variation of information score, which is more robust against cluster granularity. Boxplot shows VI scores over 10 simulation replicates (Kruskal–Wallis and star notation using Wilcoxon rank‐sum test for the multiple comparisons with n = 10 simulation replicates).
- C
Vesalius has the lowest run time among spatial domain tools with a run time 3–20 times lower than competing tools (Kruskal–Wallis and star notation using Wilcoxon rank‐sum test for the multiple comparisons with n = 80 simulation replicates).
- D
Example of simulated ground truth and prediction by each tool in four simulated regimes (Dotted, Exponential, Pure, and Uniform). The label above each plot describes the simulation run in the following format Tool–Regime–Number of territories–Number of cells–Simulation replicate. For example, Vesalius Uni 3 3 1 describes Vesalius's prediction in the uniform regime, which contains three territories each with three cell types in replicate 1.

- A
Vesalius accurately recovers tissue territories in Slide‐seqV2 data taken from the mouse hippocampus and surrounding brain (Puck_200115_08). A comparison with the Allen Brain Atlas reference atlas illustrates that Vesalius recovers many structures such as the dentate gyrus, corpus callosum, and the CA field.
- B
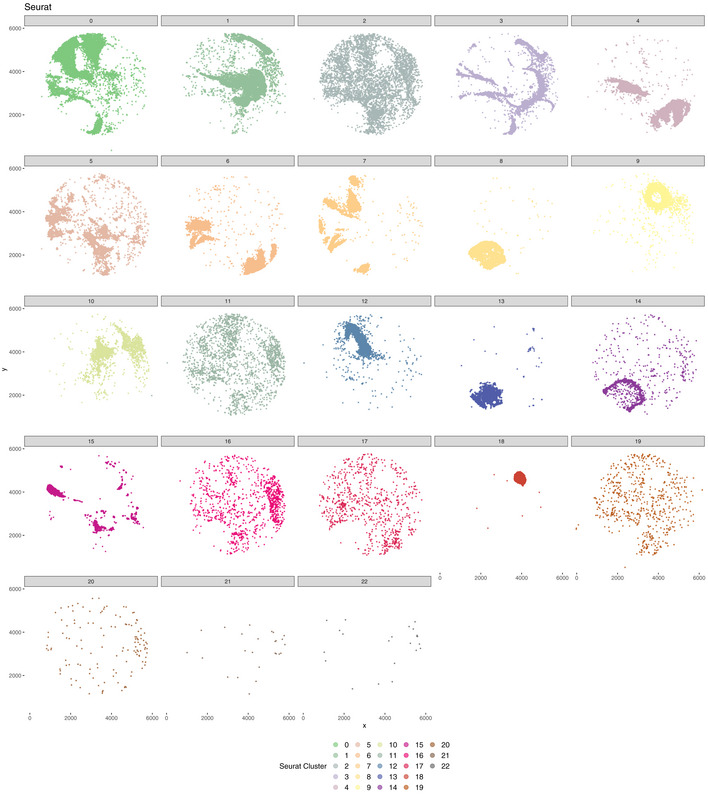
BayesSpace and Seurat applied to the same data set recover structures insofar as these structures contain homogenous cell populations. The identified clusters are dispersed over the entire tissue section and thus do not represent a clear tissue territory.
- C
Vesalius recovered uniform tissue territories in the mouse embryo (Slide‐seqV2—Puck_190926_03). The microscopy image highlights the section of the embryo used to produce Puck_190926_03 (image taken from Slide‐seq V2; Stickels et al, 2021).
- D
BayesSpace and Seurat recover structures insofar as these structures contain homogenous cell populations. The identified clusters are dispersed over the entire tissue section and thus do not represent a clear tissue territory.
- E
Vesalius identified tissue territory using Seq‐Scope early‐onset liver failure (Sample 2117). Vesalius highlights various hepatocyte populations such as pericentral hepatocytes (Hep. PC), periportal hepatocytes (Hep. PP), and injured hepatocytes (Injured Hep.).
- F
Vesalius identified tissue territory using Seq‐Scope in healthy colon (Sample 2111). Territory isolation in the colon shows various structures and layers including the smooth muscle, the crypt surface, and the crypt base.
- G
Vesalius recovers tissue territories in seqFISH data in mouse embryo (right) and can distinguish between different brain regions compared with the single‐cell annotation (left).
- H–J
In low‐resolution Visium 10X data sets, Vesalius accurately recovers tissue territories in a broad range of tissue such as mouse brain (H), mouse kidney (I), and human breast cancer (J).

- A
Mapping of clustered barcodes in the isolated CA field. Vesalius recovers all 3 CA pyramidal layers.
- B
CA2 pyramidal layer was enriched with, among others, Pcp4, a canonical CA2 layer marker. The ISH image taken from the Allen Brain Atlas corroborates the positioning of the CA2 layer within the isolated CA field.
- C
Pcp4 expression within the CA2 layer is lost in favor of stronger expression in the thalamus.
- D
The isolated medial habenula and third ventricle show distinct spatial compartments after barcode clustering.
- E
ISH image describing a medial habenula lower compartment marker (Gabbr2) and a medial habenula upper compartment marker (Calb2). The medial habenula is highlighted in red.
- F
ISH images of lower third ventricle marker (Nnat) and upper third ventricle marker (Enpp2).
- G
Barcode clustering and mapping of the embryonic eye (E12.5) show that Anterior Lens Epithelial cells and Lens Vesicle cells are separated into distinct layers.
- H
Differential gene expression analysis between Anterior Lens Epithelial Cell layers revealed that the expression of Cryba4 was restricted to the inner layer while Cnnd2 was expressed in the outer layer. Similarly, Pmel was expressed in the outer Lens Vesicle cell layer and Aldh1a1 was expressed in the inner layer.

- A
Differential gene expression analysis between cells contained in the cortex and the thalamus shows that spatial location influences gene expression. Astrocytes in the cortex are enriched with Cpe, while entorhinal cells in the thalamus are enriched with Nrgn.
- B
Barcode clustering of the isolated dentate gyrus reveals transcriptional dissimilarity between each dentate gyrus (DG) layer.
- C
Differential gene expression analysis between DG Granule cell layer and DG sub‐granular zone displayed a high expression of Cst3 and Apoe at the border between layers. Cst3 and Apoe border expression is corroborated by Allen brain Atlas ISH images.
- D
Layered expression pattern of Stmn4 and Kif5a within the isolated corpus callosum showed a higher expression at the center of the corpus callosum. ISH images corroborate the spatial expression pattern of both genes. Corpus callosum contained within red lines.

- A
Vesalius converts the transcriptome of cells by using a normalized latent space (either UMAP or PCA) and using embedding values as RGB color values.
- B
After image segmentation, Vesalius further isolates territories by pooling barcodes that are close to each other in 2D space. Vesalius finds all barcodes that are within a capture distance of each other (represented by red circle) and assigns a unique territory to all these barcodes. The same process is applied to all beads of that color segment until all beads have been pooled into a distinct spatial territory.
- C
Simulation regimes used to benchmark Vesalius in high‐resolution ST data. The pure regime only contains one cell type per territory. The uniform regime contains n different cell types in equal proportion in each territory. The exponential regime contains n cell types in varying proportions between territories. The cell types are the same between territories. The dotted regime is made of a background territory with five circular territories of random size. The number of cell types between each territory is also randomized. Circular territories may overlap.
- D
Territory layering uses images representation of territory to iteratively select the edge of a territory and assign a layer value to that edge. Once all barcodes have been assigned to a layer, the number of layers can be reduced by merging neighboring layers.


References
-
- Barthelmé S, Tschumperlé D (2019) Imager: an R package for image processing based on CImg. J Open Source Softw 4: 1012
-
- Burgess DJ (2019) Spatial transcriptomics coming of age. Nat Rev Genet 20: 317 - PubMed
Publication types
MeSH terms
LinkOut - more resources
Full Text Sources
