. 2023 Jan 2;35(1):218-238.
doi: 10.1093/plcell/koac243.

BREEDIT: a multiplex genome editing strategy to improve complex quantitative traits in maize

Affiliations

BREEDIT: a multiplex genome editing strategy to improve complex quantitative traits in maize

Christian Damian Lorenzo et al. Plant Cell. .

Erratum in

Abstract

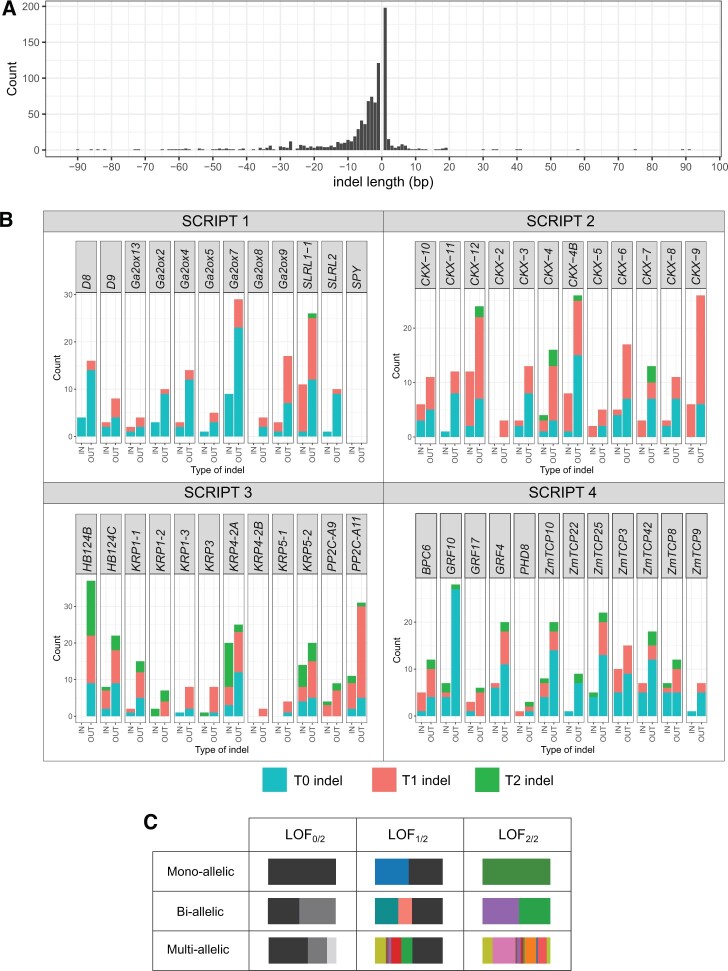
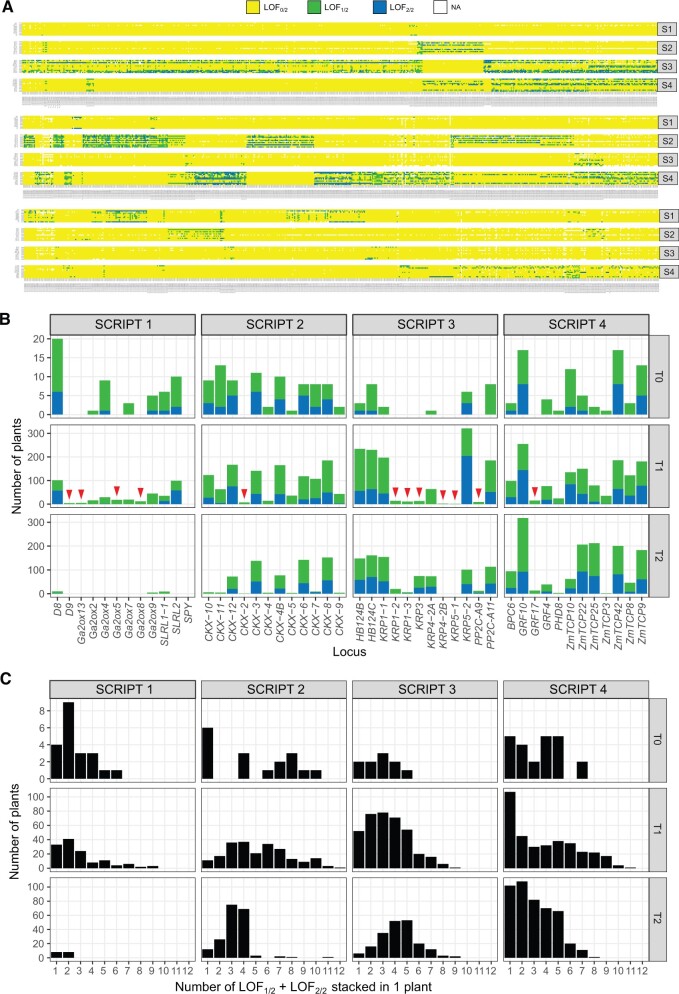
Ensuring food security for an ever-growing global population while adapting to climate change is the main challenge for agriculture in the 21st century. Although new technologies are being applied to tackle this problem, we are approaching a plateau in crop improvement using conventional breeding. Recent advances in CRISPR/Cas9-mediated gene engineering have paved the way to accelerate plant breeding to meet this increasing demand. However, many traits are governed by multiple small-effect genes operating in complex interactive networks. Here, we present the gene discovery pipeline BREEDIT, which combines multiplex genome editing of whole gene families with crossing schemes to improve complex traits such as yield and drought tolerance. We induced gene knockouts in 48 growth-related genes into maize (Zea mays) using CRISPR/Cas9 and generated a collection of over 1,000 gene-edited plants. The edited populations displayed (on average) 5%-10% increases in leaf length and up to 20% increases in leaf width compared with the controls. For each gene family, edits in subsets of genes could be associated with enhanced traits, allowing us to reduce the gene space to be considered for trait improvement. BREEDIT could be rapidly applied to generate a diverse collection of mutants to identify promising gene modifications for later use in breeding programs.


Figures

Figure 1
Figure 1
The multiplex gene editing strategy of BREEDIT. A, Selection of GRGs based on published and in-house research performed in Arabidopsis, rice, or maize. B, After gene selection, gRNAs with NGG protospacer adjacent motif (PAM) sites are selected for each gene, and PCR primer pairs are designed to resequence gRNA target sites and flanking regions via HiPlex amplicon sequencing. For each gene, the best set of gRNAs and flanking primer pairs is selected. Twelve gRNAs are cloned in multiplex gene editing vectors named SCRIPTs. Next, the SCRIPT constructs are transformed in a Cas9-expressing maize line named EDITOR. C, Vigorous T0 plants containing the SCRIPT (BASTA resistant) and the Cas9 EDITOR construct (hygromycin resistant) are further genotyped using HiPlex amplicon sequencing. Based on the genotypes, plants are selected for crossing with B104 (BC: backcross), with plants with complementary mutations caused by the same SCRIPT (intra-script crosses), or with plants containing a different SCRIPT and therefore mutations in genes from a different family or pathway (inter-script crosses). These crosses aim at maximizing the mutation landscape and diversity. Finally, self-crosses (S) of lines generate a segregating progeny for high-throughput phenotyping of selected traits, which later can be associated with (combinations of) genes. D, From continuous read depth to discrete LOF genotypic classes. Sequencing reads are mapped to the B104 reference loci. Two read categories are derived, namely haplotypeREF and haplotypeKO. HaplotypeREF corresponds to the aggregated fraction of reads containing only SNPs, in-frame indels, or the reference haplotype. HaplotypeKO refers to the aggregated fraction of reads with out-of-frame indels. A tri-modal distribution is expected for haplotypeKO, with local maxima around 0%, 50%, and 100%, each corresponding to a fraction of the genome being edited at the locus. HaplotypeKO is therefore divided into three classes of LOF: LOF0/2 (the genome is not edited with out-of-frame indels, i.e. 0 chromosome out of two in a diploid organism), LOF1/2 (half of the genome is edited with out-of-frame indels, i.e. one chromosome out of two in a diploid organism), LOF2/2 (the whole genome is edited with out-of-frame indels, i.e. two chromosomes out of two in a diploid organism).
Figure 2
Figure 2
Diversity of mutated haplotypes obtained after CRISPR/Cas9 genome editing. A, Distribution of indel length. B, Number of different haplotypes with indels first observed at T0, T1, and T2. Any haplotype with indels with >1% relative frequency in the sequencing reads per locus per sample is included. IN, in-frame indel; OUT, out-of-frame indel. C, Different haplotype combinations in plants can all lead to a gene LOF, either partial (LOF1/2) or complete (LOF2/2). Each colored horizontal stacked bar corresponds to a different haplotypeKO. The bar’s length is proportional to the fraction of sequencing reads per locus containing the haplotypeKO. The black fraction corresponds to the aggregation of alleles assigned to the wild-type haplotype (haplotypeREF). For an overview of the different haplotypeKO found in T0 plants harboring the different SCRIPTs, see Supplemental Figure S5.
Figure 3
Figure 3
Distribution of LOF in genes across the entire set of samples. Only haplotypeKO were considered for genotype calling. The fractions of reads containing haplotypeKO were summed per sample per locus. A, Overview of the classes LOF0/2, LOF1/2, or LOF2/2 obtained in the entire sample set for the four SCRIPTS (S1–S4). Samples are on the x-axis and are distributed over three rows. B, Distributions of LOF1/2 and LOF2/2 across the four SCRIPTs throughout the generations. The top, middle, and bottom panels show T0, T1, and T2 plants, respectively. Triangles indicate new LOFs that appeared at T1. C, Stacking LOFs at multiple genes within plants.
Figure 4
Figure 4
Phenotypes observed in multiple gene-edited populations of SCRIPT 1 and SCRIPT 4. A, B and F, G, Measurements of final length of leaf 3 (FLL3) (A, F) and final leaf width (FLW3) (B, G) of gene-edited SCRIPT 1 (A, B) and SCRIPT 4 (F, G) individuals compared with the EDITOR 1 background control. For each SCRIPT, data correspond to independent multiple gene-edited populations assayed on two different independent experiments under WW conditions. On the distributions, each dot represents one individual and is colored according to the amount of partial (LOF1/2) and complete (LOF2/2) LOF observed in that individual. The more orange, the higher the LOF in the individual. A pairwise Student’s t-test was conducted between the EDITOR 1 control and mutated populations. Significant differences are displayed with P-values summarized as follows: **P < 0.01, ***P < 1e−3, ****P < 1e−4. Box plot borders represent the first and third quartiles, the middle line represents the median, and whiskers represent the maximal and minimum values. Diamonds indicate the means of each distribution. C-E and H, I, Photographs of general plant architecture (C for SCRIPT 1 and H for SCRIPT 4) and final leaf 3 (D for SCRIPT 1 and I for SCRIPT 4) compared with the EDITOR 1 (ED1) background.
Figure 5
Figure 5
Aggregated association analysis of single-gene LOF and traits. Summaries of single-gene associations to traits are represented for SCRIPT 1 (A), SCRIPT 2 (B), SCRIPT 3 (C), and SCRIPT 4 (D). Single-gene associations were performed per population, in each phenotypic experiment and for all measured traits. Results are summarized per gene, per trait with two indices. (1) Observation: the number of times a given gene has been observed in a situation with sufficient genotypic and phenotypic data across populations and experiments. An observation with sufficient data corresponds to a situation where a gene displays at least one LOF group between LOF1/2 and LOF2/2 represented by at least six individuals with phenotypic information for a specific trait. In such cases, the mean phenotypic value of each genotypic group could be statistically compared with that of the EDITOR 1 control. (2) Strength: for each gene, we calculated the weighted sum of observations in which the genotypic group with the highest mean phenotypic value is 10% above (weight: +1) or below (weight: −1) the mean phenotypic value of the EDITOR 1 control. The resulting sum was divided by the total number of observations (n). Associations displaying highest strength, either positive or negative, along with a large total number of observations indicate strong evidence for the effect of a gene on the trait.
Figure 6
Figure 6
LOF dosages in D8 and leaf shape parameters. A, Haplotype profiles at gene D8 of T1 segregants from population P012. Three haplotypes were detected, with two containing out-of-frame indels (−1 bp and +1 bp) and one containing an in-frame (−3 bp) deletion. This results in a collection of plants with D8 either partially (LOF1/2) or completely (LOF2/2) knocked out. The resulting two classes of LOF dosages are compared with the EDITOR 1 control for final leaf length 3 (B) and final leaf width 3 (C). Significant differences (pairwise Student’s t- test) are displayed with P-values summarized as follow: ****P < 1e−4, ns: not-significant. Box plot borders represent the first and third quartiles, the middle line represents the median, and whiskers represent the maximal and minimum values. Triangles indicate the mean of each distribution.
Figure 7
Figure 7
Network representation of single-gene effects on growth-related traits. Traits are displayed in bold (FLL, final leaf length; FLW, final leaf width; and M, moisture content). Genes associated at least once with a trait are displayed. Lines indicate connections between genes and traits. Line width is proportional to the number of times the underlying dataset to detect a gene KO–trait association in different experiments and/or populations contained sufficient data for statistics (i.e. a minimum of one LOF class between LOF1/2 and LOF2/2 with at least six individuals with phenotypic information). Line color represents the weighted fraction of gene KO–trait associations that significantly outperformed the EDITOR 1 control by 10% (ANOVA test; P < 5%), either positively (weight: +1, more red) or negatively (weight: −1, more blue), over the number of times a gene KO–trait association could have been observed due to sufficient data points.

Comment in

References

    1. Aesaert S, Impens L, Coussens G, Van Lerberge E, Vanderhaeghen R, Desmet L, Vanhevel Y, Bossuyt S, Wambua AN, Van Lijsebettens M, et al. (2022) Optimized transformation and gene editing of the B104 public maize inbred by improved tissue culture and use of morphogenic regulators. Front Plant Sci 13: 883847. - PMC - PubMed
    1. Anzalone AV, Koblan LW, Liu DR (2020) Genome editing with CRISPR-Cas nucleases, base editors, transposases and prime editors. Nat Biotechnol 38: 824–844 - PubMed
    1. Ashikari M, Sakakibara H, Lin S, Yamamoto T, Takashi T, Nishimura A, Angeles ER, Qian Q, Kitano H, Matsuoka M (2005) Cytokinin oxidase regulates rice grain production. Science 309: 741–745 - PubMed
    1. Bai M, Yuan J, Kuang H, Gong P, Li S, Zhang Z, Liu B, Sun J, Yang M, Yang L, et al. (2020) Generation of a multiplex mutagenesis population via pooled CRISPR-Cas9 in soya bean. Plant Biotechnol J 18: 721–731 - PMC - PubMed
    1. Bartrina I, Otto E, Strnad M, Werner T, Schmülling T (2011) Cytokinin regulates the activity of reproductive meristems, flower organ size, ovule formation, and thus seed yield in Arabidopsis thaliana. Plant Cell 23: 69–80 - PMC - PubMed

Publication types