. 2022 Oct 17;82(20):3845-3857.
doi: 10.1158/0008-5472.CAN-21-4140.

Inhibition of EGFR Overcomes Acquired Lenvatinib Resistance Driven by STAT3-ABCB1 Signaling in Hepatocellular Carcinoma

Affiliations

Inhibition of EGFR Overcomes Acquired Lenvatinib Resistance Driven by STAT3-ABCB1 Signaling in Hepatocellular Carcinoma

Beiyuan Hu et al. Cancer Res. .

Abstract

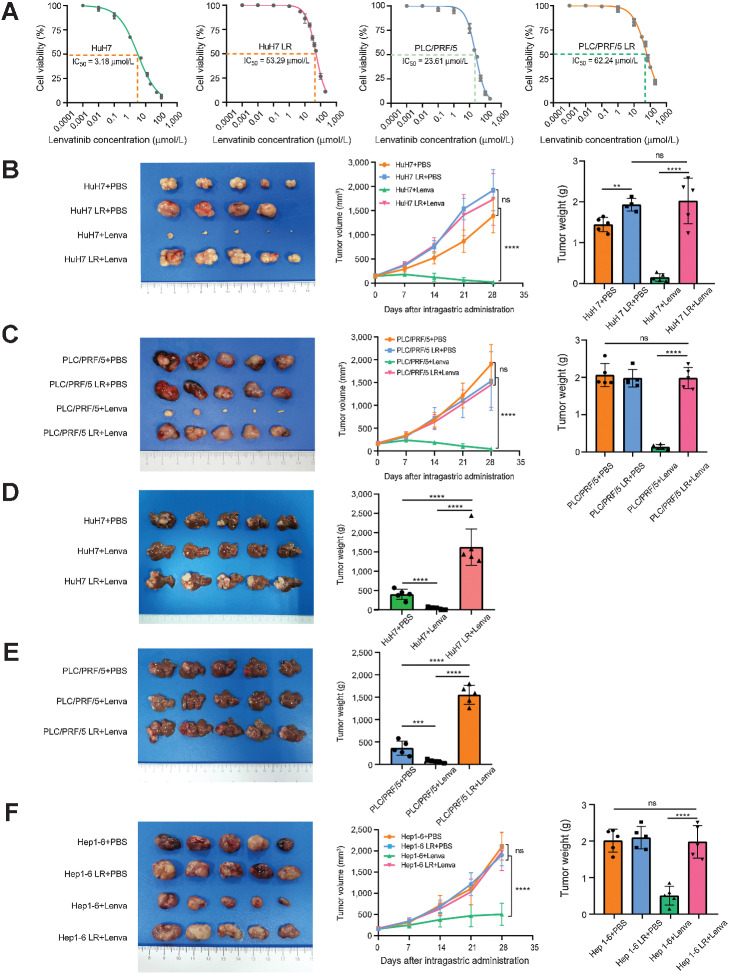
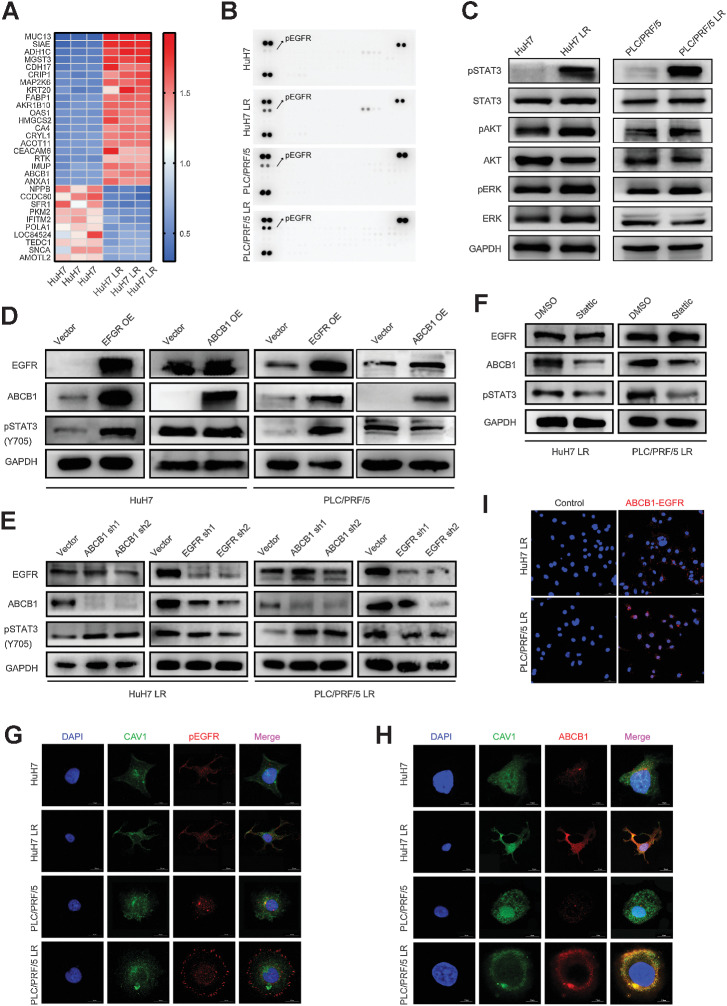
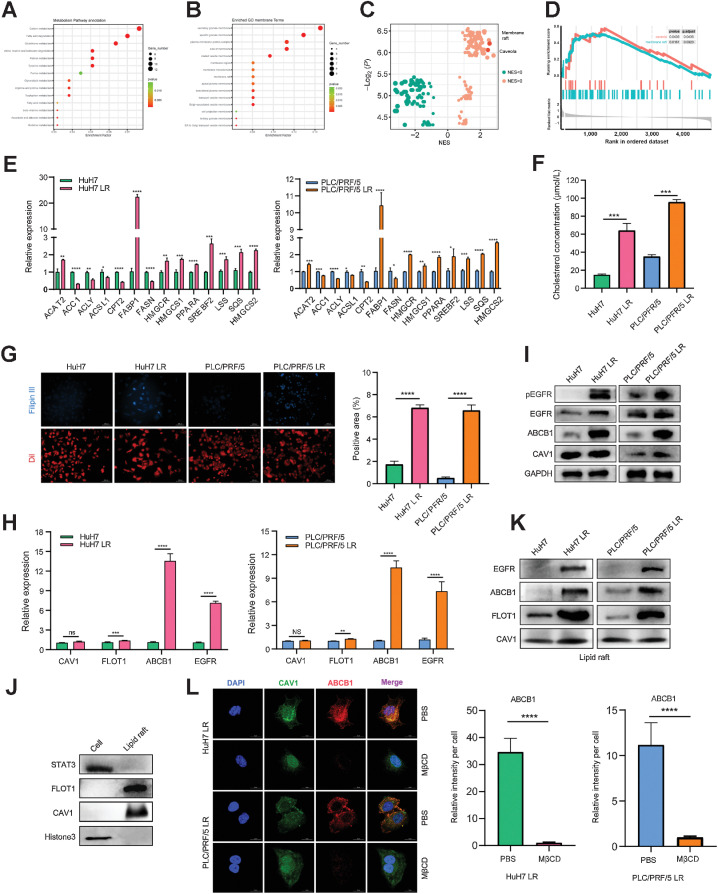
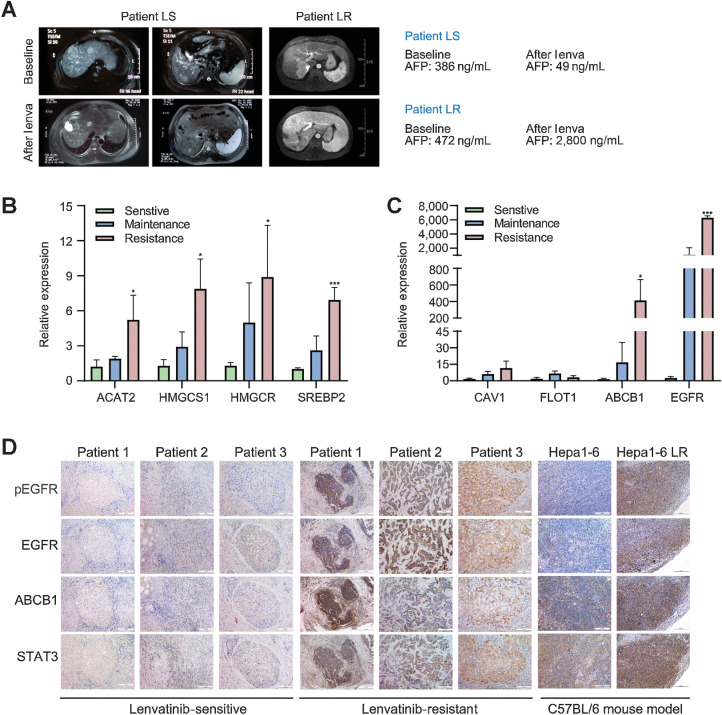
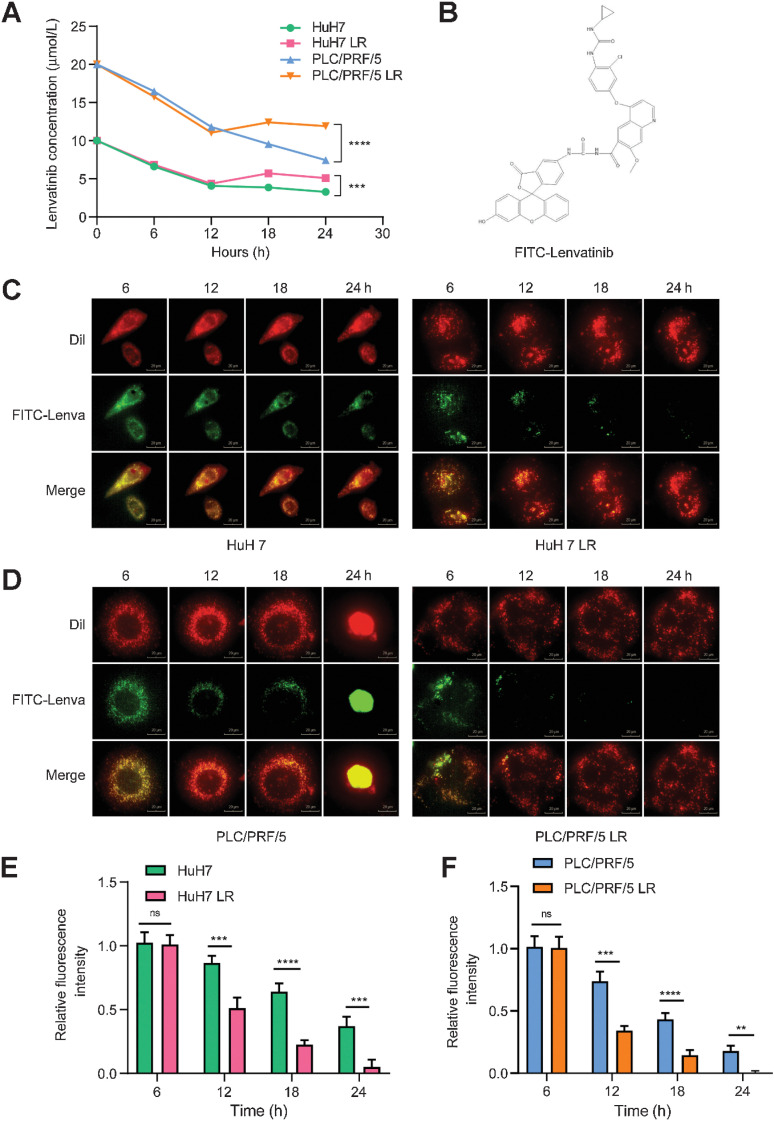
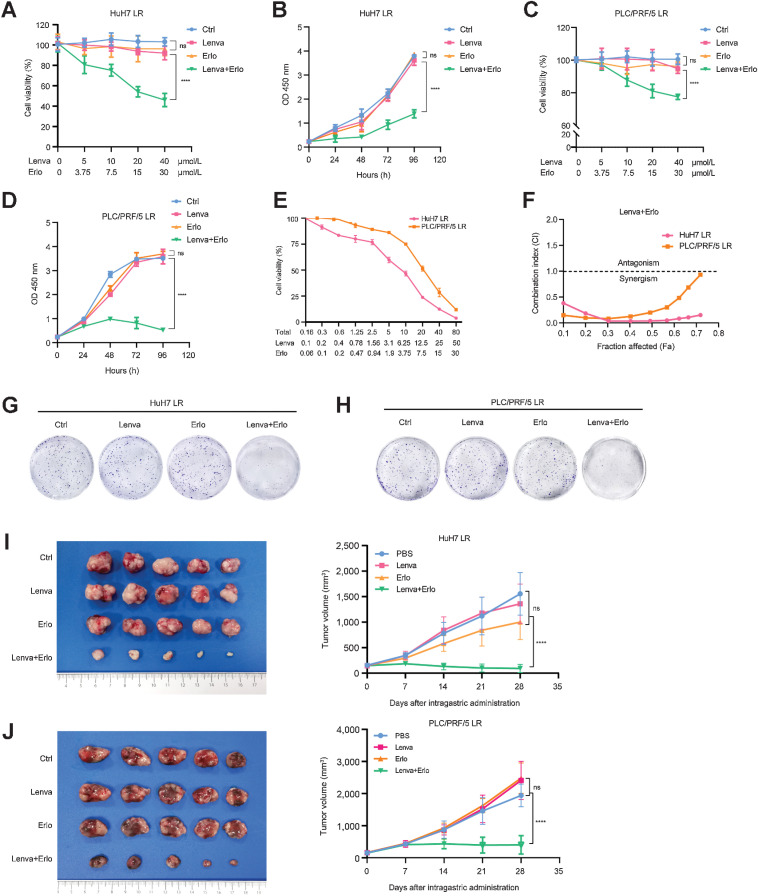
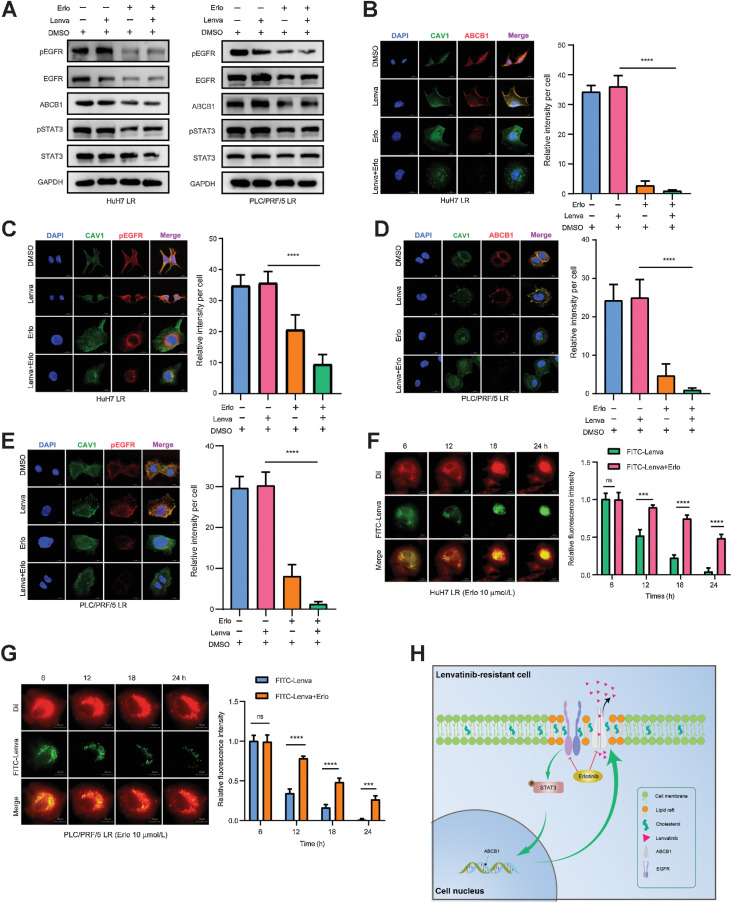
Lenvatinib is an inhibitor of multiple receptor tyrosine kinases that was recently authorized for first-line treatment of hepatocellular carcinoma (HCC). However, the clinical benefits derived from lenvatinib are limited, highlighting the urgent need to understand mechanisms of resistance. We report here that HCC cells develop resistance to lenvatinib by activating EGFR and stimulating the EGFR-STAT3-ABCB1 axis. Lenvatinib resistance was accompanied by aberrant cholesterol metabolism and lipid raft activation. ABCB1 was activated by EGFR in a lipid raft-dependent manner, which significantly enhanced the exocytosis of lenvatinib to mediate resistance. Furthermore, clinical specimens of HCC showed a correlation between the activation of the EGFR-STAT3-ABCB1 pathway and lenvatinib response. Erlotinib, an EGFR inhibitor that has also been shown to inhibit ABCB1, suppressed lenvatinib exocytosis, and combined treatment with lenvatinib and erlotinib demonstrated a significant synergistic effect on HCC both in vitro and in vivo. Taken together, these findings characterize a mechanism of resistance to a first-line treatment for HCC and offer a practical means to circumvent resistance and treat the disease.

Significance: HCC cells acquire resistance to lenvatinib by activating the EGFR-STAT3-ABCB1 pathway, identifying combined treatment with erlotinib as a strategy to overcome acquired resistance and improve the clinical benefit of lenvatinib.


Figures

Figure 1. Establishment of LR cell models and mouse models. A, The IC50 value of HuH7, HuH7 LR, PLC/PRF/5, and PLC/PRF/5 LR cells via CCK-8. Each point on the dose–response curves represents 3 technical replicates. B and C, In subcutaneous xenograft mouse models, LS cells (HuH7 and PLC/PRF/5) and LR cells (HuH7 LR and PLC/PRF/5 LR) were implanted into the right flanks of BALB/c nude mice followed by treatment with PBS or lenvatinib (10 mg/kg/d) when the tumor reached a volume of approximately 100 mm3 in size. Tumor growth was measured every 7 days. After 28 days of treatment, the mice were sacrificed. Tumor appearance, tumor growth, and tumor weight are shown (D–E). In in situ xenograft mouse models, the tumors derived from subcutaneous xenograft mouse models were divided into 1-mm3 sections and implanted under the liver capsule of 4-week-old male BALB/C nude mice, followed by treatment with PBS or lenvatinib (10 mg/kg/d) after 2 weeks. On the 28th day of treatment, the mice were sacrificed. Tumor appearance and tumor weight are shown. F, A 1-mm3 tumor block of Hepa1-6 and Hepa1-6 LR cells (3-generation continuous screening) was subcutaneously implanted into the right posterior flanks of each 4-week-old male C57BL/6 mouse, followed by treatment with lenvatinib (10 mg/kg/d) when the tumor reached a volume of approximately 100 mm3 in size. After 28 days of treatment, the mice were sacrificed. The tumor appearance, tumor growth, and tumor weight are shown. All the results are shown as mean ± SD (n = 5). One- or two-way ANOVA was used to analyze the data. *, P < 0.05; **, P < 0.01; ***, P < 0.001; ****, P < 0.0001.
Figure 1.
Establishment of LR cell models and mouse models. A, The IC50 value of HuH7, HuH7 LR, PLC/PRF/5, and PLC/PRF/5 LR cells via CCK-8. Each point on the dose–response curves represents three technical replicates. B and C, In subcutaneous xenograft mouse models, LS cells (HuH7 and PLC/PRF/5) and LR cells (HuH7 LR and PLC/PRF/5 LR) were implanted into the right flanks of BALB/c nude mice, followed by treatment with PBS or lenvatinib (10 mg/kg/d) when the tumor reached a volume of approximately 100 mm3 in size. Tumor growth was measured every 7 days. After 28 days of treatment, the mice were sacrificed. D and E, Tumor appearance, tumor growth, and tumor weight are shown. In in situ xenograft mouse models, the tumors derived from subcutaneous xenograft mouse models were divided into 1-mm3 sections and implanted under the liver capsule of 4-week-old male BALB/c nude mice, followed by treatment with PBS or lenvatinib (10 mg/kg/d) after 2 weeks. On the 28th day of treatment, the mice were sacrificed. Tumor appearance and tumor weight are shown. F, A 1-mm3 tumor block of Hep1-6 and Hep1-6 LR cells (3-generation continuous screening) was subcutaneously implanted into the right posterior flanks of each 4-week-old male C57BL/6 mouse, followed by treatment with lenvatinib (10 mg/kg/d) when the tumor reached a volume of approximately 100 mm3 in size. After 28 days of treatment, the mice were sacrificed. The tumor appearance, tumor growth, and tumor weight are shown. All the results are shown as mean ± SD (n = 5). One- or two-way ANOVA was used to analyze the data. **, P < 0.01; ***, P < 0.001; ****, P < 0.0001; ns, nonsignificant.
Figure 2. The EGFR–STAT3–ABCB1 axis is activated in LS strains. A, TMT proteome analysis was performed to analyze the proteins derived from HuH7 and HuH7 LR. The top 30 differently expressed proteins are showed in a heatmap, including 20 upregulated and 10 downregulated proteins. B, Phospho-RTK array of LS strains (HuH7 and PLC/PRF/5) versus LR strains (HuH7 LR and PLC/PRF/5 LR). The three spots at the top and bottom of the chips are the internal reference proteins. Positive spots indicated by arrows are p-EGFR. C, Western blot of the protein expression of the EGFR downstream pathway. D, HuH7 and PLC/PRF/5 cells transfected with EGFR or ABCB1 overexpression vector were analyzed for the activation of EGFR, p-STAT3, and ABCB1. E, Western blot of the protein expression on EGFR, p-STAT3, and ABCB1 after knockdown of EGFR or ABCB1 expression in LR-strains (HuH7 LR and PLC/PRF/5 LR). F, Western blot of the protein expression of EGFR, p-STAT3, and ABCB1 after LR strains (HuH7 LR and PLC/PRF/5 LR) were treated with or without Stattic (5 μmol/L) for 24 hours. G and H, CAV1 is a biomarker of lipid rafts. The cells were immunostained for EGFR or ABCB1 (red), CAV1 (green), and DNA (DAPI, blue). Representative fluorescence images of EGFR and ABCB1 anchored to lipid rafts are shown. Scale bars, 15 μmol/L (I) A proximity ligation assay (PLA) demonstrated that spatial colocalization existed between EGFR and ABCB1 (distance < 40 nm).
Figure 2.
The EGFR–STAT3–ABCB1 axis is activated in LS strains. A, TMT proteome analysis was performed to analyze the proteins derived from HuH7 and HuH7 LR. The top 30 differently expressed proteins are shown in a heatmap, including 20 upregulated and 10 downregulated proteins. B, Phospho-RTK array of LS strains (HuH7 and PLC/PRF/5) versus LR strains (HuH7 LR and PLC/PRF/5 LR). The three spots at the top and bottom of the chips are the internal reference proteins. Positive spots indicated by arrows are pEGFR. C, Western blot of the protein expression of the EGFR downstream pathway. D, HuH7 and PLC/PRF/5 cells transfected with EGFR or ABCB1 overexpression vector were analyzed for the activation of EGFR, pSTAT3, and ABCB1. E, Western blot of the protein expression on EGFR, pSTAT3, and ABCB1 after knockdown of EGFR or ABCB1 expression in LR strains (HuH7 LR and PLC/PRF/5 LR). F, Western blot of the protein expression of EGFR, pSTAT3, and ABCB1 after LR strains (HuH7 LR and PLC/PRF/5 LR) were treated with or without Stattic (5 μmol/L) for 24 hours. G and H, CAV1 is a biomarker of lipid rafts. The cells were immunostained for EGFR or ABCB1 (red), CAV1 (green), and DNA (DAPI, blue). I, Representative fluorescence images of EGFR and ABCB1 anchored to lipid rafts are shown. Scale bars, 15 μm. A proximity ligation assay demonstrated that spatial colocalization existed between EGFR and ABCB1 (distance < 40 nm).
Figure 3. EGFR activates ABCB1 in a lipid raft–dependent manner. A and B, All differentially expressed genes were sorted in descending order by fold change and the normalized enrichment score (NES) was calculated for each gene set using the functional gene sets in MSigDB (literature vs. databases containing signaling pathways, physiologic function and spatial structure, etc.). C and D, A total of 112 upregulated gene sets and 128 downregulated gene sets were obtained. NES > 1.0 or < 1.0, P < 0.05 was considered significant. (The NESs for lipid rafts and CAV1 were 2.2 and 2.3, respectively, suggesting functional enrichment in the LR group). E, qPCR results for the mRNA expression of the key enzymes in the lipid metabolic pathway in LS and LR strains. F, Total cellular cholesterol determination of LS and LR strains. G, Cholesterol staining in drug-resistant and drug-sensitive strains. Filipin III is a cholesterol-specific fluorescent dye (blue) and DiI is a membrane-structured fluorescent dye used for cells (red). H, qPCR results for the mRNA expression of CAV1, FLOT1, EGFR, and ABCB1 in LS and LR strains. I, Western blot of EGFR, p-EGFR, CAV1, and ABCB1 expression in LS strains (HuH7 and PLC/PRF/5) versus LR strains (HuH7 LR and PLC/PRF/5 LR). J and K, Western blot of lipid raft markers (J) and protein levels of EGFR and ABCB1 on lipid rafts (K). L, Representative IF images and quantitation for ABCB1 (red), CAV1 (green), and DNA (DAPI, blue) after treatment with PBS or MβCD. n = 5 independent experiences. Scale bars, 15 μmol/L. All the results are shown as the mean ± SD. Two-tailed Student t test and one- or two-way ANOVA were used to analyze the data. *, P < 0.05; **, P < 0.01; ***, P < 0.001; ****, P < 0.0001.
Figure 3.
EGFR activates ABCB1 in a lipid raft–dependent manner. A and B, All differentially expressed genes were sorted in descending order by fold change and the normalized enrichment score (NES) was calculated for each gene set using the functional gene sets in MSigDB (literature vs. databases containing signaling pathways, physiologic function, and spatial structure, etc.). C and D, A total of 112 upregulated gene sets and 128 downregulated gene sets were obtained. NES > 1.0 or < 1.0, P < 0.05 was considered significant. (The NESs for lipid rafts and CAV1 were 2.2 and 2.3, respectively, suggesting functional enrichment in the LR group). E, qPCR results for the mRNA expression of the key enzymes in the lipid metabolic pathway in LS and LR strains. F, Total cellular cholesterol determination of LS and LR strains. G, Cholesterol staining in drug-resistant and drug-sensitive strains. Filipin III is a cholesterol-specific fluorescent dye (blue) and DiI is a membrane-structured fluorescent dye used for cells (red). H, qPCR results for the mRNA expression of CAV1, FLOT1, EGFR, and ABCB1 in LS and LR strains. I, Western blot of EGFR, pEGFR, CAV1, and ABCB1 expression in LS strains (HuH7 and PLC/PRF/5) versus LR strains (HuH7 LR and PLC/PRF/5 LR). J and K, Western blot of lipid raft markers (J) and protein levels (K) of EGFR and ABCB1 on lipid rafts. L, Representative IF images and quantitation for ABCB1 (red), CAV1 (green), and DNA (DAPI, blue) after treatment with PBS or MβCD. n = 5 independent experiences. Scale bars, 15 μm. All the results are shown as the mean ± SD. Two-tailed Student t test and one- or two-way ANOVA were used to analyze the data. *, P < 0.05; **, P < 0.01; ***, P < 0.001; ****, P < 0.0001.
Figure 4. Activation of the EGFR–STAT3–ABCB1 pathway is validated in LR patients and the Hep 1–6 LR mouse model. The efficacy of lenvatinib treatment was evaluated according to RECIST1.1 criteria. In the preoperative efficacy evaluation, patients who reached PD were considered resistant to lenvatinib, and patients who reached PR or SD were considered sensitive to lenvatinib. A, Comparison of liver MRI images and AFP values before and after lenvatinib treatment between a patient in the sensitive group and a patient in the resistant group. B and C, Tissues from patients who reached PR, SD, and PD after lenvatinib treatment were used for validation at the mRNA level. D, IHC staining of liver cancer tissues from patients in the sensitive group and resistant group, and subcutaneous tumor tissues derived from mice that were implanted with the Hep1–6 and Hep1–6 LR strains. All the results are shown as the mean ± SD (n = 5). Two-way ANOVA was used to analyze the data. *, P < 0.05; **, P < 0.01; ***, P < 0.001; ****, P < 0.0001.
Figure 4.
Activation of the EGFR–STAT3–ABCB1 pathway is validated in LR patients and the Hep1–6 LR mouse model. The efficacy of lenvatinib treatment was evaluated according to RECIST1.1 criteria. In the preoperative efficacy evaluation, patients who reached PD were considered resistant to lenvatinib, and patients who reached PR or SD were considered sensitive to lenvatinib. A, Comparison of liver MRI images and AFP values before and after lenvatinib treatment between a patient in the sensitive group and a patient in the resistant group. B and C, Tissues from patients who reached PR, SD, and PD after lenvatinib treatment were used for validation at the mRNA level. D, IHC staining of liver cancer tissues from patients in the sensitive group and resistant group, and subcutaneous tumor tissues derived from mice that were implanted with the Hep1–6 and Hep1–6 LR strains. All the results are shown as the mean ± SD (n = 5). Two-way ANOVA was used to analyze the data. *, P < 0.05; ***, P < 0.001.
Figure 5. Activation of the EGFR–STAT3–ABCB1 axis mediates lenvatinib resistance via drug exocytosis. A, Lenvatinib concentrations in cell culture media were determined. A concentration of 10 μmol/L lenvatinib was added to HuH7 and HuH7 LR cell media, and a concentration of 20 μmol/L of lenvatinib was added to PLC/PRF/5 and PLC/PRF/5 LR cell media. The concentration of lenvatinib in the cell supernatant was measured every 6 hours after drug addition. B, Molecular structure formula of FITC-lenvatinib (molecular weight 784.18 g/mol). C and D, Lenvatinib exocytosis assay for LS and LR strains. The LS and LR strains were stained with DiI dye (red) at a working concentration of 10 μmol/L for 20 minutes. After rinsing with PBS, FITC-lenvatinib (green) at a concentration of 10 μmol/L was added to HuH7 and HuH7 LR cell media, and 20 μmol/L FITC-lenvatinib was added to PLC/PRF/5 and PLC/PRF/5 LR cell media. After 6 hours of treatment, the culture medium was replaced by fresh medium without FITC-lenvatinib and photographed every hour to observe the change of FITC-lenvatinib enrichment in the cells. Scale bars, 20 μmol/L. E and F, Histograms displaying the relative fluorescence intensity of FITC-lenvatinib (green). n = 5 independent experiments. All the results are shown as the mean ± SD. Two-way ANOVA was used to analyze the data. *, P < 0.05; **, P < 0.01; ***, P < 0.001; ****, P < 0.0001.
Figure 5.
Activation of the EGFR–STAT3–ABCB1 axis mediates lenvatinib resistance via drug exocytosis. A, Lenvatinib concentrations in cell culture media were determined. A concentration of 10 μmol/L lenvatinib was added to HuH7 and HuH7 LR cell media, and a concentration of 20 μmol/L of lenvatinib was added to PLC/PRF/5 and PLC/PRF/5 LR cell media. The concentration of lenvatinib in the cell supernatant was measured every 6 hours after drug addition. B, Molecular structure formula of FITC-lenvatinib (molecular weight 784.18 g/mol). C and D, Lenvatinib exocytosis assay for LS and LR strains. The LS and LR strains were stained with DiI dye (red) at a working concentration of 10 μmol/L for 20 minutes. After rinsing with PBS, FITC-lenvatinib (green) at a concentration of 10 μmol/L was added to HuH7 and HuH7 LR cell media, and 20 μmol/L FITC-lenvatinib was added to PLC/PRF/5 and PLC/PRF/5 LR cell media. After 6 hours of treatment, the culture medium was replaced by fresh medium without FITC-lenvatinib and photographed every hour to observe the change of FITC-lenvatinib enrichment in the cells. Scale bars, 20 μm. E and F, Histograms displaying the relative fluorescence intensity of FITC-lenvatinib (green). n = 5 independent experiments. All the results are shown as the mean ± SD. Two-way ANOVA was used to analyze the data. **, P < 0.01; ***, P < 0.001; ****, P < 0.0001; ns, nonsignificant.
Figure 6. Lenvatinib in combination with erlotinib has a synergistic effect on LR strains. A and B, HuH7 LR and PLC/PRF/5 LR strains were treated with the indicated concentration of erlotinib, lenvatinib alone, or their combination for 48 hours. Cells were then subjected to a CCK-8 assay to determine cell viability. C and D, HuH7 LR and PLC/PRF/5 LR strains were treated with the indicated concentration of lenvatinib, erlotinib alone, or their combination. Cells were then subjected to a CCK-8 assay to determine cell viability at the indicated time points. E and F, HuH7 LR and PLC/PRF/5 LR strains were treated with the indicated concentrations of lenvatinib and erlotinib for 48 hours. Cells were then subjected to a CCK-8 assay to determine cell viability, and the CI was determined. G and H, HuH7 LR and PLC/PRF/5 LR strains were treated with lenvatinib, erlotinib alone, or in combination. The remaining cells were stained after 14 days. I and J, Tumor appearance and tumor growth curves of subcutaneous implantation models of the HuH7 LR strain (I) and PLC/PRF/5 LR strain (J). When the tumor volume reached approximately 100 mm3, the mice were treated with PBS, lenvatinib (Lenva, 10 mg/kg), erlotinib (Erlo, 10 mg/kg), or their combination. All the results are shown as the mean ± SD. Two-way ANOVA was used to analyze the data. *, P < 0.05; **, P < 0.01; ***, P < 0.001; ****, P < 0.0001.
Figure 6.
Lenvatinib in combination with erlotinib has a synergistic effect on LR strains. A and B, HuH7 LR and PLC/PRF/5 LR strains were treated with the indicated concentration of erlotinib, lenvatinib alone, or their combination for 48 hours. Cells were then subjected to a CCK-8 assay to determine cell viability. C and D, HuH7 LR and PLC/PRF/5 LR strains were treated with the indicated concentration of lenvatinib, erlotinib alone, or their combination. Cells were then subjected to a CCK-8 assay to determine cell viability at the indicated time points. E and F, HuH7 LR and PLC/PRF/5 LR strains were treated with the indicated concentrations of lenvatinib and erlotinib for 48 hours. Cells were then subjected to a CCK-8 assay to determine cell viability, and the CI was determined. G and H, HuH7 LR and PLC/PRF/5 LR strains were treated with lenvatinib, erlotinib alone, or in combination. The remaining cells were stained after 14 days. I and J, Tumor appearance and tumor growth curves of subcutaneous implantation models of the HuH7 LR strain (I) and PLC/PRF/5 LR strain (J). When the tumor volume reached approximately 100 mm3, the mice were treated with PBS, lenvatinib (Lenva, 10 mg/kg), erlotinib (Erlo, 10 mg/kg), or their combination. All the results are shown as the mean ± SD. Two-way ANOVA was used to analyze the data. ****, P < 0.0001; ns, nonsignificant.
Figure 7. Lenvatinib combined with erlotinib effectively blocks the EGFR–STAT3–ABCB1 pathway. A, HuH7 LR strains were treated with DMSO, without lenvatinib (Lenva, 20 μmol/L), erlotinib (Erlo, 30 μmol/L), or the combination (Lenva, 3 μmol/L + Erlo, 10 μmol/L) for 48 hours. PLC/PRF/5 LR strains were treated with DMSO, with/without lenvatinib (Lenva, 30 μmol/L), Erlotinib (Erlo, 30 μmol/L), or the combination (Lenva, 10 μmol/L + Erlo, 10 μmol/L) for 48 hours. Western blotting was conducted to observe changes in the EGFR–STAT3–ABCB1 pathway. B–E, HuH7 LR (B, C) and PLC/PRF/5 LR (D, E) cells were treated with DMSO, lenvatinib, erlotinib, or the combination as the Western blotting experiment (A), fixed and stained with ABCB1, CAV1, and p-EGFR antibodies. The fluorescence signals were analyzed by using confocal microscopy. Representative images and the quantitation of relative fluorescence intensity are shown. n = 5 independent experiments. Scale bars, 15 μmol/L (F–G) LR strains were stained with DiI dye (red) at a working concentration of 10 μmol/L for 20 minutes. After rinsing with PBS, FITC-lenvatinib (green) at a concentration of 10 μmol/L was added to HuH7 and HuH7 LR cell media, and 20 μmol/L FITC-lenvatinib was added to PLC/PRF/5 and PLC/PRF/5 LR cell media. After 6 hours of treatment, the culture medium was replaced with fresh medium containing 10 μmol/L erlotinib and photographed every hour to observe the changes in FITC-lenvatinib enrichment in the cells. Representative images and the quantitation of relative fluorescence intensity are shown. n = 5 independent experiments. Scale bars, 20 μmol/L. H, Working model of the combination of lenvatinib and erlotinib eliminating lenvatinib resistance induced by EGFR–STAT3–ABCB1 axis activation in HCC. All the results are shown as the mean ± SD. One- or two-way ANOVA was used to analyze the data. *, P < 0.05; **, P < 0.01; ***, P < 0.001; ****, P < 0.0001.
Figure 7.
Lenvatinib combined with erlotinib effectively blocks the EGFR–STAT3–ABCB1 pathway. A, HuH7 LR strains were treated with DMSO, without lenvatinib (Lenva, 20 μmol/L), erlotinib (Erlo, 30 μmol/L), or the combination (Lenva, 3 μmol/L + Erlo, 10 μmol/L) for 48 hours. PLC/PRF/5 LR strains were treated with DMSO, with/without lenvatinib (Lenva, 30 μmol/L), erlotinib (Erlo, 30 μmol/L), or the combination (Lenva, 10 μmol/L + Erlo, 10 μmol/L) for 48 hours. Western blotting was conducted to observe changes in the EGFR–STAT3–ABCB1 pathway. B–E, HuH7 LR (B and C) and PLC/PRF/5 LR (D and E) cells were treated with DMSO, lenvatinib, erlotinib, or the combination as the Western blotting experiment (A), fixed and stained with ABCB1, CAV1, and pEGFR antibodies. The fluorescence signals were analyzed by using confocal microscopy. Representative images and the quantitation of relative fluorescence intensity are shown. n = 5 independent experiments. Scale bars, 15 μm. F and G, LR strains were stained with DiI dye (red) at a working concentration of 10 μmol/L for 20 minutes. After rinsing with PBS, FITC-lenvatinib (green) at a concentration of 10 μmol/L was added to HuH7 and HuH7 LR cell media, and 20 μmol/L FITC-lenvatinib was added to PLC/PRF/5 and PLC/PRF/5 LR cell media. After 6 hours of treatment, the culture medium was replaced with fresh medium containing 10 μmol/L erlotinib and photographed every hour to observe the changes in FITC-lenvatinib enrichment in the cells. Representative images and the quantitation of relative fluorescence intensity are shown. n = 5 independent experiments. Scale bars, 20 μm. H, Working model of the combination of lenvatinib and erlotinib eliminating lenvatinib resistance induced by EGFR–STAT3–ABCB1 axis activation in HCC. All the results are shown as the mean ± SD. One- or two-way ANOVA was used to analyze the data. ***, P < 0.001; ****, P < 0.0001; ns, nonsignificant.

References

    1. Sung H, Ferlay J, Siegel RL, Laversanne M, Soerjomataram I, Jemal A, et al. . Global cancer statistics 2020: GLOBOCAN estimates of incidence and mortality worldwide for 36 cancers in 185 countries. CA Cancer J Clin 2021;71:209–49. - PubMed
    1. Llovet JM, Montal R, Sia D, Finn RS. Molecular therapies and precision medicine for hepatocellular carcinoma. Nat Rev Clin Oncol 2018;15:599–616. - PubMed
    1. Kudo M. Lenvatinib may drastically change the treatment landscape of hepatocellular carcinoma. Liver Cancer 2018;7:1–19. - PMC - PubMed
    1. Al-Salama ZT, Syed YY, Scott LJ. Lenvatinib: a review in hepatocellular carcinoma. Drugs 2019;79:665–74. - PubMed
    1. Pike LJ. Rafts defined: a report on the Keystone Symposium on Lipid Rafts and Cell Function. J Lipid Res 2006;47:1597–8. - PubMed

Publication types

MeSH terms