. 2022 Nov 2;82(21):4079-4092.
doi: 10.1158/0008-5472.CAN-22-0770.

MET-Induced CD73 Restrains STING-Mediated Immunogenicity of EGFR-Mutant Lung Cancer

Affiliations

MET-Induced CD73 Restrains STING-Mediated Immunogenicity of EGFR-Mutant Lung Cancer

Ryohei Yoshida et al. Cancer Res. .

Abstract

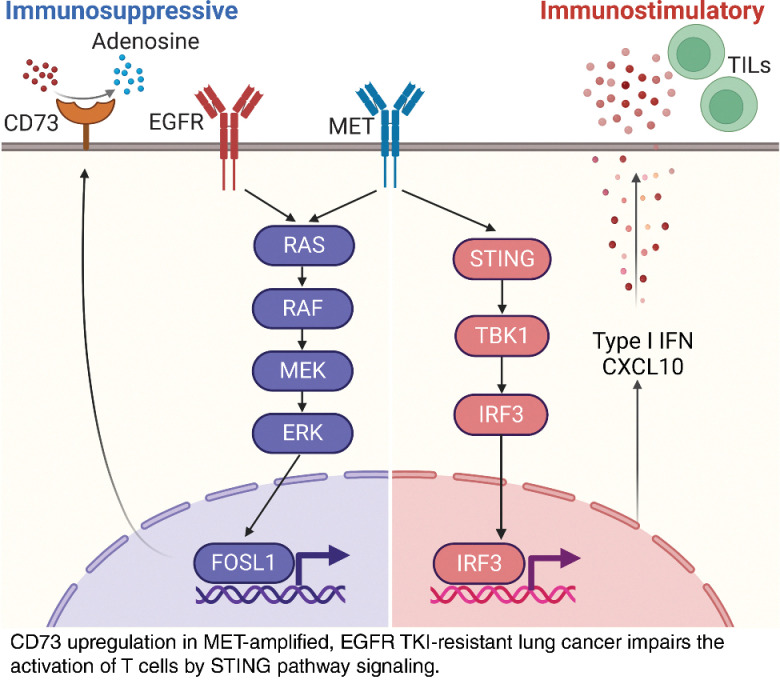
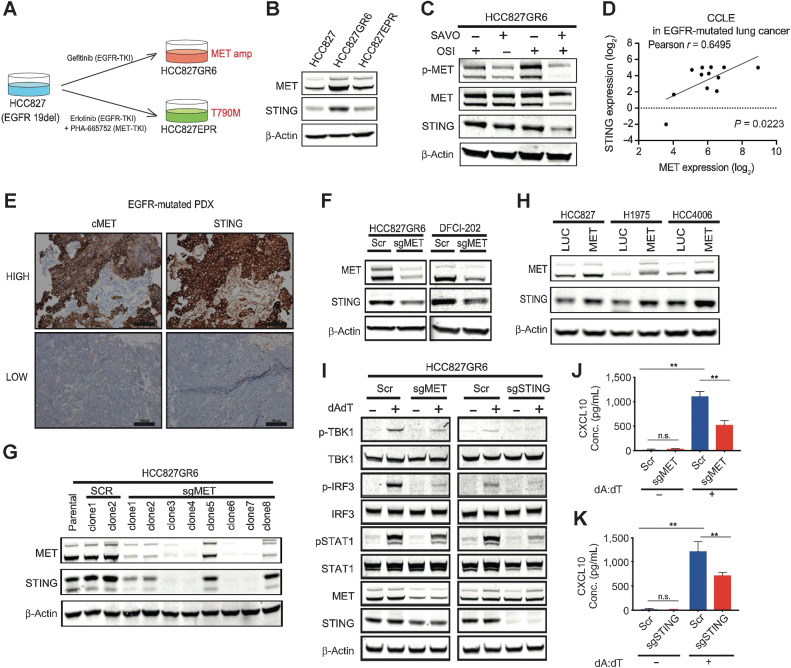
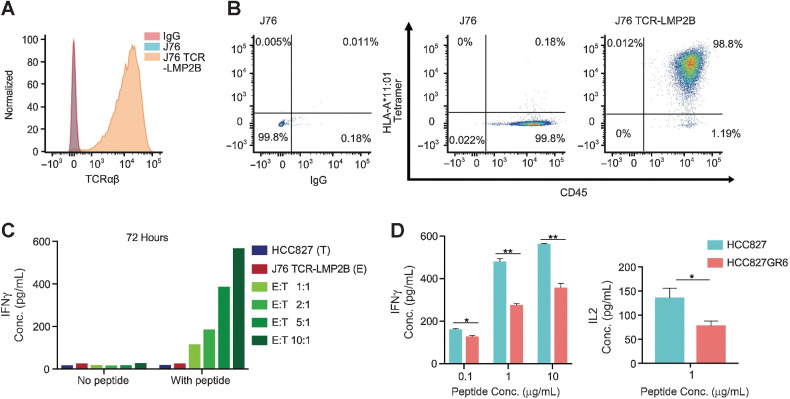
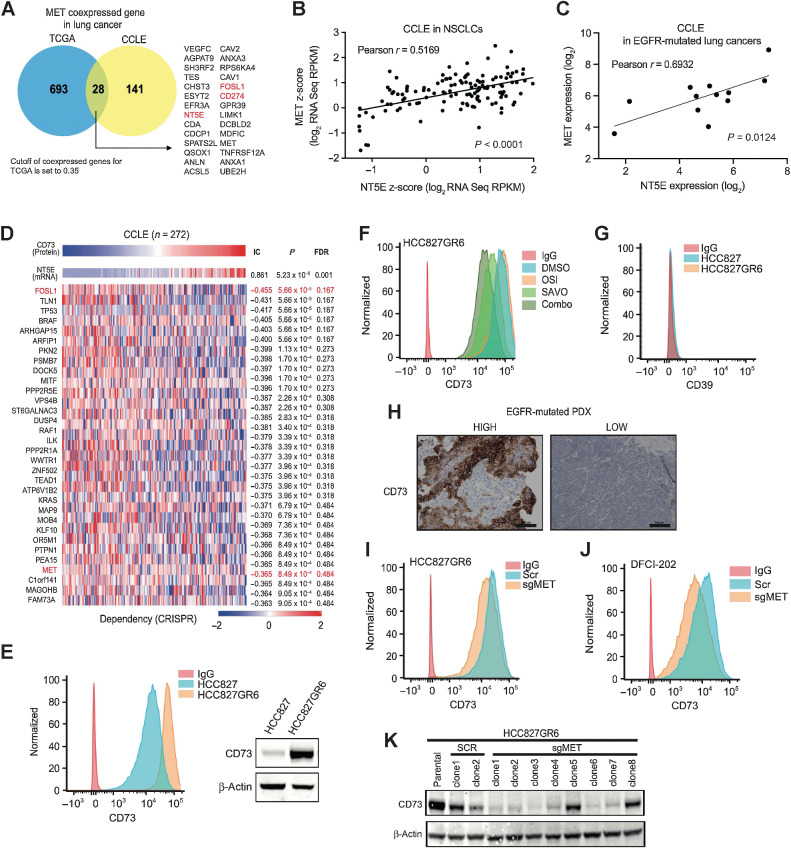
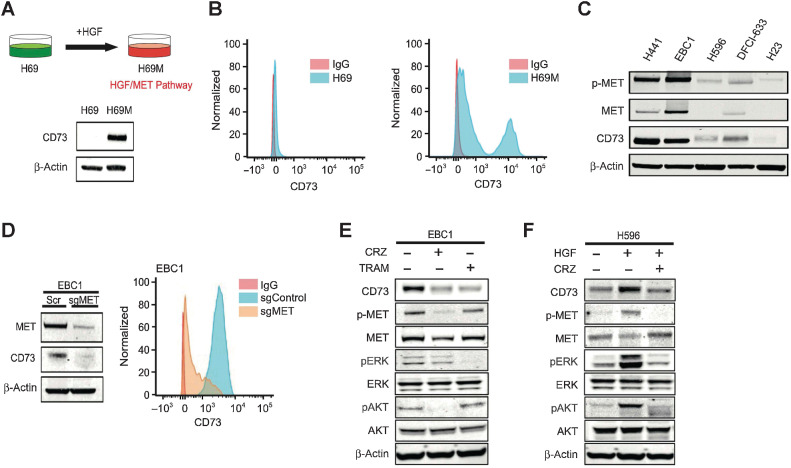
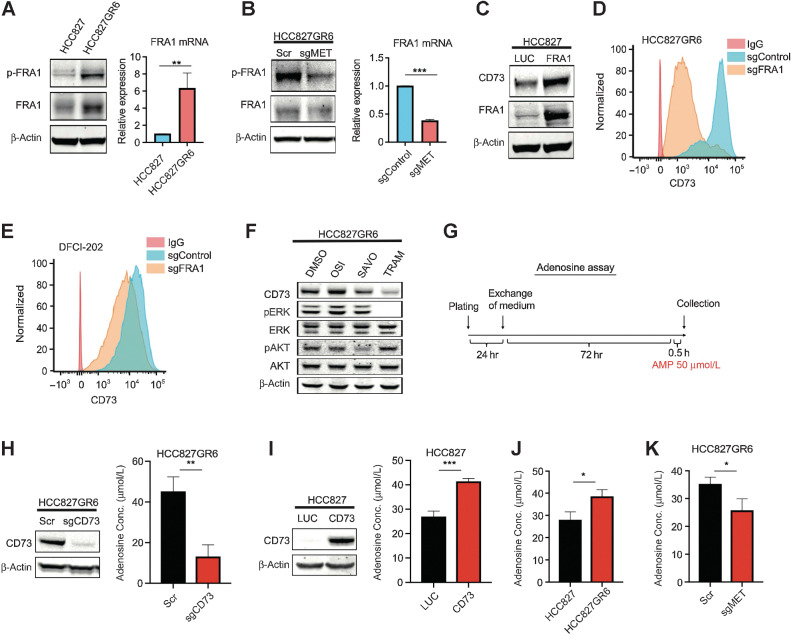
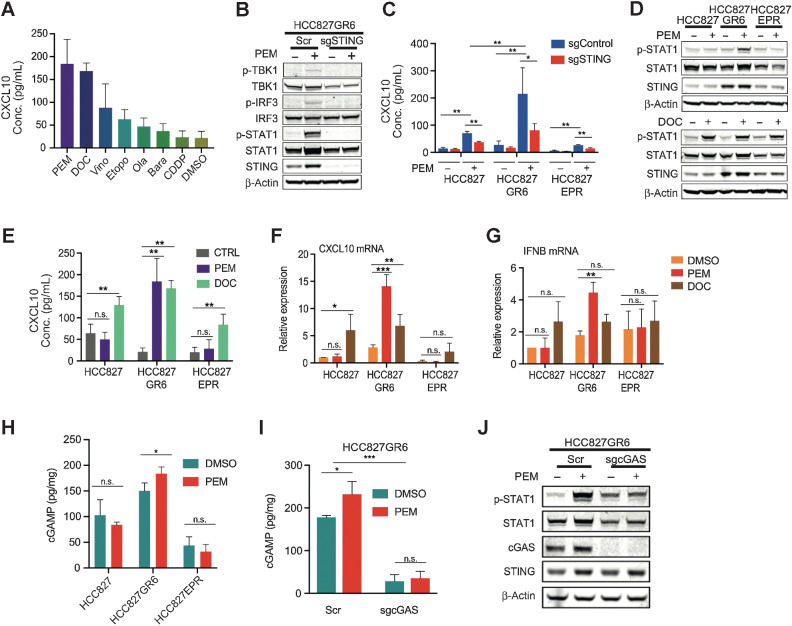
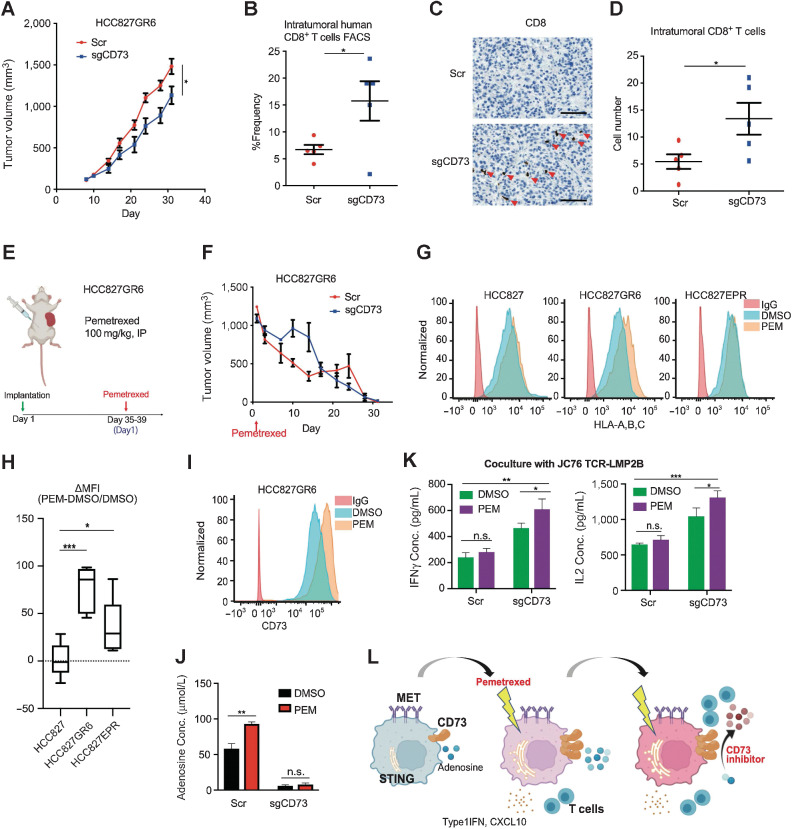
Immunotherapy has shown limited efficacy in patients with EGFR-mutated lung cancer. Efforts to enhance the immunogenicity of EGFR-mutated lung cancer have been unsuccessful to date. Here, we discover that MET amplification, the most common mechanism of resistance to third-generation EGFR tyrosine kinase inhibitors (TKI), activates tumor cell STING, an emerging determinant of cancer immunogenicity (1). However, STING activation was restrained by ectonucleosidase CD73, which is induced in MET-amplified, EGFR-TKI-resistant cells. Systematic genomic analyses and cell line studies confirmed upregulation of CD73 in MET-amplified and MET-activated lung cancer contexts, which depends on coinduction of FOSL1. Pemetrexed (PEM), which is commonly used following EGFR-TKI treatment failure, was identified as an effective potentiator of STING-dependent TBK1-IRF3-STAT1 signaling in MET-amplified, EGFR-TKI-resistant cells. However, PEM treatment also induced adenosine production, which inhibited T-cell responsiveness. In an allogenic humanized mouse model, CD73 deletion enhanced immunogenicity of MET-amplified, EGFR-TKI-resistant cells, and PEM treatment promoted robust responses regardless of CD73 status. Using a physiologic antigen recognition model, inactivation of CD73 significantly increased antigen-specific CD8+ T-cell immunogenicity following PEM treatment. These data reveal that combined PEM and CD73 inhibition can co-opt tumor cell STING induction in TKI-resistant EGFR-mutated lung cancers and promote immunogenicity.

Significance: MET amplification upregulates CD73 to suppress tumor cell STING induction and T-cell responsiveness in TKI-resistant, EGFR-mutated lung cancer, identifying a strategy to enhance immunogenicity and improve treatment.


Figures

None
Graphical abstract
Figure 1. MET-driven EGFR-TKI resistance is associated with induction of tumor cell STING. A, Schematic of EGFR-TKI–resistant cell lines and resistance mechanism using HCC827 cells. B, Immunoblot (IB) of the indicated proteins in HCC827, HCC827GR6, and HCC827EPR cell lines. C, IB of indicated proteins HCC827GR6 cell lines treated with 1 μmol/L osimertinib (OSI) and 1 μmol/L savolitinib (SAVO) for 72 hours. D, Gene expression correlation between MET and STING in EGFR-mutated lung cancer cell lines using CCLE. R squared and P values were calculated using Pearson correlation. E, Representative cMET and STING IHC images of EGFR-mutated PDX samples. F, IB of indicated proteins in HCC827GR6 or DFCI-202 cell lines with Scr or MET sgRNA. G, IB of single-cell cloning using HCC827GR6 cells with Scr or MET sgRNA. H, IB of the indicated proteins in overexpressing of MET in HCC827, H1975, and HCC4006 cell lines. I, IB of the indicated proteins in HCC827GR6 cells with Scramble (Scr) or MET sgRNA or STING sgRNA, and treated ± 1 μg/mL poly (dA:dT) for 4 hours. J and K, ELISA of human CXCL10 levels in CM derived from HCC827GR6 cells with Scr or MET sgRNA or STING sgRNA, and treated ± 1μg/mL poly (dA:dT) for 24 hours.
Figure 1.
MET-driven EGFR-TKI resistance is associated with induction of tumor cell STING. A, Schematic of EGFR-TKI–resistant cell lines and resistance mechanism using HCC827 cells. B, Immunoblot of the indicated proteins in HCC827, HCC827GR6, and HCC827EPR cell lines. C, Immunoblot of indicated proteins HCC827GR6 cell lines treated with 1 μmol/L osimertinib (OSI) and 1 μmol/L savolitinib (SAVO) for 72 hours. D, Gene expression correlation between MET and STING in EGFR-mutated lung cancer cell lines using CCLE. R squared and P values were calculated using Pearson correlation. E, Representative cMET and STING IHC images of EGFR-mutated PDX samples. F, Immunoblot of indicated proteins in HCC827GR6 or DFCI-202 cell lines with Scr or MET sgRNA. G, Immunoblot of single-cell cloning using HCC827GR6 cells with Scr or MET sgRNA. H, Immunoblot of the indicated proteins in overexpressing of MET in HCC827, H1975, and HCC4006 cell lines. I, Immunoblot of the indicated proteins in HCC827GR6 cells with Scramble (Scr) or MET sgRNA or STING sgRNA, and treated ± 1 μg/mL poly (dA:dT) for 4 hours. J and K, ELISA of human CXCL10 levels in CM derived from HCC827GR6 cells with Scramble or MET sgRNA or STING sgRNA, and treated ± 1μg/mL poly (dA:dT) for 24 hours. **, P < 0.005; n.s., nonsignificant.
Figure 2. Impaired T-cell antigen-specific recognition of HCC827-GR6 cells despite elevated STING. A, TCRαβ expression on J76 cells transduced with or without LMP2B TCR. B, HLA-A*11:01 Tetramer and CD45 expression on J76 cells transduced with or without LMP2B TCR. C, ELISA of human IFNγ levels in CM derived from HCC827 cells with J76 cells transduced with LMP2B TCR for 72 hours, and pretreated ± 10 μg/mL peptides (SSCSSCPLSK) for 3 hours. Each data represents one experiment. D, ELISA of human IFNγ levels in CM derived from HCC827 or HCC827GR6 cells with J76 cells transduced with LMP2B TCR for 72 hours, and pretreated ± 0.1, 1, 10μg/mL peptides (SSCSSCPLSK) for 3 hours. Mean ± SEM of n = 2 biological replicates shown (unpaired two-tailed Student t test; left). ELISA of human IL2 levels in CM derived from HCC827 or HCC827GR6 cells with J76 cells transduced with LMP2B TCR for 72 hours, and pretreated ±1 μg/mL peptides (SSCSSCPLSK) for 3 hours. Mean ± SEM of n = 3 biological replicates shown (unpaired two-tailed Student t test; right).
Figure 2.
Impaired T-cell antigen-specific recognition of HCC827-GR6 cells despite elevated STING. A, TCRαβ expression on J76 cells transduced with or without LMP2B TCR. B, HLA-A*11:01 Tetramer and CD45 expression on J76 cells transduced with or without LMP2B TCR. C, ELISA of human IFNγ levels in CM derived from HCC827 cells with J76 cells transduced with LMP2B TCR for 72 hours and pretreated ±10 μg/mL peptides (SSCSSCPLSK) for 3 hours. Each data represents one experiment. D, ELISA of human IFNγ levels in CM derived from HCC827 or HCC827GR6 cells with J76 cells transduced with LMP2B TCR for 72 hours and pretreated ± 0.1, 1, 10μg/mL peptides (SSCSSCPLSK) for 3 hours. Mean ± SEM of n = 2 biological replicates is shown (unpaired two-tailed Student t test; left). ELISA of human IL2 levels in CM derived from HCC827 or HCC827GR6 cells with J76 cells transduced with LMP2B TCR for 72 hours and pretreated ±1 μg/mL peptides (SSCSSCPLSK) for 3 hours. Mean ± SEM of n = 3 biological replicates shown (unpaired two-tailed Student t test; right). *, P < 0.05; **, P < 0.005.
Figure 3. CD73 coactivation with STING in MET-driven EGFR-TKI–resistant cells. A, Venn diagram showing the genes coexpressed with MET in NSCLCs in TCGA and CCLE. B, Correlation between MET and NT5E expression in lung cancer cell lines using CCLE. Pearson correlation and P value were calculated. C, Gene expression correlation between MET and NT5E in EGFR-mutated lung cancer cell lines using CCLE. R squared and P values were calculated using Pearson correlation. D, Top genetic dependencies identified on the basis of NT5E expression across CCLE and Depmap database (n = 272). The heatmap colors illustrate relative scores for mRNA and protein expression high (red) to low (blue), and the degree of dependency from high (blue) to low (red) as shown by the scale shown on the bottom right. E, CD73 expression on HCC827 and HCC827GR6 cells. F, CD73 expression on HCC827GR6 cells treated with 1 μmol/L osimertinib (OSI) and 1 μmol/L savolitinib (SAVO) for 48 hours. G, CD39 expression on HCC827 and HCC827GR6 cells. H, Representative CD73 IHC images of EGFR-mutated PDX samples. Representative image uses the same samples corresponding to the HIGH/LOW group of cMET in Fig. 1E. I and J, CD73 expression on HCC827GR6 or DFCI-202 cells with Scr or MET sgRNA. K, Correlation between MET and CD73 in HCC827GR6 signle-cell cloning with Scr or MET sgRNA.
Figure 3.
CD73 coactivation with STING in MET-driven EGFR-TKI–resistant cells. A, Venn diagram showing the genes coexpressed with MET in NSCLCs in TCGA and CCLE. B, Correlation between MET and NT5E expression in lung cancer cell lines using CCLE. Pearson correlation and P value were calculated. C, Gene expression correlation between MET and NT5E in EGFR-mutated lung cancer cell lines using CCLE. R squared and P values were calculated using Pearson correlation. D, Top genetic dependencies identified on the basis of NT5E expression across CCLE and Depmap database (n = 272). The heatmap colors illustrate relative scores for mRNA and protein expression high (red) to low (blue), and the degree of dependency from high (blue) to low (red) as shown by the scale shown on the bottom right. E, CD73 expression on HCC827 and HCC827GR6 cells. F, CD73 expression on HCC827GR6 cells treated with 1 μmol/L osimertinib (OSI) and 1 μmol/L savolitinib (SAVO) for 48 hours. G, CD39 expression on HCC827 and HCC827GR6 cells. H, Representative CD73 IHC images of EGFR-mutated PDX samples. Representative image uses the same samples corresponding to the HIGH/LOW group of cMET in Fig. 1E. I and J, CD73 expression on HCC827GR6 or DFCI-202 cells with Scramble (Scr) or MET sgRNA. K, Correlation between MET and CD73 in HCC827GR6 signle-cell cloning with Scr or MET sgRNA.
Figure 4. CD73 is regulated by oncogenic MET in lung cancer cells. A, H69/H69M HGF derived isogenic model and IB of CD73 at basal expression. B, Flow cytometry of CD73 in H69M at basal condition. Isotype control in red. C, IB of different lung cancer cell lines used in the study. Protein basal status are indicated. D, IB showing the levels of MET and CD73 in the EBC1 cells after MET KO targeting MET (#1KO). Scr, scramble control. ACTIN, total protein-loading control (up). Flow citometry assay of CD73 levels in the MET scr and KO EBC1 cells (down). E, IB of the indicated proteins in the cell lines after treatment with 0.1 μmol/L crizotinib (CRZ) and 30 nmol/L trametinib (TRAM). F, IB of the indicated proteins in the cell lines after treatment with 0.05 μmol/L HGF and 0.1 μmol/L crizotinib (CRZ).
Figure 4.
CD73 is regulated by oncogenic MET in lung cancer cells. A, H69/H69M HGF-derived isogenic model and immunoblot of CD73 at basal expression. B, Flow cytometry of CD73 in H69M at basal condition. Red, isotype control. C, Immunoblot of different lung cancer cell lines used in the study. Protein basal status is indicated. D, Immunoblot showing the levels of MET and CD73 in the EBC1 cells after MET KO targeting MET (#1KO). Scr, scramble control. ACTIN, total protein-loading control (up). Flow cytometry assay of CD73 levels in the MET scr and KO EBC1 cells (down). E, Immunoblot of the indicated proteins in the cell lines after treatment with 0.1 μmol/L crizotinib (CRZ) and 30 nmol/L trametinib (TRAM). F, Immunoblot of the indicated proteins in the cell lines after treatment with 0.05 μmol/L HGF and 0.1 μmol/L crizotinib.
Figure 5. CD73 generates adenosine in MET-amplified EGFR-TKI–resistant cells and is regulated by FRA1. A and B, IB of the phospho- and total FRA1 proteins or qRT-PCR of FRA1 in HCC827 and HCC827GR6 cell lines or HCC827GR6 cell lines with Scr or MET sgRNA. Mean ± SEM of n = 3 biological replicates shown (unpaired two-tailed Student t test). C, IB of indicated proteins in HCC827 cells overexpressing LUC or FRA1. D and E, CD73 expression on HCC827GR6 or DFCI-202 cells with Scr or FRA1 sgRNA. F, IB of indicated proteins HCC827GR6 cell lines treated with indicated compounds for 48 hours. OSI: osimertinib, SAVO: savolitinib, TRAM: trametinib. G, Adenosine assay protocol using Adenosine Assay Kit (Abcam, catalog no. ab211094). H, IB of indicated proteins in HCC827GR6 cells with Scr or CD73 sgRNA. Adenosine levels in CM derived from HCC827GR6 cells with Scr or CD73 sgRNA for 72 hours. Mean ± SEM of n = 3 biological replicates shown (unpaired two-tailed Student t test). I, IB of indicated proteins in HCC827 cells overexpressing LUC or CD73. Adenosine levels in CM derived from HCC827 cells overexpressing LUC or CD73 for 72 hours. Mean ± SEM of n = 3 biological replicates shown (unpaired two-tailed Student t test). J, Adenosine levels in CM derived from HCC827 or HCC827GR6 cells for 72 hours. Mean ± SEM of n = 3 biological replicates shown (unpaired two-tailed Student t test). K, Adenosine levels in CM derived from HCC827GR6 cells with Scr or MET sgRNA for 72 hours. Mean ± SEM of n = 3 biological replicates shown (unpaired two-tailed Student t test).
Figure 5.
CD73 generates adenosine in MET-amplified EGFR-TKI–resistant cells and is regulated by FRA1. A and B, Immunoblot of the phospho- and total FRA1 proteins or qRT-PCR of FRA1 in HCC827 and HCC827GR6 cell lines or HCC827GR6 cell lines with Scramble (Scr) or MET sgRNA. Mean ± SEM of n = 3 biological replicates is shown (unpaired two-tailed Student t test). C, Immunoblot of indicated proteins in HCC827 cells overexpressing LUC or FRA1. D and E, CD73 expression on HCC827GR6 or DFCI-202 cells with Scramble or FRA1 sgRNA. F, Immunoblot of indicated proteins HCC827GR6 cell lines treated with indicated compounds for 48 hours. OSI, osimertinib; SAVO, savolitinib; TRAM, trametinib. G, Adenosine assay protocol using Adenosine Assay Kit (Abcam, catalog no. ab211094). H, Immunoblot of indicated proteins in HCC827GR6 cells with Scramble or CD73 sgRNA. Adenosine levels in CM derived from HCC827GR6 cells with Scramble or CD73 sgRNA for 72 hours. Mean ± SEM of n = 3 biological replicates is shown (unpaired two-tailed Student t test). I, Immunoblot of indicated proteins in HCC827 cells overexpressing LUC or CD73. Adenosine levels in CM derived from HCC827 cells overexpressing LUC or CD73 for 72 hours. Mean ± SEM of n = 3 biological replicates is shown (unpaired two-tailed Student t test). J, Adenosine levels in CM derived from HCC827 or HCC827GR6 cells for 72 hours. Mean ± SEM of n = 3 biological replicates is shown (unpaired two-tailed Student t test). K, Adenosine levels in CM derived from HCC827GR6 cells with Scramble or MET sgRNA for 72 hours. Mean ± SEM of n = 3 biological replicates is shown (unpaired two-tailed Student t test). *, P < 0.05; **, P < 0.005; ***, P < 0.001.
Figure 6. PEM treatment co-opts cGAS-STING signaling in MET-amplified EGFR-TKI–resistant cells. A, ELISA of human CXCL10 levels in CM in HCC827GR6 cells treated with indicated compounds. B, IB of the indicated proteins in HCC827GR6 cells with Scramble (Scr) or STING sgRNA, and treated ± PEM for 48 hours followed by 24 hours of drug-free. C, ELISA of human CXCL10 levels in CM in HCC827, HCC827GR6, and HCC827EPR cell lines with Scr or STING sgRNA, and treated ± PEM for 48 hours followed by 24 hours of drug-free. Mean ± SEM of n = 4 biological replicates shown (unpaired two-tailed Student t test). D and E, IB of the indicated proteins or ELISA of human CXCL10 levels in CM in HCC827, HCC827GR6, and HCC827EPR cells treated ± PEM or DOC for 48 hours followed by 24 hours of drug-free. F and G, qRT-PCR of human CXCL10 or human IFNB in HCC827, HCC827GR6, HCC827EPR cell lines treated ± PEM or DOC for 48 hours followed by 24 hours of drug-free. Mean ± SEM of n = 3 biological replicates shown (unpaired two-tailed Student t test). H, ELISA of human cGAMP levels in cell lysates derived from HCC827, HCC827GR6, HCC827EPR cells lines pretreated ± PEM for 48 hours followed by 24 hours of drug-free. I, ELISA of human cGAMP levels in cell lysates derived from HCC827GR6 cells lines with Scr or cGAS sgRNA pretreated ± PEM for 48 hours followed by 24 hours of drug-free. Mean ± SEM of n = 3 biological replicates shown (unpaired two-tailed Student t test). J, IB of indicated proteins in HCC827GR6 with Scr or cGAS sgRNA pretreated ± PEM for 48 hours followed by 24 hours of drug-free.
Figure 6.
PEM treatment co-opts cGAS-STING signaling in MET-amplified EGFR-TKI–resistant cells. A, ELISA of human CXCL10 levels in CM in HCC827GR6 cells treated with indicated compounds. B, Immunoblot of the indicated proteins in HCC827GR6 cells with Scramble (Scr) or STING sgRNA and treated ± PEM for 48 hours, followed by 24 hours of drug-free. C, ELISA of human CXCL10 levels in CM in HCC827, HCC827GR6, and HCC827EPR cell lines with Scramble or STING sgRNA and treated ± PEM for 48 hours, followed by 24 hours of drug-free. Mean ± SEM of n = 4 biological replicates is shown (unpaired two-tailed Student t test). D and E, Immunoblot of the indicated proteins or ELISA of human CXCL10 levels in CM in HCC827, HCC827GR6, and HCC827EPR cells treated ± PEM or DOC for 48 hours, followed by 24 hours of drug-free. F and G, qRT-PCR of human CXCL10 or human IFNB in HCC827, HCC827GR6, HCC827EPR cell lines treated ± PEM or DOC for 48 hours, followed by 24 hours of drug-free. Mean ± SEM of n = 3 biological replicates is shown (unpaired two-tailed Student t test). H, ELISA of human cGAMP levels in cell lysates derived from HCC827, HCC827GR6, HCC827EPR cells lines pretreated ± PEM for 48 hours, followed by 24 hours of drug-free. I, ELISA of human cGAMP levels in cell lysates derived from HCC827GR6 cells lines with Scramble or cGAS sgRNA pretreated ± PEM for 48 hours, followed by 24 hours of drug-free. Mean ± SEM of n = 3 biological replicates is shown (unpaired two-tailed Student t test). J, Immunoblot of indicated proteins in HCC827GR6 with Scramble or cGAS sgRNA pretreated ± PEM for 48 hours, followed by 24 hours of drug-free. *, P < 0.05; **, P < 0.005; ***, P < 0.001; n.s., nonsignificant.
Figure 7. PEM-induced immunogenicity is restrained by CD73. A, Tumor volume of HCC827GR6 cells with Scramble (Scr) or CD73sgRNA using humanized murine model (n = 8 in each group). B, Frequency of CD8+ T cells infiltration among CD45+ cells in mouse tumors (n = 5 in each group). C and D, Representative CD8 IHC images and analysis from Scr or CD73sgRNA mouse tumors. Red arrows highlight intratumoral localization of CD8+ T cells. Scale bar, 100 μmol/L. E, Schematic of study with PEM in humanized murine HCC827GR6 cells models. F, Tumor volume of HCC827GR6 cells with Scramble (Scr) or CD73 sgRNA with PEM treatment in humanized murine model (n = 3 in each group). G and H, HLA-A,B,C expression on HCC827, HCC827GR6, and HCC827EPR cells treated ± PEM for 48 hours followed by 24 hours of drug-free. MFI: Mean fluorescence intensity. ΔMFI: (Pemetrexed-DMSO (dimethyl sulfoxide))/DMSO. Mean ± SEM of n = 5 biological replicates shown (unpaired two-tailed Student t test). I, CD73 expression on HCC827GR6 cells treated ± PEM for 48 hours followed by 24 hours of drug-free. J, Adenosine levels in CM derived from HCC827GR6 cell lines with Scr or CD73 sgRNA treated ± PEM for 48 hours for 72 hours. Mean ± SEM of n = 3 biological replicates shown (unpaired two-tailed Student t test). K, ELISA of human IFNγ and IL2 levels in CM derived from HCC827GR6 cells lines with Scr or CD73 sgRNA pretreated ± PEM for 48 hours with J76 cells transduced with LMP2B TCR for 72 hours, and pretreated ±1 μg/mL peptides (SSCSSCPLSK) for 3 hours. Mean ± SEM of n = 3 biological replicates shown (unpaired two-tailed Student t test). L, Schematic of treatment strategy on in MET-driven EGFR-TKI–resistant cells.
Figure 7.
PEM-induced immunogenicity is restrained by CD73. A, Tumor volume of HCC827GR6 cells with Scramble (Scr) or CD73sgRNA using humanized murine model (n = 8 in each group). B, Frequency of CD8+ T cells infiltration among CD45+ cells in mouse tumors (n = 5 in each group). C and D, Representative CD8 IHC images and analysis from Scramble or CD73sgRNA mouse tumors. Red arrows highlight intratumoral localization of CD8+ T cells. Scale bar, 100 μmol/L. E, Schematic of study with PEM in humanized murine HCC827GR6 cells models. F, Tumor volume of HCC827GR6 cells with Scramble or CD73 sgRNA with PEM treatment in humanized murine model (n = 3 in each group). G and H, HLA-A,B,C expression on HCC827, HCC827GR6, and HCC827EPR cells treated ± PEM for 48 hours, followed by 24 hours of drug-free. MFI, mean fluorescence intensity. ΔMFI, (Pemetrexed-DMSO (dimethyl sulfoxide))/DMSO. Mean ± SEM of n = 5 biological replicates is shown (unpaired two-tailed Student t test). I, CD73 expression on HCC827GR6 cells treated ± PEM for 48 hours, followed by 24 hours of drug-free. J, Adenosine levels in CM derived from HCC827GR6 cell lines with Scramble or CD73 sgRNA treated ± PEM for 48 hours for 72 hours. Mean ± SEM of n = 3 biological replicates is shown (unpaired two-tailed Student t test). K, ELISA of human IFNγ and IL2 levels in CM derived from HCC827GR6 cell lines with Scramble or CD73 sgRNA pretreated ± PEM for 48 hours with J76 cells transduced with LMP2B TCR for 72 hours and pretreated ±1 μg/mL peptides (SSCSSCPLSK) for 3 hours. Mean ± SEM of n = 3 biological replicates is shown (unpaired two-tailed Student t test). L, Schematic of treatment strategy on in MET-driven EGFR-TKI–resistant cells. *, P < 0.05; **, P < 0.005; ***, P < 0.001; n.s., nonsignificant.

Similar articles

Cited by

References

    1. Kwon J, Bakhoum SF. The cytosolic DNA-sensing cGAS-STING pathway in cancer. Cancer Discov 2020;10:26–39. - PMC - PubMed
    1. Soria JC, Ohe Y, Vansteenkiste J, Reungwetwattana T, Chewaskulyong B, Lee KH, et al. Osimertinib in untreated EGFR-mutated advanced non-small-cell lung cancer. N Engl J Med 2018;378:113–25. - PubMed
    1. Le X, Puri S, Negrao MV, Nilsson MB, Robichaux J, Boyle T, et al. Landscape of EGFR-dependent and -independent resistance mechanisms to osimertinib and continuation therapy beyond progression in EGFR-mutant NSCLC. Clin Cancer Res 2018;24:6195–203. - PMC - PubMed
    1. Nagano T, Tachihara M, Nishimura Y. Mechanism of resistance to epidermal growth factor receptor-tyrosine kinase inhibitors and a potential treatment strategy. Cells 2018;7:212. - PMC - PubMed
    1. DaSilva JO, Yang K, Surriga O, Nittoli T, Kunz A, Franklin MC, et al. A biparatopic antibody-drug conjugate to treat MET-expressing cancers, including those that are unresponsive to MET pathway blockade. Mol Cancer Ther 2021;20:1966–76. - PMC - PubMed

Publication types