. 2022 Oct 24;7(20):e160274.
doi: 10.1172/jci.insight.160274.

Transcriptome and DNA methylome analyses reveal underlying mechanisms for the racial disparity in uterine fibroids

Affiliations

Transcriptome and DNA methylome analyses reveal underlying mechanisms for the racial disparity in uterine fibroids

Emmanuel N Paul et al. JCI Insight. .

Abstract

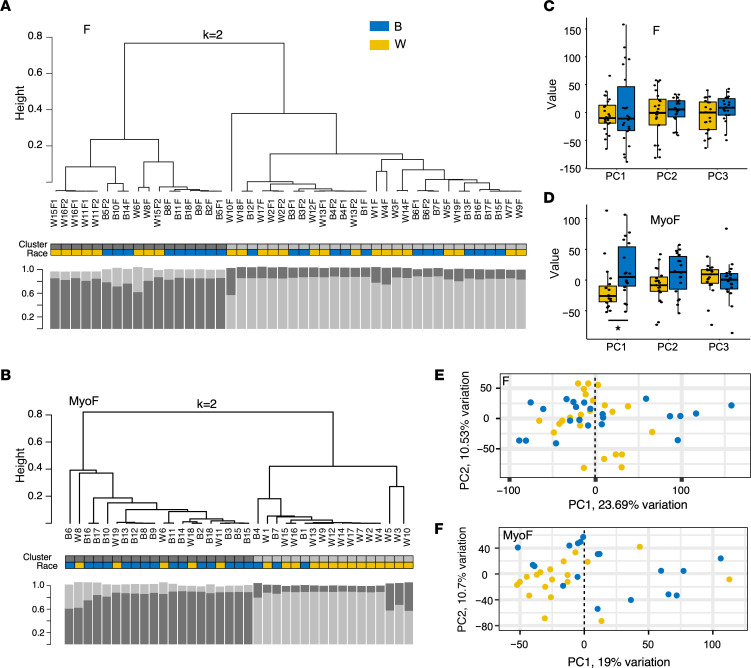
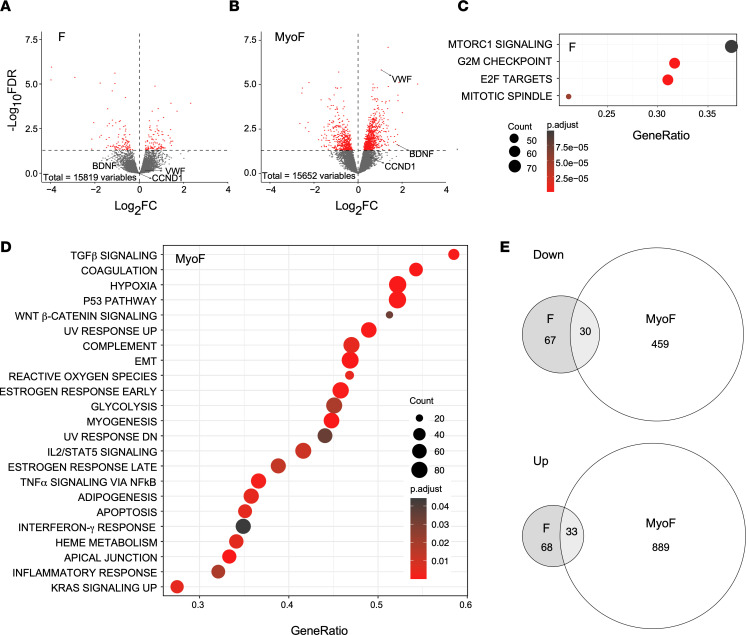
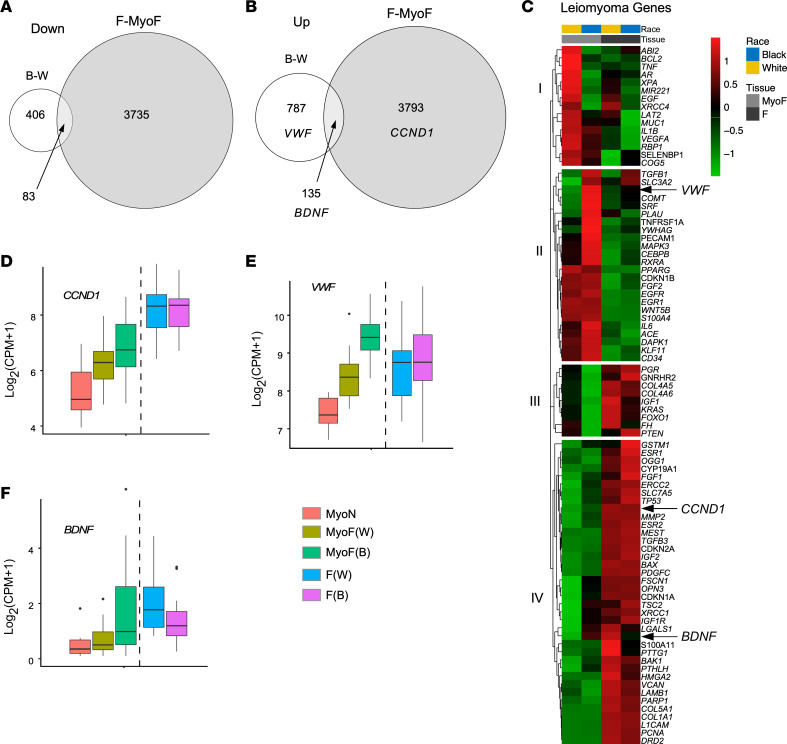
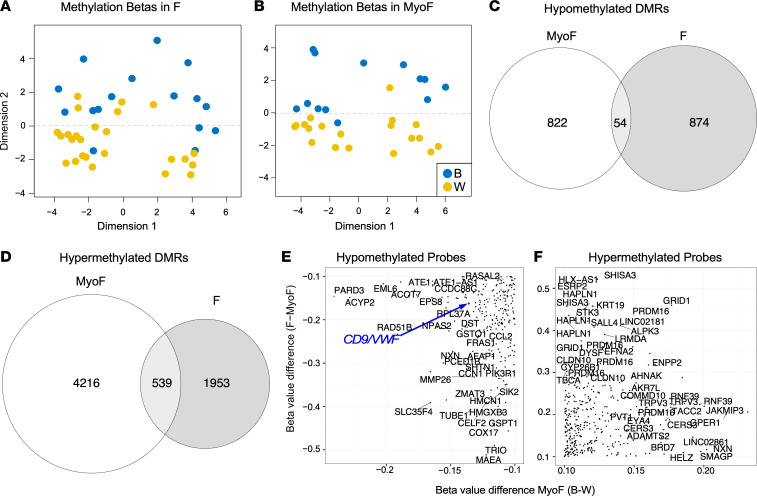
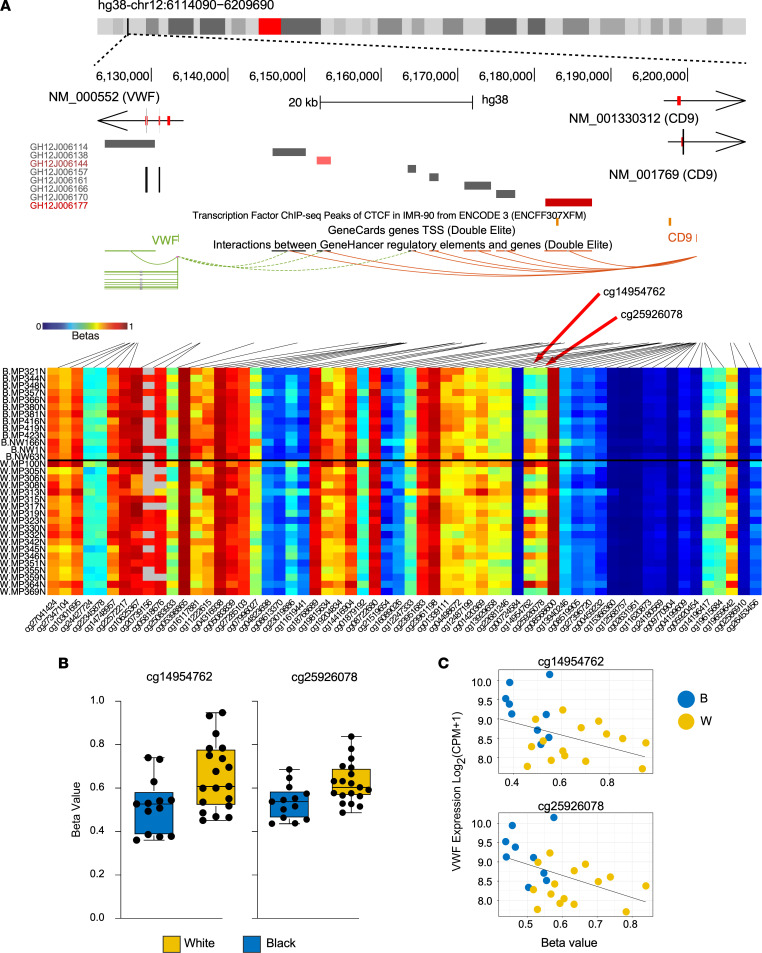
Uterine fibroids (leiomyomas) affect Black women disproportionately compared with women of other races and ethnicities in terms of prevalence, incidence, and severity of symptoms. The causes of this racial disparity are essentially unknown. We hypothesized that myometria of Black women are more susceptible to developing fibroids, and we examined the transcriptomic and DNA methylation profiles of myometria and fibroids from Black and White women for comparison. Myometrial samples cluster by race in both their transcriptome and DNA methylation profiles, whereas fibroid samples only cluster by race in the latter. More differentially expressed genes (DEGs) were detected in the Black and White myometrial sample comparison than in the fibroid comparison. Leiomyoma gene set expression analysis identified 4 clusters of DEGs, including a cluster of 24 genes with higher expression in myometrial samples from Black women. One of the DEGs in this group, von Willibrands factor (VWF), was significantly hypomethylated in both myometrial samples from Black women and in all fibroids at 2 CpG probes that are near a putative enhancer site and that are correlated with VWF expression levels. These results suggest that the molecular basis for the disparity in fibroid disease between Black and White women could be found in the myometria before fibroid development and not in the fibroids themselves.

Keywords: Epigenetics; Molecular genetics; Obstetrics/gynecology; Reproductive Biology.


Conflict of interest statement

Conflict of interest: The authors have declared that no conflict of interest exists.

Figures

Figure 1
Figure 1. Race-based clustering of RNA-Seq results from myometrial and fibroid samples.
(A and B) Whereas unsupervised hierarchical k = 2 means clustering of RNA-Seq results from MED12mt fibroid samples (n = 24 F White and n = 22 F Black) is not significantly associated with race (Fisher’s exact test, P = 0.76) (A), the results from myometrial samples (n = 19 MyoF White and n = 18 MyoF Black) show an association with race (Fisher’s exact test, P = 8.3 × 10⁻⁴) (B). The length of each leaf in the dendrograms indicates degree of dissimilarity. Race of each sample is color coded as indicated. The clusters are shown above the race. Spearman bootstrap analyses (1,000×) are shown below each dendrogram for each sample. The y axis of bootstrap columns indicates stability of clustering. (C and D) Box plots of the first 3 principal components (PC) of RNA-Seq results from Black and White F (C) and MyoF (D). The value of each sample represents the individual gene expression values transformed by the rotation matrix estimated from the PCA. Only PC1 in MyoF are significantly different (likelihood ratio test, *P = 0.03). (E and F) PC plot analyses for PC1 versus PC2 of F (E) and MyoF (F) shows samples from White and Black women in 2-dimensional space. Each dot represents 1 sample.
Figure 2
Figure 2. Differential gene expression by race in F and MyoF samples.
Fibroids (F) from n = 22 Black and n = 24 White women, and matching myometrium (MyoF) from n = 18 Black and n = 19 White women, were compared. (A and B) Volcano plots showing the up- and downregulated genes with a FDR P value < 0.05 depicted as red dots in F (A) and MyoF (B). (C and D) Gene set enrichment analysis of expressed genes using Hallmark biological processes in MSigDB from the comparison of the F (C) or MyoF (D) samples from Black and White women. Gene count and significance level are shown by the size and color of each circle. (E) Venn diagrams illustrate the overlap of the down- and upregulated genes between Black MyoF compared with White MyoF samples and Black F compared with White F samples. Hypergeometric tests of the overlaps between the 2 comparisons of the 33 upregulated and 30 downregulated sets of overlapping genes were not significant (P > 0.99 for both).
Figure 3
Figure 3. Transcriptomic similarities in fibroids (F) from all women and Black women’s matched myometria (MyoF).
(A and B) Venn diagrams illustrate the overlapping downregulated (A) and upregulated (B) differentially expressed genes (DEGs) between MyoF from Black women (n = 18) and MyoF from White women (n = 19) and between F (Black and White combined, n = 46) and MyoF (Black and White combined, n = 37). Hypergeometric testing revealed that the overlaps were significant, with P = 9.0 × 10⁻⁵ for the downregulated genes and P = 1.9 × 10⁻¹⁴ for the upregulated genes. (C) Heatmap of the leiomyoma gene set from Disease Ontology with added BDNF, using the average log2(CPM + 1) of each group: MyoF White, MyoF Black, F White (each n = 24), and F Black (n = 22). Color gradient represents gene expression levels as Z scores. (DF) Box plot of CCND1 (D), VWF (E), and BDNF (F) of myometrium from White nonfibroid women (MyoN) (n = 6), MyoF from White (n = 19), or Black (n = 18) women and F from White (n = 24) or Black (n = 22) women. Gene expression is shown as log2(CPM + 1). FDR P values for each comparison are reported in the Table 1.
Figure 4
Figure 4. DNA methylation profiles of fibroids (F) and matched myometria (MyoF) from Black and White women.
DNA methylation in the samples was determined using the Illumina MethylationEPIC Beadchip microarray. (A and B) Multidimension scaling plots of β values for fibroids (F) from Black (n = 16) and White (n = 25) women (A) and matching myometrial samples (MyoF) from Black (n = 13) and White (n = 19) women (B). Each dot represents an individual sample. Significant methylation differences by race were determined by the likelihood ratio test; P = 2.7 × 10⁻⁵ for F and P = 2.2 × 10⁻¹⁶ for MyoF. (C and D) Gene-associated differentially methylated regions (DMRs) for the Black and White race comparisons of MyoF and F samples are shown in a Venn diagram as hypomethylated (C) or hypermethylated (D), with the overlap in the circles indicating shared DMRs. Hypergeometric testing of the overlaps in C and D reveal that they were statistically significant (P = 2.6 × 10⁻⁹ and 2.3 × 10–66, respectively). (E and F) The congruent hypomethylated (E) and hypermethylated (F) EPIC CpG probes in the Black and White MyoF and the MyoF and F comparisons (>10%) are shown plotted with randomly displayed gene names. A CD9/VWF-associated probe is highlighted in blue.
Figure 5
Figure 5. VWF gene hypomethylation correlates with increased gene expression.
(A) UCSC genome browser view of the VWF gene locus, coupled with the DNA methylation β values for this region, shown as a heatmap (columns, CpGs; rows, samples grouped by race). Top UCSC tracks include locations CTCF ChIP-Seq peaks in IMR-90 cells from ENCODE (in orange) and predicted cis-regulatory elements provided by GeneHancer. The heatmap shows the CpG methylation in the VWF gene. (B) Box and whisker plots show the median and range of β values in Black and White MyoF for the 2 probes identified in A. Means for probes are significantly different by 2-tailed t test (P = 0.01 for both). (C) β Values (x axis) and VWF expression (y axis) show that β value is negatively correlated with expression in the MyoF samples (r2 = 0.19 for cg14954762 and r2 = 0.21 for cg25926078; P = 0.03 for both).

References

    1. Baird DD, et al. High cumulative incidence of uterine leiomyoma in black and white women: ultrasound evidence. Am J Obstet Gynecol. 2003;188(1):100–107. doi: 10.1067/mob.2003.99. - DOI - PubMed
    1. Baird DD, et al. Uterine fibroid incidence and growth in an ultrasound-based, prospective study of young African Americans. Am J Obstet Gynecol. 2020;223(3):402.e1–402.e18. doi: 10.1016/j.ajog.2020.02.016. - DOI - PMC - PubMed
    1. Eltoukhi HM, et al. The health disparities of uterine fibroid tumors for African American women: a public health issue. Am J Obstet Gynecol. 2014;210(3):194–199. doi: 10.1016/j.ajog.2013.08.008. - DOI - PMC - PubMed
    1. Donnez J, Dolmans MM. Uterine fibroid management: from the present to the future. Hum Reprod Update. 2016;22(6):665–686. doi: 10.1093/humupd/dmw023. - DOI - PMC - PubMed
    1. Stewart EA, et al. Uterine fibroids. Nat Rev Dis Primers. 2016;2:16043. doi: 10.1038/nrdp.2016.43. - DOI - PubMed

Publication types

Substances