. 2022 Nov 1;132(21):e152418.
doi: 10.1172/JCI152418.

CD69 expression on regulatory T cells protects from immune damage after myocardial infarction

Affiliations

CD69 expression on regulatory T cells protects from immune damage after myocardial infarction

Rafael Blanco-Domínguez et al. J Clin Invest. .

Abstract

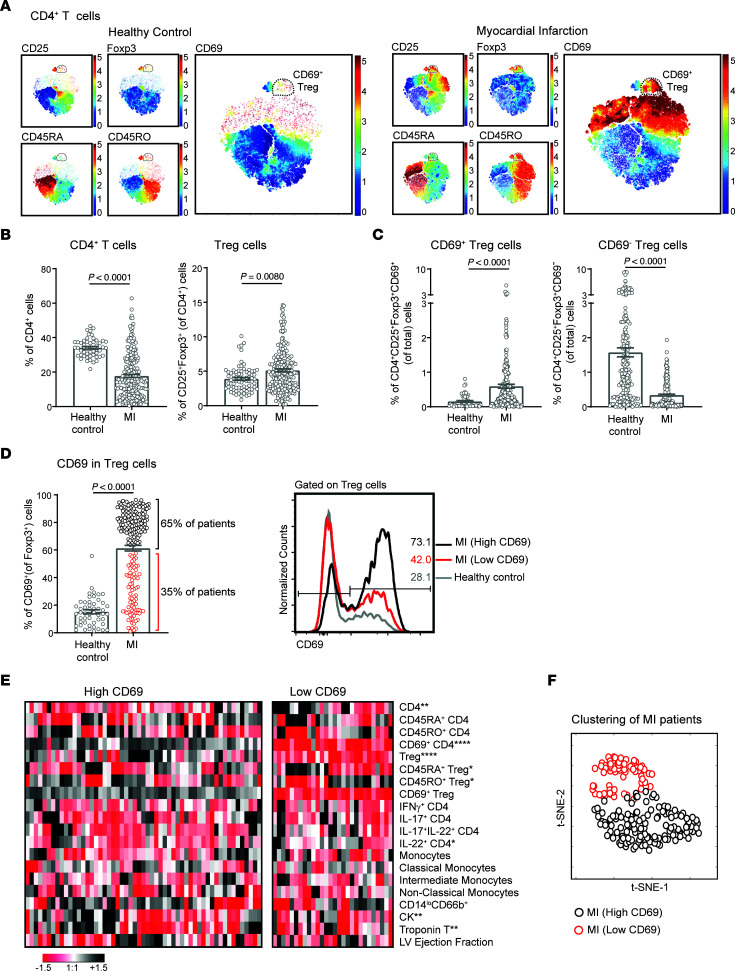
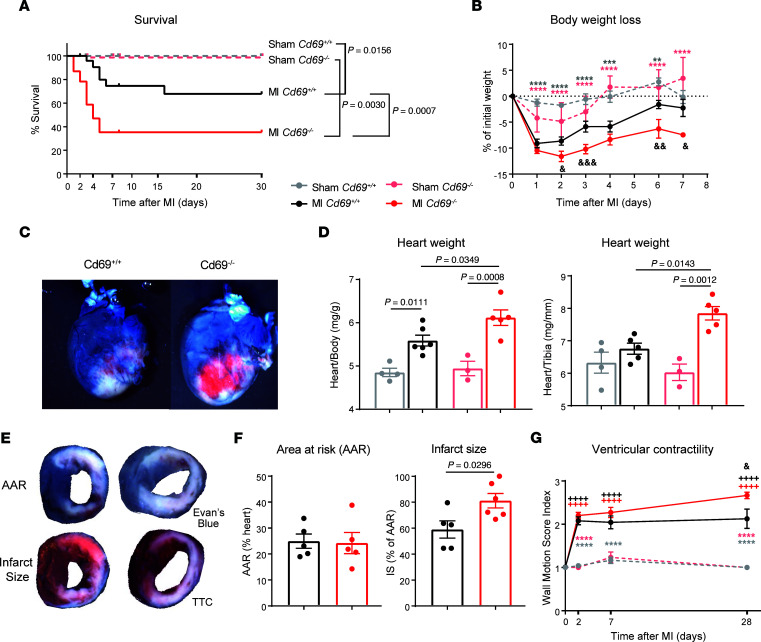
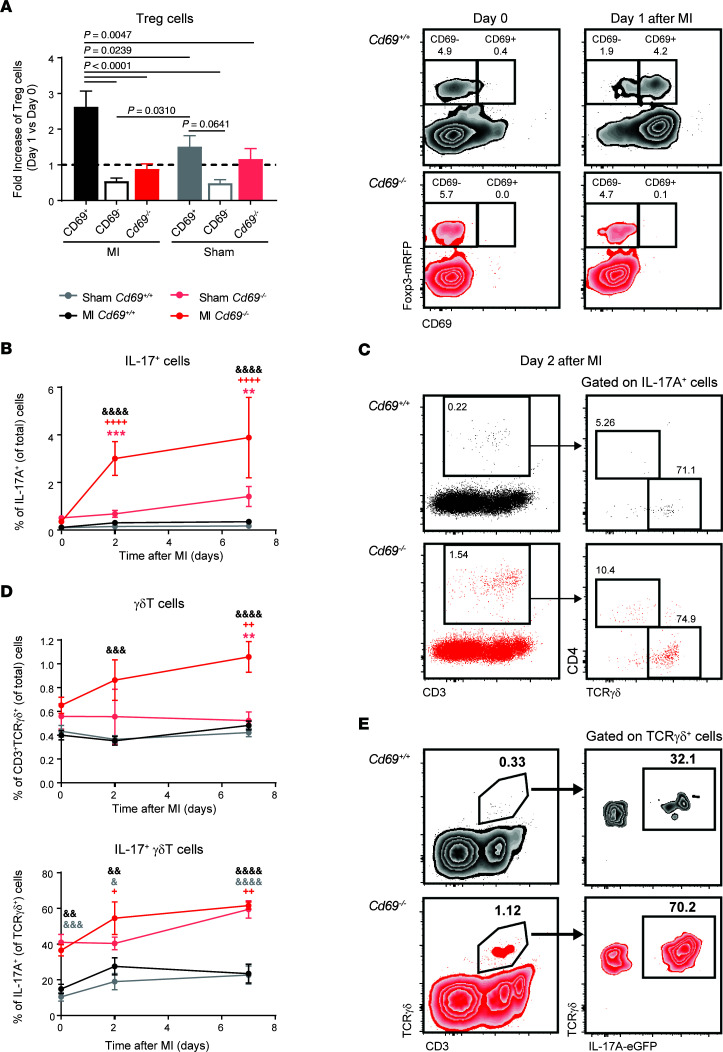
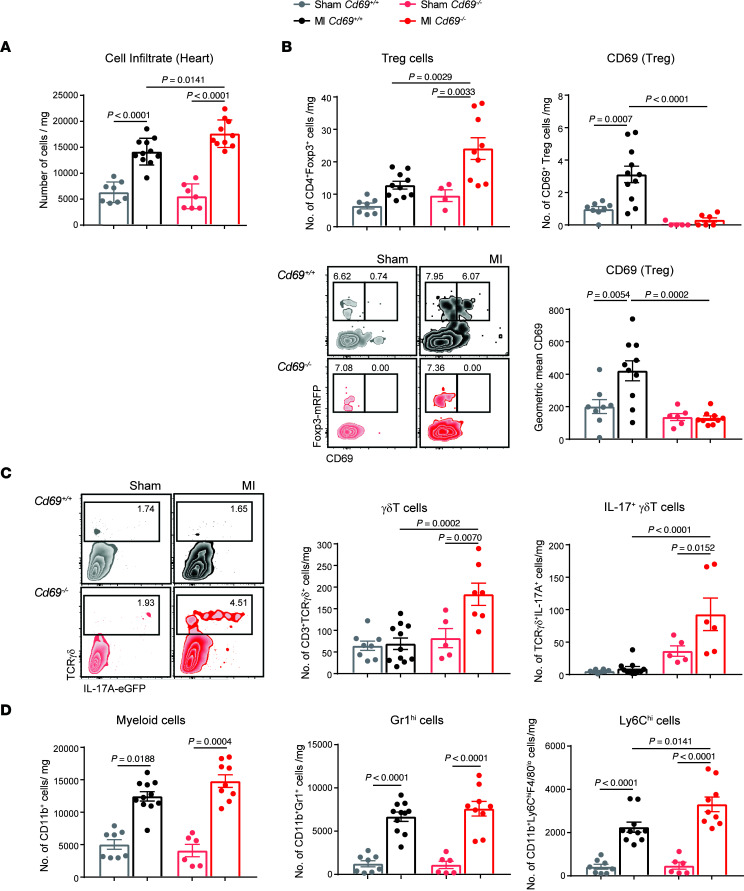
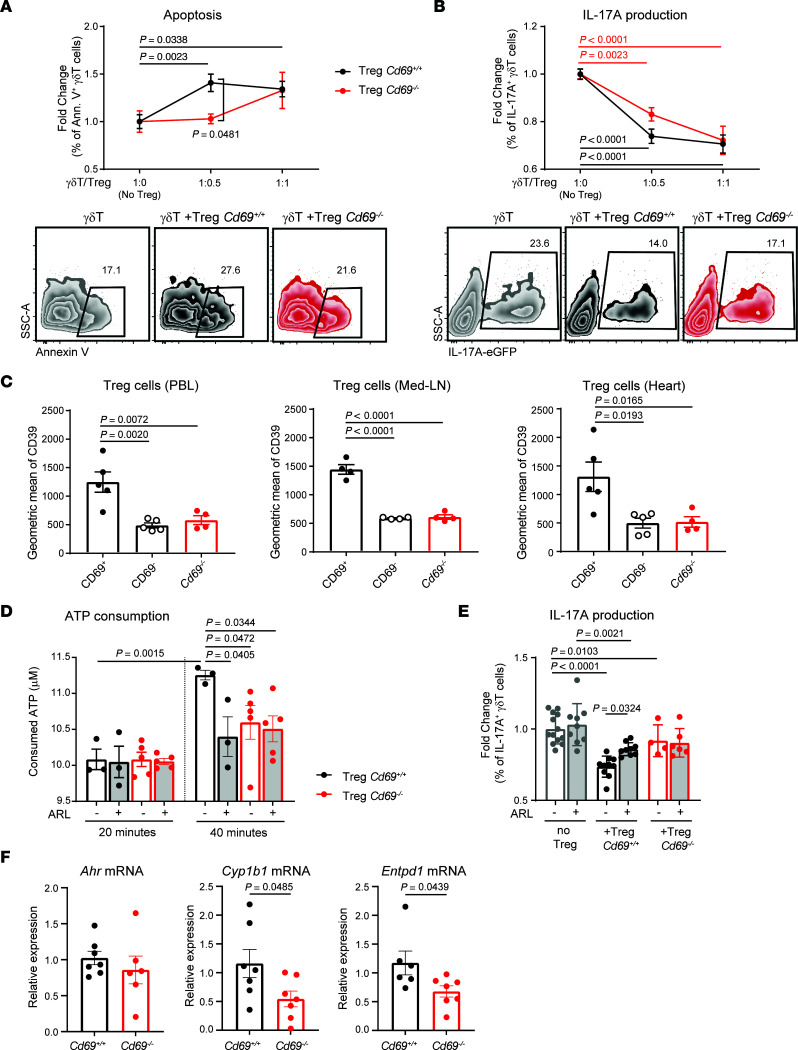
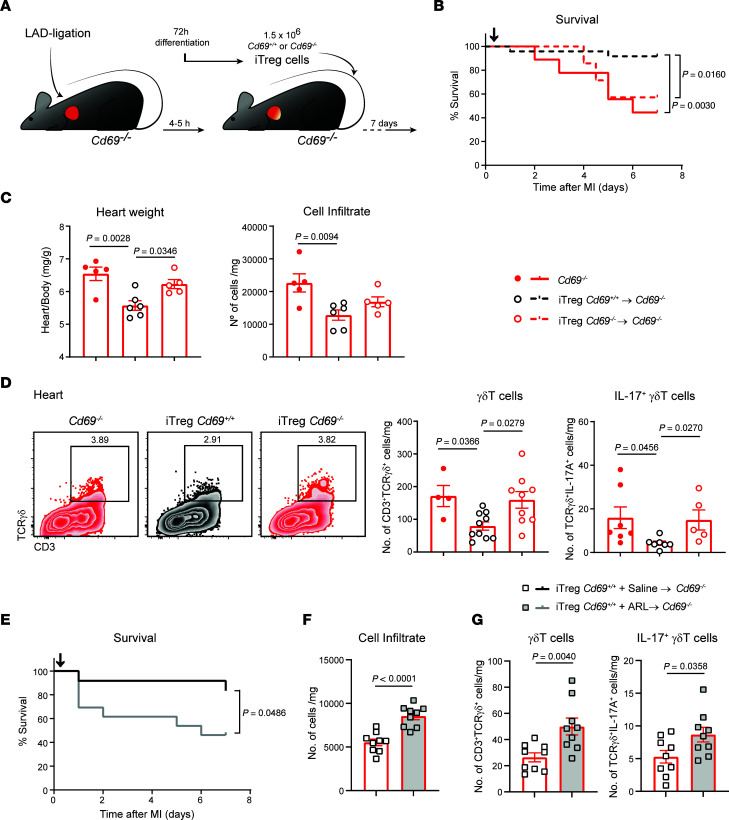
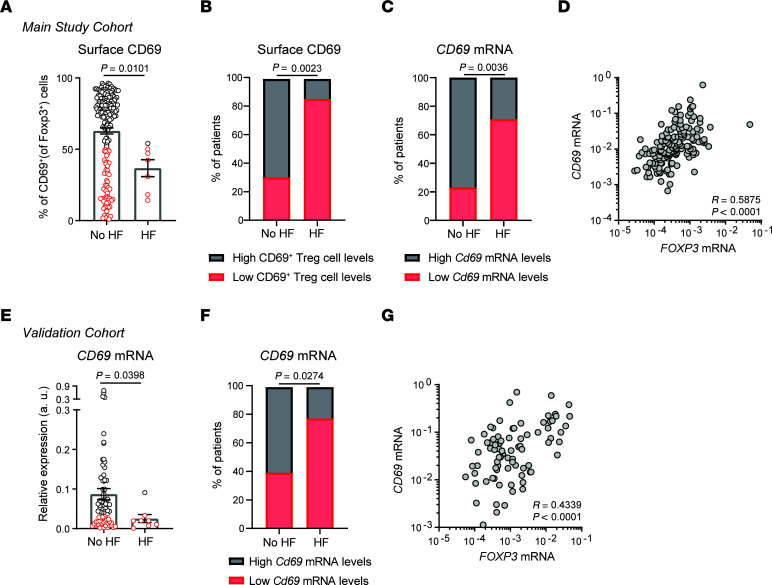
Increasing evidence has pointed to the important function of T cells in controlling immune homeostasis and pathogenesis after myocardial infarction (MI), although the underlying molecular mechanisms remain elusive. In this study, a broad analysis of immune markers in 283 patients revealed significant CD69 overexpression on Tregs after MI. Our results in mice showed that CD69 expression on Tregs increased survival after left anterior descending (LAD) coronary artery ligation. Cd69-/- mice developed strong IL-17+ γδT cell responses after ischemia that increased myocardial inflammation and, consequently, worsened cardiac function. CD69+ Tregs, by induction of AhR-dependent CD39 ectonucleotidase activity, induced apoptosis and decreased IL-17A production in γδT cells. Adoptive transfer of CD69+ Tregs into Cd69-/- mice after LAD ligation reduced IL-17+ γδT cell recruitment, thus increasing survival. Consistently, clinical data from 2 independent cohorts of patients indicated that increased CD69 expression in peripheral blood cells after acute MI was associated with a lower risk of rehospitalization for heart failure (HF) after 2.5 years of follow-up. This result remained significant after adjustment for age, sex, and traditional cardiac damage biomarkers. Our data highlight CD69 expression on Tregs as a potential prognostic factor and a therapeutic option to prevent HF after MI.

Keywords: Cardiology; Cardiovascular disease; Heart failure; Immunology; T cells.


Conflict of interest statement

Conflict of interest: The authors have declared that no conflict of interest exists.

Figures

Figure 1
Figure 1. Patients with MI have a strong peripheral CD69+ Treg response.
(A) t-SNE plots of CD4+ T cells from PBLs from a representative healthy control and a patient with MI, considering the indicated markers measured by FACS. Color bars indicate the relative intensity of the markers. Dots represent individual cells. (B) Quantification of the percentages of CD4+ T cells and CD4+CD25+Foxp3+ Tregs in peripheral blood from healthy donors (n = 51) and patients with MI (n = 215) at the time of hospital admission. (C) Percentages of CD69+ Tregs and CD69 Tregs among total PBLs. (D) CD69 expression on Tregs, quantified as the percentage of CD69+ cells after gating on Tregs. Two groups of patients with MI were differentiated according to CD69 expression: patients with high levels of CD69 (High CD69), shown as black circles, and patients with low levels (Low CD69), shown as red circles. Representative histograms and percentages of CD69 expression on Tregs are shown. In BD, data indicate the mean ± SEM, and significance was analyzed by Mann-Whitney U test. (E) Heatmap shows the levels of different cell populations analyzed by FACS and cardiac damage markers in patient with MI expressing high levels of CD69 and low levels of CD69. Each column represents 1 patient. Data were normalized by subtracting the mean and dividing by the SD. Color bar denotes the relative levels of each parameter, with black indicating high expression and red indicating low expression. Differences between patients with CD69hi and CD69lo expression were analyzed by Mann-Whitney U test; *P < 0.05, **P < 0.01, and ****P < 0.0001. (F) t-SNE plot was generated based on the percentages of cell populations shown in E and analyzed by FACS. Circles represent individual patients with MI. Black circles indicate patients with MI who had high CD69 expression, and red circles indicate patients with low CD69 expression.
Figure 2
Figure 2. CD69 deficiency worsens heart damage and decreases survival after MI in mice.
(A) Survival curve of mice after LAD ligation (n = 23–29 MI mice, n = 11–20 sham-operated mice). Data were pooled from 5 independent experiments and were analyzed by long-rank (Mantel-Cox) test. (B) Kinetics of the percentage of body weight loss after LAD ligation (n = 9–17 mice). Data represent the mean ± SEM and were analyzed by 2-way ANOVA with Šidák’s multiple-comparison test. (C) Representative images of infarcted hearts collected after intravenous injection of Evans blue dye 2 days after surgery. (D) Heart weight was normalized to body weight and tibia length 2 days after LAD ligation (n = 3–4 sham-operated mice; n = 5–6 MI mice). Data are representative of 3 independent experiments and indicate the mean ± SEM. Statistical significance was analyzed by 1-way ANOVA with Tukey’s post hoc test. (E) Representative images of heart slices showing the AAR (negative for Evans blue dye) in the upper panels and the extent of necrosis (negative for TTC staining) in the lower panels. (F) Histological quantification of the percentage of the LV AAR and the percentage of infarct size (IS) (n = 5–6 mice). Data are expressed as the mean ± SEM and were analyzed by unpaired Student’s t test. (G) Time course of LV dysfunction according to the WMSI measured by echocardiography (n = 6–16 MI mice, n = 4–8 sham-operated mice). Data were pooled from 3 independent experiments, represent the mean ± SEM, and were analyzed by 2-way ANOVA with Šidák’s multiple-comparison test. Asterisks denote differences between MI and sham-operated mice (light gray for Cd69+/+ mice, light red for Cd69–/– mice); ampersands denote differences between Cd69+/+ and Cd69–/– MI mice; plus signs denote differences between each day and day 0. &P < 0.05, **/&&P < 0.01, ***/&&&P < 0.001, and ****/++++P < 0.0001.
Figure 3
Figure 3. Treg and IL-17A responses in the blood of mice after LAD ligation.
(A) Fold increase of the percentages of wild-type CD69+ Tregs, wild-type CD69 Tregs, and Cd69–/– Tregs among CD4+ cells in peripheral blood 1 day after LAD ligation or sham surgery, compared with the percentages on day 0 (dotted line). Representative density plots of Tregs on day 0 and day 1 after MI are shown on the right (n = 10–20). Histograms indicate the mean ± SEM, and data were analyzed by 1-way ANOVA with Tukey’s post hoc test. (B) Kinetics of IL-17A+ cells in peripheral blood after surgery, expressed as a percentage of total cells. (C) Left: Representative dot plots of IL-17A+ cells, with the percentages of total cells indicated in the outlined box. Right: Representative dot plots showing the main cell populations positive for IL-17A. (D). Kinetics of the percentages of γδT cells and IL-17+ γδT cells in peripheral blood after LAD ligation or sham surgery. (E) Representative density plots of γδT cells in peripheral blood, with the percentages of cells indicated in the outlined box. Data in B and D are representative of 4 independent experiments and indicate the mean ± SEM (n = 6–10). Statistical significance was analyzed by 2-way ANOVA with Šidák’s multiple-comparison test. Asterisks denote differences between MI and sham-operated mice (light gray for Cd69+/+ mice, light red for Cd69–/– mice); ampersands denote differences between Cd69+/+ and Cd69–/– MI mice; plus signs denote differences between each day and day 0. +/&P < 0.05, **/++/&&P < 0.01, ***/&&&P < 0.001, and ++++/&&&&P < 0.0001.
Figure 4
Figure 4. Myocardial accumulation of CD69+ Tregs and Il-17+ γδT cells after LAD ligation.
(A) Leukocyte cell numbers per milligram of heart tissue in the myocardium 2 days after infarction. (B) Quantification of the number of Tregs (CD4+Foxp3+) and CD4+Foxp3+CD69+ cells per milligram of heart tissue and CD69 mean fluorescence expression on Tregs in the heart. Representative density plots showing gating on CD45+CD11bCD4+ cells. (C) Representative density plots gated on CD45+CD11bCD3+ cells and numbers of γδT cells and Il-17+ γδT cells per milligram of tissue. (D) Quantification of total cell numbers per milligram of CD11b+ myeloid cells, CD11b+Gr1hi cells, and CD11b+F4/80loLy6Chi cells in the heart. Heart cell–infiltrating populations were evaluated 2 days after infarction (n = 6–11 animals per group). Data are representative of 4 independent experiments and indicate the mean ± SEM. Statistical significance was analyzed by 1-way ANOVA with Tukey’s post hoc test. P values for significant differences are shown.
Figure 5
Figure 5. Expression of CD39 by CD69+ Tregs after MI mediates the inhibition of γδΤ cells.
(A) Sorted wild-type γδT cells were cocultured for 24 hours with Cd69+/+ or Cd69–/– sorted Tregs at the indicated γδT/Treg ratios. Apoptosis of γδT cells, represented as the fold increase of annexin V+ (Ann. V+) γδT cells versus γδT cells alone (ratio 1:0) (n = 4–10). A representative zebra plot of the 1:0.5 ratio, gated on γδT cells is shown. (B) Inhibition of IL-17A production by γδT cells, plotted as the fold change of IL-17A+ γδT cells for each ratio versus the 1:0 ratio (n = 6–12). Representative zebra plots of the 1:0.5 ratio, gated on γδT cells, are shown. Data in A and B were pooled from 4 independent experiments. Data indicate the mean ± SEM. Statistical significance was determined by 2-way ANOVA with Sidak’s multiple-comparison test. Significant P values are shown (black for Cd69+/+ Tregs and red for Cd69–/– Tregs). (C) CD39 expression on Tregs in PBLs, mediastinal lymph nodes (Med-LN), and heart was measured by FACS, 2 days after MI (n = 4–5). Data indicate the mean ± SEM. Statistical significance was determined by 1-way ANOVA with Tukey’s post hoc test. (D) Extracellular ATP was measured in the supernatant of isolated Tregs, in the presence or absence of ARL 67156 (ARL) at the indicated time points after ATP supplementation (n = 3–5). Data are from 1 representative independent experiment of 4 experiments and indicate the mean ± SEM. Statistical significance was determined by mixed-effects 2-way ANOVA with Šidák’s multiple-comparison test. (E) IL-17A production by sorted γδT cells in the presence of Tregs and/or ARL 67156, fold change versus the percentage of IL-17A+ γδT cells alone (n = 3–7). Data are representative of 3 independent experiments and indicate the mean ± SEM. Statistical significance was determined by 2-way ANOVA with Šidák’s multiple-comparison test. (F) Quantification of Ahr, Cyp1b1, and Entpd1 mRNA levels in Tregs by qPCR (n = 6–7). Data were pooled from 2 independent experiments and represent the mean ± SEM. Statistical significance was determined by unpaired Student’s t test.
Figure 6
Figure 6. Adoptive transfer of CD69-sufficient Tregs into Cd69–/– mice reduces myocardial inflammation and improves survival after MI.
(A) Schematic workflow of the iTreg adoptive transfer after LAD ligation. (B) Survival after LAD ligation (n = 7–24). Black arrow depicts the time of iTreg inoculation (4–5 hours after infarction). Cd69–/– mice without cell transfer were used as controls. The P value was calculated by long-rank (Mantel-Cox) test. (C) Heart/body weight ratio and total leukocyte numbers per milligram of heart tissue 7 days after LAD ligation (n = 5–6). (D) Representative density plots (gated on CD45+CD11b cells) and numbers of γδT cells and IL-17+ γδT cells per milligram of myocardial tissue. Data in C and D correspond to 1 representative independent experiment of 3 experiments. Data indicate the mean ± SEM and were analyzed by 1-way ANOVA with Tukey’s post hoc test. (E) Survival after LAD ligation (n = 12–13), Cd69+/+ iTreg transfer, and ARL 67156 or saline administration. Black arrow depicts the time of iTreg inoculation (4–5 hours after infarction). The P value was calculated by long-rank (Mantel-Cox) test. (F) Total leukocyte numbers per milligram of heart tissue 7 days after LAD ligation (n = 9). (G) Numbers of γδT cells and IL-17+ γδT cells per milligram of myocardial tissue (n = 9). Data in F and G were pooled from 4 independent experiments and indicate the mean ± SEM. Statistical significance was determined by unpaired Student’s t test.
Figure 7
Figure 7. High CD69 expression in patients early after MI is associated with a decreased risk of developing HF.
(A) After 2.5 years of clinical follow-up, patients from the main study cohort were stratified according to whether or not they developed HF. CD69 expression on Tregs at the time of hospital admission for acute MI in patients who developed HF (n = 7) or did not develop HF (n = 180). Data were analyzed by Mann-Whitney U test. (B) Percentage of patients with low or high levels of surface CD69 expression on Tregs, measured by FACS in the main study cohort. The P value was calculated using a χ2 test. (C) Frequency of patients with low or high levels of CD69 mRNA expression, measured by qPCR in the main study cohort (the mean normalized CD69 2–ΔCt values were used to discriminate patients expressing low or high levels of CD69). (D) Correlation of FOXP3 and CD69 mRNA expression in PBLs from individuals in the main study cohort. Spearman’s correlation coefficient (r) and P values are shown. (E) CD69 mRNA levels measured by qPCR in total PBLs from the independent validation cohort of patients (n = 75 with no HF and n = 9 with HF). Data were analyzed by Mann-Whitney U test. (F) Frequency of patients with low or high levels of CD69 mRNA, measured by qPCR in the validation cohort (the mean normalized CD69 2–ΔCt values were used to discriminate patients with low or high CD69 expression). The P value was calculated using a χ2 test. (G) Correlation of FOXP3 and CD69 mRNA expression in PBLs from individuals in the validation cohort. Spearman’s correlation coefficient (r) and P values are shown.

References

    1. Swirski FK, Nahrendorf M. Leukocyte behavior in atherosclerosis, myocardial infarction, and heart failure. Science. 2013;339(6116):161–166. doi: 10.1126/science.1230719. - DOI - PMC - PubMed
    1. Swirski FK, Nahrendorf M. Cardioimmunology: the immune system in cardiac homeostasis and disease. Nat Rev Immunol. 2018;18(12):733–744. doi: 10.1038/s41577-018-0065-8. - DOI - PubMed
    1. Hofmann U, et al. Activation of CD4+ T lymphocytes improves wound healing and survival after experimental myocardial infarction in mice. Circulation. 2012;125(13):1652–1663. doi: 10.1161/CIRCULATIONAHA.111.044164. - DOI - PubMed
    1. Hofmann U, Frantz S. Role of T-cells in myocardial infarction. Eur Heart J. 2016;37(11):873–879. doi: 10.1093/eurheartj/ehv639. - DOI - PubMed
    1. Weiß E, et al. Myocardial-Treg crosstalk: how to tame a wolf. Front Immunol. 2022;13:914033. doi: 10.3389/fimmu.2022.914033. - DOI - PMC - PubMed

Publication types