. 2023 Jan 27;32(4):580-594.
doi: 10.1093/hmg/ddac225.

Germline homozygous missense DEPDC5 variants cause severe refractory early-onset epilepsy, macrocephaly and bilateral polymicrogyria

Affiliations

Germline homozygous missense DEPDC5 variants cause severe refractory early-onset epilepsy, macrocephaly and bilateral polymicrogyria

Athina Ververi et al. Hum Mol Genet. .

Abstract

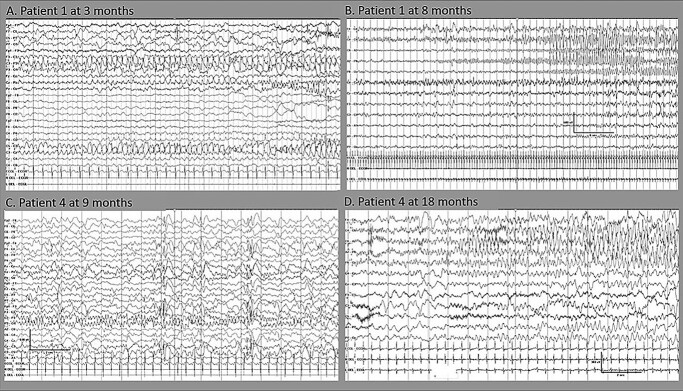
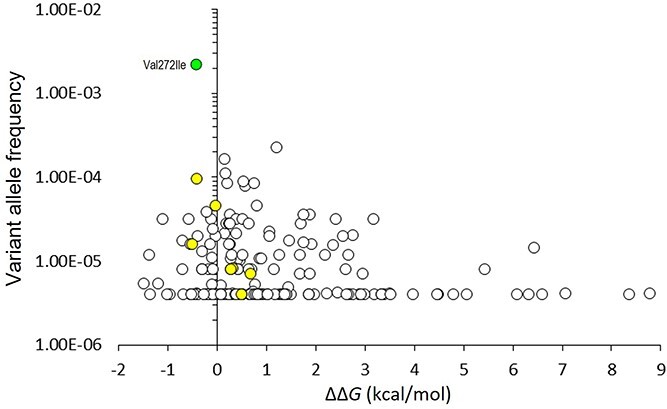
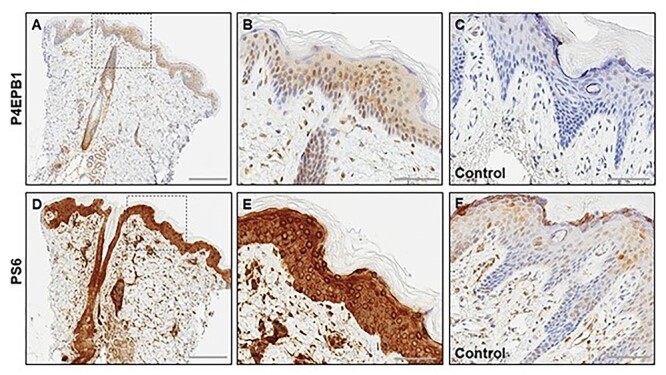
DEPDC5 (DEP Domain-Containing Protein 5) encodes an inhibitory component of the mammalian target of rapamycin (mTOR) pathway and is commonly implicated in sporadic and familial focal epilepsies, both non-lesional and in association with focal cortical dysplasia. Germline pathogenic variants are typically heterozygous and inactivating. We describe a novel phenotype caused by germline biallelic missense variants in DEPDC5. Cases were identified clinically. Available records, including magnetic resonance imaging and electroencephalography, were reviewed. Genetic testing was performed by whole exome and whole-genome sequencing and cascade screening. In addition, immunohistochemistry was performed on skin biopsy. The phenotype was identified in nine children, eight of which are described in detail herein. Six of the children were of Irish Traveller, two of Tunisian and one of Lebanese origin. The Irish Traveller children shared the same DEPDC5 germline homozygous missense variant (p.Thr337Arg), whereas the Lebanese and Tunisian children shared a different germline homozygous variant (p.Arg806Cys). Consistent phenotypic features included extensive bilateral polymicrogyria, congenital macrocephaly and early-onset refractory epilepsy, in keeping with other mTOR-opathies. Eye and cardiac involvement and severe neutropenia were also observed in one or more patients. Five of the children died in infancy or childhood; the other four are currently aged between 5 months and 6 years. Skin biopsy immunohistochemistry was supportive of hyperactivation of the mTOR pathway. The clinical, histopathological and genetic evidence supports a causal role for the homozygous DEPDC5 variants, expanding our understanding of the biology of this gene.


Figures

Figure 1
Figure 1
Family trees for Families 1–5.
Figure 2
Figure 2
MRI brain imaging from eight affected individuals. Patient 1: MRI at 16 days. T1 and T2 axial images (A–C) showing extensive bilateral frontal and perisylvian polymicrogyria and dysgyria (white arrows) with dysmorphic basal ganglia (black arrow in A). Right occipital plagiocephaly is also seen (double arrows). Midline T1 sagittal image (C) shows thin and posteriorly drooping morphology of the corpus callosum (black arrow), hypoplastic pons (white arrow), as well as inferiorly pointed morphology of the cerebellar tonsil (double arrows). Macrocephaly and frontal bossing with large volume of frontal lobes are also apparent. Patient 2: Fetal MRI at 30 + 3 weeks of gestation. T2 axial images (A, B) showing bilateral polymicrogyria with predominant anterior involvement (white arrows). Cystic changes of the ganglionic eminence are noted (black arrow). There is corresponding restricted diffusion in DWI images (C) shown by the white arrow. The biparietal diameter and head circumference (measurements not shown) correspond to 35 weeks, suggestive of macrocephaly. Midline T2 sagittal image (D) shows a small volume pons (white arrow). The corpus callosum is fully formed (black arrow). The frontal lobes are relatively large in size. Patient 3: MRI at 7w 5d. T2 axial images (A, B) and T1 parasagittal image(C) showing extensive bilateral frontal and polymicrogyria like cortex and dysgyria (white arrows) with dysmorphic basal ganglia (black arrow in A). Midline T1 sagittal image (D) shows thin and posteriorly drooping morphology of the corpus callosum (black arrow) and hypoplastic pons (white arrow). Patient 4: MRIs at 3 months and repeated at 10 months. T2 axial image and midline T1 sagittal image (A, B) at 3 months show macrocephaly with frontal and anterior perisylvian polymicrogyria (white arrows in A). Mild posterior drooping morphology of the corpus callosum is seen (black arrow in B). T2 axial image and midline T1 sagittal image at 10 months (C, D) show large frontal lobes with bilateral extensive anterior predominant polymicrogyria (white arrows in C). The basal ganglia appear dysmorphic (black arrow in C). The corpus callosum shows additional anterior thickening (white arrow in D). Right occipital plagiocephaly is seen (double arrows C). Patient 5: Available MRI images were limited and of reduced quality however T2 images (A, B, C) indicate extensive polymicrogyria-like cortex with predominant fronto-parietal distribution (white arrows). Patients 6 and 7: Show macrocephaly with frontal bossing and squared appearance of frontal bone. Dysmorphic callosum and basal ganglia are evident. Small pontine volume can also be appreciated. Patient 8: Also shows bifrontal polymicrogyria and dysmorphic callosum with anterior thickening and posterior underdevelopment as well as vertical morphology. Small volume pons and cerebellar vermis (double arrows) are appreciable. Panel C shows T2, DWI and ADC (1–3) signal changes suggestive of diffusion restriction in inferior olivary nuclei and inferior cerebellar peduncles.
Figure 3
Figure 3
Interictal EEG features of two patients with the homozygous DEPDC5 variant indicating progressive epileptic encephalopathy. Top row: Patient 1: (A) at 3 months, there is only mild excess of intermittent slow, with multifocal sharp waves (left > right) and (B) at 8 months, there is marked slowing with frequent multifocal discharges. Bottom row: Patient 4: (C) at 9 months the background activity is slow with multifocal discharges independently over both hemispheres and (D) at 18 months, the background activity shows a marked excess of slow, absence of age-appropriate sleep phenomena and multifocal sharp and slow wave and spikes.
Figure 4
Figure 4
Ictal EEG features of two patients with DEPDC5 indicating progressive epileptic encephalopathy. Top row: Patient 1 with frequent independent focal seizures during the first year of life: (A) subtle seizure characterized by eye deviation to the left with onset from the left parietal region at the age of 3 months and (B) frequent multifocal electrographic seizures at the age of 8 months which mostly had an onset from the right central region (B) or less often, from the left parietal region (not shown). Bottom row: Patient 4 with frequent independent focal seizures from either hemisphere at the age of nine and 18 months: (C) clinical seizures characterized by eye deviation to the right and left hypotonia with onset from right temporal and (D) clinical seizures characterized by subtle tonic posturing of the right hand followed by clonic movements of his right leg with onset from left posterior quadrant.
Figure 5
Figure 5
Predicted effect of p.Thr337Arg and p.Arg806Cys variants. (A) Structure of the heterotrimeric GATOR1 complex bound to Ran GTPases in the inhibitory state (PDB 7t3a). DEPDC5 is shown in ribbon format, coloured by domain: N-terminal domain (residues 38–165), dark grey; SABA domain (166–425), blue; SHEN domain (721–1010), pink; DEP domain (1175–1270), orange; C-terminal domain (1271–1600), dark green; residues Thr337 and Arg806 are coloured magenta with sidechain atoms shown as space-filling spheres; sites of previously reported pathogenic missense variants (HGMD class DM) are coloured red. Other proteins of the GATOR1 complex (NPRL2, pink; NPRL3, yellow) and Rag GTPases A (green) and C (cyan) are shown with predicted surfaces. (B) The left panel shows detail around Thr337 in PDB 7t3a chain A; sidechains atoms of Thr337, Phe343 and Asp365 are shown as space-filling spheres, with carbon atoms coloured as backbone and other atoms by type (red, oxygen); the Gln176 sidechain is shown in stick format, with the broken blue line indicating the hydrogen bond between Thr337 and Gln176 sidechains. The right panel shows the same view of the predicted structure of the p.Thr337Arg variant; the variant was predicted to be severely destabilizing (ΔΔG = 6.39 kcal/mol in PDB 7t3a), primarily due to steric clashes, introduction of a buried charge and loss of hydrogen bonding. (C) As B, but showing detail around Arg806 (left) and the p.Arg806Cys variant (right); in the left panel, the broken blue lines show hydrogen bonds from the Arg806 sidechain to those of His861 and Asp962. The p.Arg806Cys variant was also predicted to be severely destabilizing in 7t3a (ΔΔG = 5.21 kcal/mol), due to loss of hydrogen bonding, electrostatic and non-bonded interactions and unfavourable changes in polarity.
Figure 6
Figure 6
Thermodynamic impact of gnomAD missense variants on DEPDC5 structure. FoldX was used to calculate the thermodynamic impact of all missense variants in the SABA and SHEN domains as reported in gnomAD v2.1.1 and resolved in PDBs entries 7t3a, 7t3b and 7t3c (n = 185); the average ΔΔG value for each variant was plotted against gnomAD variant allele frequency; the yellow fill shows seven variants which have also been reported in HGMD in association with disease; the green fill shows p.Val272Ile, the only missense variant in structured regions of the SABA or SHEN domains which has been observed as a homozygote in gnomAD; the accepted thresholds for the thermodynamic impact of variants on protein structure are: >3 kcal/mol, severely destabilizing; 1–3 kcal/mol, destabilizing; <1 kcal/mol, neutral or benign32,33. Neither p.Thr337Arg nor p.Arg806Cys has been observed in gnomAD; for comparison, these variants yielded average ΔΔG values of 8.51 kcal/mol and 4.269 kcal/mol, respectively.
Figure 7
Figure 7
Skin biopsy (from Patient 4) with mTOR effector protein expression: (AC) P4EPB1 immunohistochemistry showing expression in the epidermis epithelial cells, adnexal structures and in the dermis (A) with higher magnification of the marked area of the epidermis highlighting expression in many keratinocytes (B), in comparison with the normal control skin (C). (DF) PS6 immunohistochemistry showing strong upregulation in the epidermis, hair follicles and the adnexal structures in the dermis (D), with higher magnification of the marked area of the epidermis highlighting diffuse expression in the epidermal cells (E), in comparison with the normal control skin (F). The control tissue in C and F is the same and is a surgical sample of normal skin from a newborn child, not expected to have mTOR overactivity.

References

    1. Laplante, M. and Sabatini, D.M. (2012) mTOR signaling in growth control and disease. Cell, 149, 274–293. - PMC - PubMed
    1. Lee, D.Y. (2015) Roles of mTOR signaling in brain development. Exp. Neurobiol., 24, 177–185. - PMC - PubMed
    1. Dibbens, L.M., deVries, B., Donatello, S., Heron, S.E., Hodgson, B.L., Chintawar, S., Crompton, D.E., Hughes, J.N., Bellows, S.T., Klein, K.M.et al. (2013) Mutations in DEPDC5 cause familial focal epilepsy with variable foci. Nat. Genet., 45, 546–551. - PubMed
    1. Ishida, S., Picard, F., Rudolf, G., Noé, E., Achaz, G., Thomas, P., Genton, P., Mundwiller, E., Wolff, M., Marescaux, C.et al. (2013) Mutations of DEPDC5 cause autosomal dominant focal epilepsies. Nat. Genet., 45, 552–555. - PMC - PubMed
    1. Baulac, S., Ishida, S., Marsan, E., Miquel, C., Biraben, A., Nguyen, D.K., Nordli, D., Cossette, P., Nguyen, S., Lambrecq, V.et al. (2015) Familial focal epilepsy with focal cortical dysplasia due to DEPDC5 mutations. Ann. Neurol., 77, 675–683. - PubMed

Publication types

Substances