

Pest population dynamics are related to a continental overwintering gradient
- PMID: 36067290
- PMCID: PMC9477387
- DOI: 10.1073/pnas.2203230119
Pest population dynamics are related to a continental overwintering gradient
Abstract
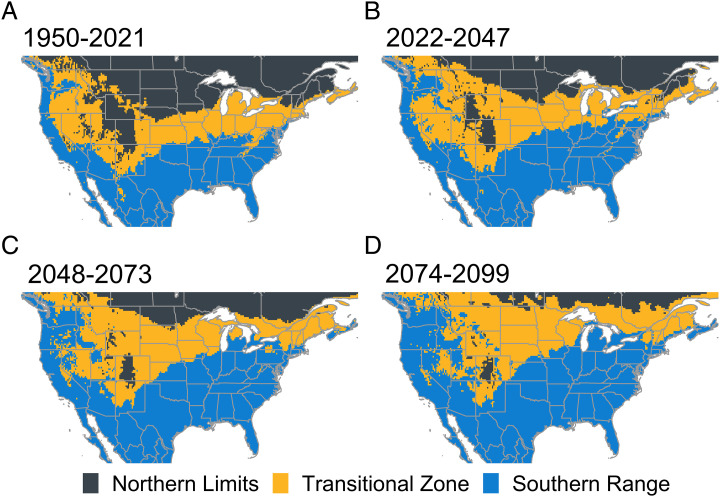
Overwintering success is an important determinant of arthropod populations that must be considered as climate change continues to influence the spatiotemporal population dynamics of agricultural pests. Using a long-term monitoring database and biologically relevant overwintering zones, we modeled the annual and seasonal population dynamics of a common pest, Helicoverpa zea (Boddie), based on three overwintering suitability zones throughout North America using four decades of soil temperatures: the southern range (able to persist through winter), transitional zone (uncertain overwintering survivorship), and northern limits (unable to survive winter). Our model indicates H. zea population dynamics are hierarchically structured with continental-level effects that are partitioned into three geographic zones. Seasonal populations were initially detected in the southern range, where they experienced multiple large population peaks. All three zones experienced a final peak between late July (southern range) and mid-August to mid-September (transitional zone and northern limits). The southern range expanded by 3% since 1981 and is projected to increase by twofold by 2099 but the areas of other zones are expected to decrease in the future. These changes suggest larger populations may persist at higher latitudes in the future due to reduced low-temperature lethal events during winter. Because H. zea is a highly migratory pest, predicting when populations accumulate in one region can inform synchronous or lagged population development in other regions. We show the value of combining long-term datasets, remotely sensed data, and laboratory findings to inform forecasting of insect pests.
Keywords: bollworm; corn earworm; dispersal; long-term monitoring; migration.
Conflict of interest statement
The authors declare no competing interest.
Figures


References
-
- Andrewartha H. G., Birch L. C., The Distribution and Abundance of Animals (University of Chicago Press, 1954).
-
- Yamamura K., Yokozawa M., Nishimori M., Ueda Y., Yokosuka T., How to analyze long term insect population dynamics under climate change: 50-year data of three insect pests in paddy fields. Popul. Ecol. 48, 31–48 (2006).
-
- Joern A., Gaines S. B., “Population dynamics and regulation in grasshoppers” in Biology of Grasshoppers, Chapman R. F., Joern A., Eds. (John Wiley & Sons, 1990), pp. 415–482.
-
- Srygley R. B., et al. , El Niño and dry season rainfall influence hostplant phenology and an annual butterfly migration from neotropical wet to dry forests. Glob. Change Biol. 16, 936–945 (2010).
-
- Saba V. S., et al. , The effect of the El Niño Southern Oscillation on the reproductive frequency of eastern Pacific leatherback turtles. J. Appl. Ecol. 44, 395–404 (2007).
Publication types
MeSH terms
LinkOut - more resources
Full Text Sources
Other Literature Sources
Medical
