. 2022 Sep 13;119(37):e2200014119.
doi: 10.1073/pnas.2200014119. Epub 2022 Sep 6.

Microbial functional diversity across biogeochemical provinces in the central Pacific Ocean

Affiliations

Microbial functional diversity across biogeochemical provinces in the central Pacific Ocean

Jaclyn K Saunders et al. Proc Natl Acad Sci U S A. .

Abstract

Enzymes catalyze key reactions within Earth's life-sustaining biogeochemical cycles. Here, we use metaproteomics to examine the enzymatic capabilities of the microbial community (0.2 to 3 µm) along a 5,000-km-long, 1-km-deep transect in the central Pacific Ocean. Eighty-five percent of total protein abundance was of bacterial origin, with Archaea contributing 1.6%. Over 2,000 functional KEGG Ontology (KO) groups were identified, yet only 25 KO groups contributed over half of the protein abundance, simultaneously indicating abundant key functions and a long tail of diverse functions. Vertical attenuation of individual proteins displayed stratification of nutrient transport, carbon utilization, and environmental stress. The microbial community also varied along horizontal scales, shaped by environmental features specific to the oligotrophic North Pacific Subtropical Gyre, the oxygen-depleted Eastern Tropical North Pacific, and nutrient-rich equatorial upwelling. Some of the most abundant proteins were associated with nitrification and C1 metabolisms, with observed interactions between these pathways. The oxidoreductases nitrite oxidoreductase (NxrAB), nitrite reductase (NirK), ammonia monooxygenase (AmoABC), manganese oxidase (MnxG), formate dehydrogenase (FdoGH and FDH), and carbon monoxide dehydrogenase (CoxLM) displayed distributions indicative of biogeochemical status such as oxidative or nutritional stress, with the potential to be more sensitive than chemical sensors. Enzymes that mediate transformations of atmospheric gases like CO, CO2, NO, methanethiol, and methylamines were most abundant in the upwelling region. We identified hot spots of biochemical transformation in the central Pacific Ocean, highlighted previously understudied metabolic pathways in the environment, and provided rich empirical data for biogeochemical models critical for forecasting ecosystem response to climate change.

Keywords: marine microbial ecology; mesopelagic; metaproteomics; methylotrophy; nitrification.


Conflict of interest statement

The authors declare no competing interest.

Figures

Fig. 1.
Fig. 1.
Station locations, geochemical features, and sample groupings along vertical and horizontal scales. (A) Cruise track for the ProteOMZ research expedition across the central Pacific Ocean aboard the R/V Falkor in early 2016 overlaid on a composite image of estimated chlorophyll-a from the moderate resolution imaging spectroradiometer (MODIS) Aqua satellite data during the expedition with an additional month bounded on both sides. The more productive waters associated with equatorial upwelling are visible in a band centered on station 12 ranging from stations 11 to 13. Dark blue represents lack of satellite data due to dense cloud cover. (B) Depth profiles of nitrous oxide concentrations from stations 7 and 12. (C) Oxygen concentrations across the transect as observed from a conductivity, temperature, and depth instrument with reduced oxygen regions associated with the extremities of the Eastern Tropical North and South Pacific ODZs evident near stations 7 and 13, respectively. (D, F, and I) Concentrations of nitrate, nitrite, and ammonium, respectively, as determined from water samples collected by Niskin bottle. (E) POC per volume of seawater sampled determined from GF/F filters attached to McLane in situ pumps collected concurrently with proteomics samples, peaking in abundance near the region of equatorial upwelling in the south. (G) Samples, represented by individual dots, grouped by region (north and south) as well as by depth (surface, cline, twilight, and deep) as identified by machine learning clustering analyses of geochemical and hydrographic data. While station 11 is in the Northern Hemisphere and station 12 is at the equator, based upon environmental data they clustered together with the southernmost stations. (H) Total protein extracted per volume of seawater sampled from the 0.2- to 3.0-µm filters.
Fig. 2.
Fig. 2.
Taxonomic and functional diversity within the ProteOMZ metaproteome. (A) The large concentric circles represent the relative abundance of peptides attributed to taxonomic groups according to an LCA analysis of peptides per depth group. The legend for each depth group also displays the percentage contribution of each major domain to the taxonomic profile with LUCA assigned to peptides which are highly conserved and thus found in multiple domains. Unknown indicates peptides which have no taxonomic homology to known organisms. The size of blue circles under the depth group names represents the relative contribution of peptides from that depth group to the overall metaproteome. (Inset) The swamp plot displays the abundance of peptides in sccorr/Lsw per depth group, colored by region. (B) A cumulative summation plot categorically displaying KO groups in rank order of abundance along the x axis and the relative contribution of each KO group to the total peptides in the KO-identifiable metaproteome along the y axis. (C) The relative abundance of peptides assigned to the major Enzyme Commission categories according to depth group.
Fig. 3.
Fig. 3.
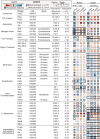
Summary table of protein abundance and attenuation across the transect. Data in the table include the gene name, Kegg Ontology identifier (KO), specific taxonomic group determined by LCA analysis of peptides (blank taxa indicate all taxa for that protein presented), total abundance (sccorr/Lsw: spectral counts per liter of seawater), community attenuation (c) through the water column (dash indicates lack of data for calculating; Materials and Methods). The heat map represents an aggregate of the individual depths (surface, cline, twilight, and deep) across the regions (north and south). The colors in the heat map represent the log2 fold change of the average abundance for each depth/region combination compared to the overall average abundance for all samples. Lines around groups represent where a protein in a particular location is significantly more abundant than other locations, with a dashed line indicating P ≤ 0.05 and a thick solid line indicating P ≤ 0.01. Lines around an entire region indicate where a protein is significantly more abundant than the other region as assessed by a Mann–Whitney u test. Lines around individual depths indicate where a protein is significantly more abundant in one or more depths when compared to the other depths as assessed by a Kruskal–Wallis H test with post hoc Dunn’s tests. Asterisk indicates KO groups that contain multiple different functional proteins, such as K00370, which contains both NarG and NxrA proteins (Materials and Methods and SI Appendix, Figs. S10–S15). Caret indicates peptides identified through parsimony analysis from protein group inference in the software package Scaffold as opposed to LCA analysis which was utilized elsewhere due to the high conservation of the peptides among taxonomic groups (Materials and Methods). Section profiles of the distribution of these proteins can be found in Fig. 4 or SI Appendix, Figs. S6–S9.
Fig. 4.
Fig. 4.
Attenuation profiles and distributions of the most abundant oxidoreductases in the mesopelagic. (A) Attenuation lines calculated by fitting a power law through abundance data of total extracted protein (c = −1.15), POC (c = −0.7), PON (c = −1.05), transport, and oxidoreductase enzymes that dominate the mesopelagic. The attenuation for all proteins combined was c = −1.25; more negative attenuations mean that proteins are more abundant in the surface and are reduced more quickly from communities at depth. Proteins with relatively slow attenuation rates, like the low-oxygen formate dehydrogenase (FdoG; c = −0.46), which oxidizes the C1 compound formic acid to CO2, and carbon monoxide dehydrogenase (CoxL; c = −0.31), which oxidizes carbon monoxide to CO2, are shown. Also presented is the aerobic formate dehydrogenase (FDH; c = −19.56), which is associated with methylotrophy and attenuates rapidly as it is far more abundant in the surface than in the mesopelagic. The inositol-phosphate transport system substrate-binding protein (InoE; c = +0.26), which increases in abundance with depth, is also shown. (B) Abundance of the most abundant oxidoreductase enzyme, nitrite oxidoreductase (NxrA), across the transect. This enzyme is abundant in the mesopelagic as well as in the surface waters near the equatorial upwelling region in the south. (C) Ammonium monooxygenase alpha subunit (AmoA) of Thermoproteota is most abundant at the interface of the surface and cline and is also more abundant in the south. (D) Bacterial nitrite reductase (NirK) peaks in abundance in the low-oxygen waters above the ETNP ODZ. (E) Archaeal nitrite reductase (NirK) is present in the waters above the ETNP ODZ but peaks in abundance in the surface waters associated with equatorial upwelling. (F) The oxidizing form of dissimilatory sulfite reductase (DsrA) is found within the mesopelagic waters. (G) The copper monooxygenase from Nitrospinae, putatively a Mn oxidase (MnxG), is most abundant at the top of the ETNP ODZ and is also found at similar depths in more oxygenated waters in the South Pacific. (H) MnxG shows a similar distribution pattern in the South Pacific to the bacterial catalase (KatG), which is indicative of a region characterized by oxidative stress. (I) The third most abundant oxidoreductase protein in the mesopelagic, formate dehydrogenase (FdoG), is most abundant along oxic transitional regions. (J) The abundant protein carbon monoxide oxidoreductase (CoxL) is also found throughout the mesopelagic, peaking in abundance in the South Pacific. (K) The formate dehydrogenase (FDH), however, is most abundant in the South Pacific surface near high POC. (L) The distribution of multiple ammonifying catabolic enzymes like alanine dehydrogenase (Ald) is tightly correlated with ammonia monooxygenase.
Fig. 5.
Fig. 5.
Distribution of select oxidoreductases across the transect, according to oxygen concentrations, and all proteins as analyzed by an artificial neural network. (A) Distributions of proteins binned by oxygen concentrations (10 µmol/kg) and normalized by the number of samples per bin. Gray outlines of protein distributions show the shape of the distribution for each individual enzyme. The colored interiors of AmoA, Archaeal and Bacterial NirK, DsrA, SoxA, MnxG, and KatG are distributions scaled to the relative abundance of Archaeal NirK, the most abundant of these proteins. NxrA is presented separately as it is significantly more abundant than the other proteins (20× more than Archaeal NirK). NarG and IdrA are presented together as they both have the same distribution pattern and only occur in the lowest oxygen bin. The samples column displays the discrete number of samples in each oxygen bin by depth illustrating the variability in sampling across oxygen concentrations. (B) Neural network feature maps of individual samples showing the unique fingerprints of each sample, highlighting the major underlying protein distributions associated with each sample. Note how the fingerprints change with depth as well as along regional scales. The neural net is composed of 900 individual nodes (a 30 × 30 matrix) using periodic boundary conditions. (C) The integrated differences of weights across all samples in the neural net are displayed in the background. Overlaid on top are points which represent the location of individual proteins according to nodes in the neural net (best matching unit). Individual points within a single node are offset slightly to show density of points. Nodes closer to each other with lower weight differences between them are more similar to each other.

References

    1. Falkowski P. G., Fenchel T., Delong E. F., The microbial engines that drive Earth’s biogeochemical cycles. Science 320, 1034–1039 (2008). - PubMed
    1. Bergauer K., et al. , Organic matter processing by microbial communities throughout the Atlantic water column as revealed by metaproteomics. Proc. Natl. Acad. Sci. U.S.A. 115, E400–E408 (2018). - PMC - PubMed
    1. Mikan M. P., et al. , Metaproteomics reveal that rapid perturbations in organic matter prioritize functional restructuring over taxonomy in western Arctic Ocean microbiomes. ISME J. 14, 39–52 (2020). - PMC - PubMed
    1. McCain J. S. P., et al. , Cellular costs underpin micronutrient limitation in phytoplankton. Sci. Adv. 7, eabg6501 (2021). - PMC - PubMed
    1. Morris R. M., et al. , Comparative metaproteomics reveals ocean-scale shifts in microbial nutrient utilization and energy transduction. ISME J. 4, 673–685 (2010). - PubMed

Publication types