. 2022 Sep 6;13(1):4981.
doi: 10.1038/s41467-022-32521-8.

Lactate increases stemness of CD8 + T cells to augment anti-tumor immunity

Affiliations

Lactate increases stemness of CD8 + T cells to augment anti-tumor immunity

Qiang Feng et al. Nat Commun. .

Abstract

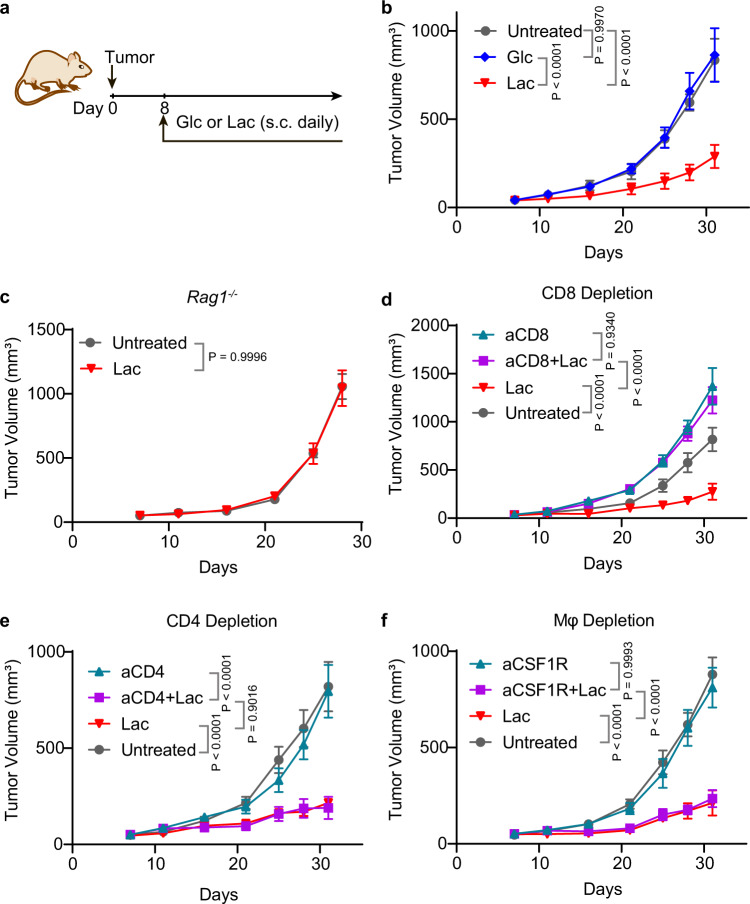
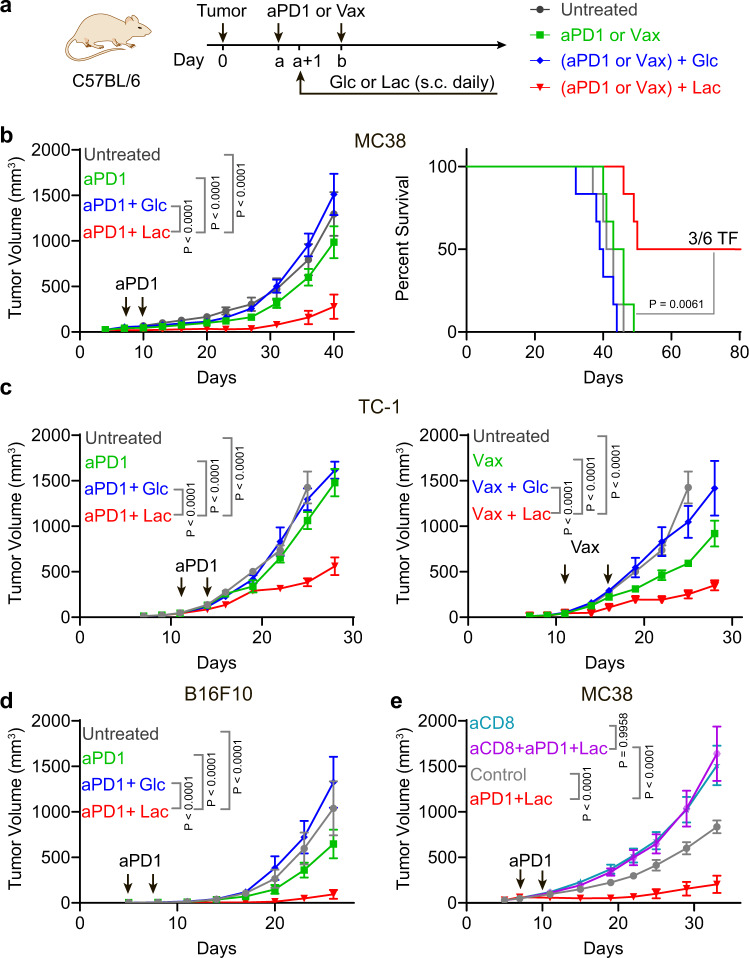
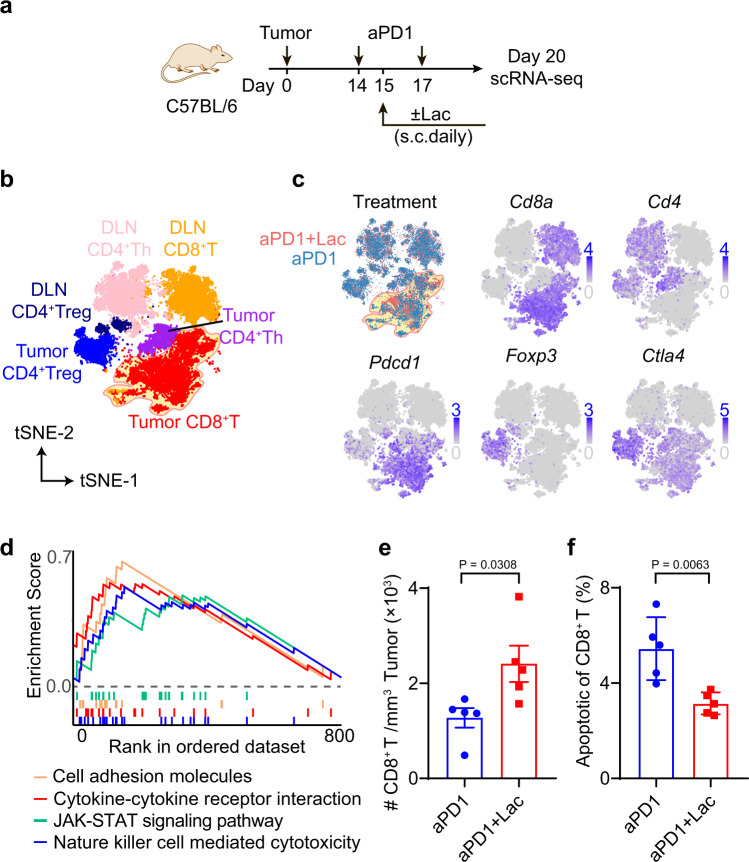
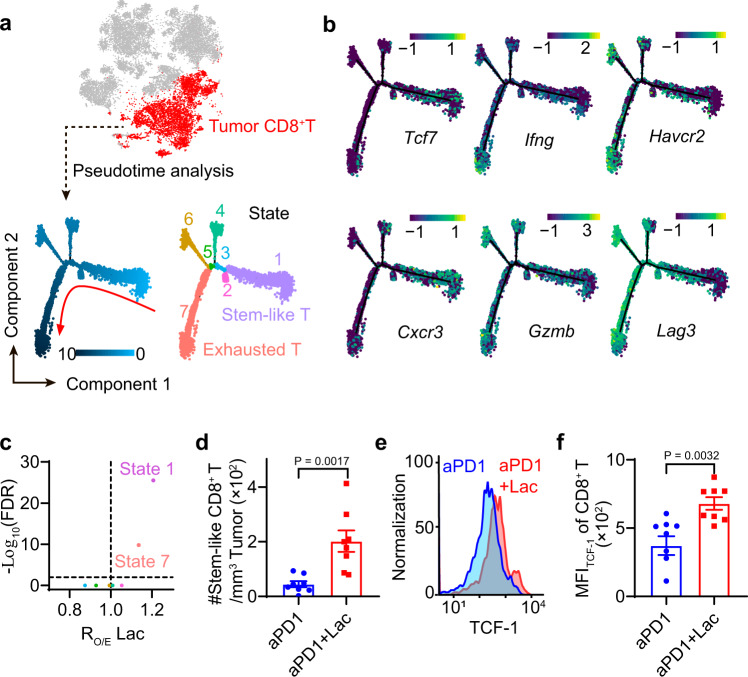
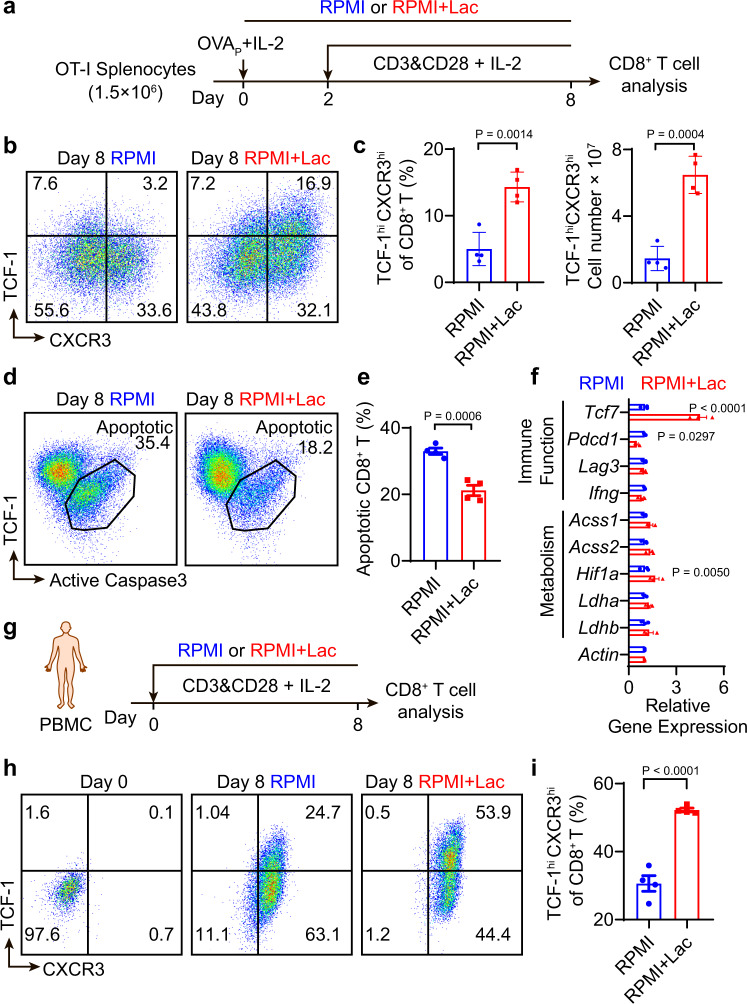
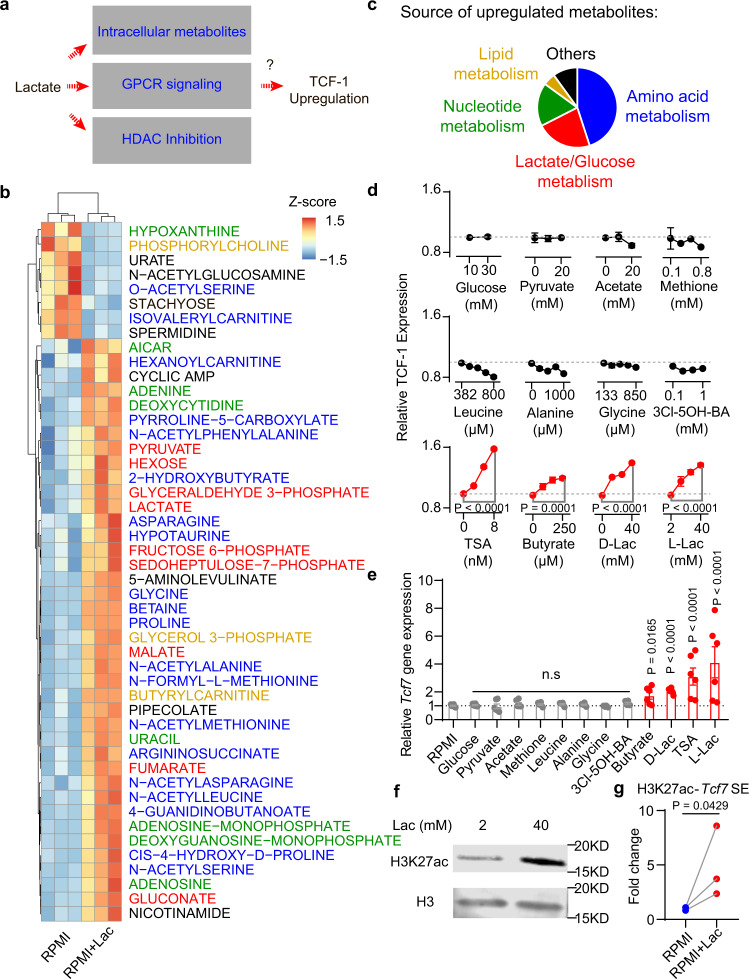
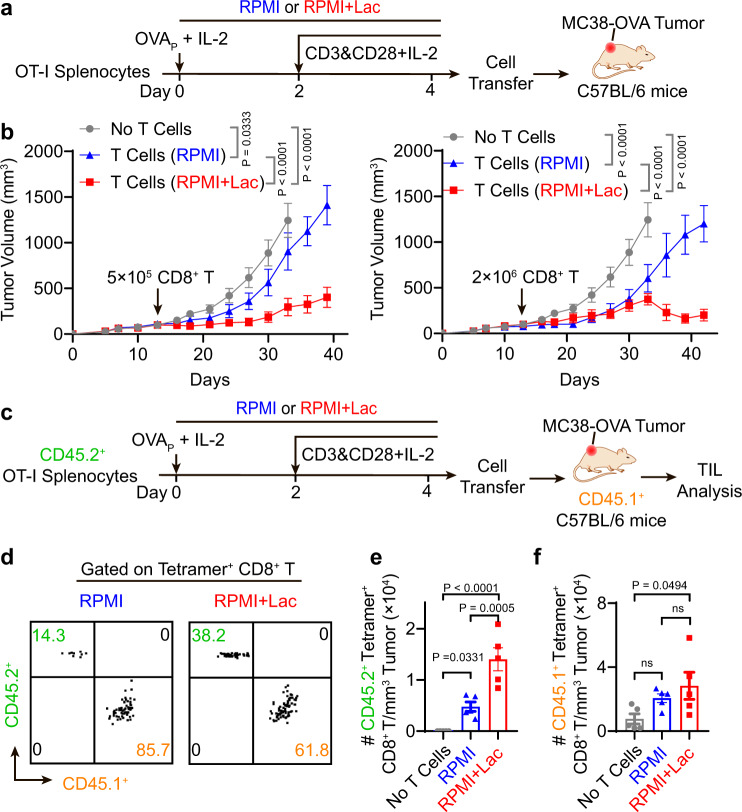
Lactate is a key metabolite produced from glycolytic metabolism of glucose molecules, yet it also serves as a primary carbon fuel source for many cell types. In the tumor-immune microenvironment, effect of lactate on cancer and immune cells can be highly complex and hard to decipher, which is further confounded by acidic protons, a co-product of glycolysis. Here we show that lactate is able to increase stemness of CD8+ T cells and augments anti-tumor immunity. Subcutaneous administration of sodium lactate but not glucose to mice bearing transplanted MC38 tumors results in CD8+ T cell-dependent tumor growth inhibition. Single cell transcriptomics analysis reveals increased proportion of stem-like TCF-1-expressing CD8+ T cells among intra-tumoral CD3+ cells, a phenotype validated by in vitro lactate treatment of T cells. Mechanistically, lactate inhibits histone deacetylase activity, which results in increased acetylation at H3K27 of the Tcf7 super enhancer locus, leading to increased Tcf7 gene expression. CD8+ T cells in vitro pre-treated with lactate efficiently inhibit tumor growth upon adoptive transfer to tumor-bearing mice. Our results provide evidence for an intrinsic role of lactate in anti-tumor immunity independent of the pH-dependent effect of lactic acid, and might advance cancer immune therapy.


Conflict of interest statement

The authors declare no competing interests.

Figures

Fig. 1
Fig. 1. Lactate augments antitumor immunity through CD8+ T cells.
a Treatment regimen for glucose (Glc) or lactate (Lac). Glucose (5 g/kg) or lactate (1.68 g/kg) was subcutaneously administrated daily from Day 8 after tumor inoculation. b Tumor growth curve of MC38 tumor model treated with glucose or lactate. C57BL/6 mice (n = 6) were inoculated with 1 × 106 MC38 tumor cells and treated with glucose or lactate. c, Tumor growth curves of MC38 tumor in B6.129S7-Rag1tm1Mom (Rag1−/−) mice treated with lactate. Rag1−/− mice (n = 7) were inoculated with 1 × 106 MC38 tumor cells and treated with lactate. CD8+ T cell (d), CD4+ T cell (e) and macrophage (f) depletion assay in MC38 tumor model. C57BL/6 mice (n = 6) were inoculated with 1 × 106 MC38 tumor cells and treated with lactate. Anti-CD8 (10 mg/kg) was administered on day 6 and then every three days until the end of the experiment. Anti-CD4 (10 mg/kg) or anti-CSF1R (20 mg/kg) was administered on day 3 and then every three days until the end of the experiment. Data are shown as means ± SEM. P value was determined by one-tail two-way ANOVA with correction using Geisser-Greenhouse method. Source data are provided in Source Data file.
Fig. 2
Fig. 2. Lactate but not glucose promotes antitumor immunity in multiple tumor models.
a Treatment regimen for immunotherapy in combination with glucose (Glc) or lactate (Lac). Glucose (5 g/kg) or lactate (1.68 g/kg) was administrated subcutaneously daily one day after the first dose of anti-PD-1 (aPD1, i.p. injection) or PC7A vaccine (Vax, s.c. injection) treatment. b Tumor growth and survival data of anti-PD-1 combined with glucose or lactate in MC38 tumor model. C57BL/6 mice (n = 6) were inoculated with 1 × 106 MC38 tumor cells and treated with anti-PD-1 (10 mg/kg, day 7 and 10) in combination with glucose or lactate. TF: tumor free. c Tumor growth curves of anti-PD-1 or PC7A vaccine combined with lactate or glucose in TC-1 tumor model. C57BL/6 mice (n = 6) were inoculated with 1.5 × 105 TC-1 tumor cells and treated with anti-PD-1 (10 mg/kg, day 11 and 14) or PC7A vaccine (0.5 μg E7 peptide, day 11, 16) in combination with glucose or lactate. d, Tumor growth curve of anti-PD-1 combined with lactate or glucose in B16F10 tumor model. C57BL/6 mice (n = 6) were inoculated with 1.5 × 105 B16F10 tumor cells and treated with anti-PD-1 (10 mg/kg, day 5 and 8) in combination with glucose or lactate. e CD8+ T cell depletion assay in MC38 tumor model. C57BL/6 mice (n = 5) were inoculated with 1 × 106 MC38 tumor cells and treated with anti-PD-1 (10 mg/kg, day 7 and 10) in combination with glucose or lactate. Anti-CD8 (10 mg/kg) was administered at day 6 and then every three days until the end of the experiment. Data are shown as means ± SEM. P-value was determined by logrank test (b) or one-tail two-way ANOVA with correction using Geisser-Greenhouse method (a, b–e). ns: not significant. Source data and summary of all P values are provided in Source Data file.
Fig. 3
Fig. 3. Lactate treatment increases infiltrating CD8+ T cells in MC38 tumors.
a Experimental design of single cell transcriptomic analysis of anti-PD-1 with or without lactate. C57BL/6 mice were inoculated with 1 × 106 MC38 tumor cells and treated with anti-PD-1 (10 mg/kg, day 14 and 17) and lactate (1.68 g/kg, s.c. daily from day 15 to 19). Tumor and tumor draining lymph nodes were harvested on day 20 and analyzed by single cell RNA sequencing using the 10x platform. b tSNE plot of T cell clusters with location and cell type information analyzed with Seurat v3.0.1. DLN: tumor draining lymph nodes. c Distribution of T cells from different treatments and expression of marker genes. d Significantly upregulated pathways in tumor infiltrating CD8+ T cells after lactate treatment by unbiased gene set enrichment analysis (gene set database: c2.cp.kegg.v7.2.symbols). e Validation of increased tumor infiltrating CD8+ T cells by flow cytometry. C57BL/6 mice (n = 5) were inoculated with 1 × 106 MC38 tumor cells and treated with anti-PD-1 (10 mg/kg, day 14 and 17) and lactate (1.68 g/kg, s.c. daily from day 15 to 19). MC38 tumors were harvested on day 20 and analyzed by flow cytometry. f Analysis of apoptosis markers of CD8+ T cells in tumor microenvironment by flow cytometry. Data are shown as means ± SEM. P value was determined by two-tail unpaired t-test (e, f). Source data are provided in Source Data file.
Fig. 4
Fig. 4. Lactate treatment increases stem-like CD8+ T cell population in MC38 tumors.
a Pseudotime trajectory of CD8+ T cells in tumors identifies the differentiation process and distinct states of CD8+ T cell subtypes. b Labeling of top marker genes on pseudotime trajectory identifies the cells in state 1 are stem-like T cells while those in state 7 are exhausted T cells. c Change of CD8+ T cell fraction with aPD1+Lac verses aPD1 treatment. RO/E Lac analysis showed lactate treatment increased the T cell populations in states 1 and 7. d Validation of increase in TCF1+ PD1+ CD8+ T cell population after lactate treatment by flow cytometry. C57BL/6 mice (n = 8) were inoculated with 1 × 106 MC38 tumor cells and treated with anti-PD-1 (10 mg/kg, day 14 and 17) and lactate (1.68 g/kg, s.c. daily from day 15 to 19). Tumors were harvested on day 20 and analyzed by flow cytometry. e, f Flow cytometry plot and quantification of TCF-1 expressions in tumor-infiltrating CD8+ T cells after different treatments. Samples are the same as described in D. Data are shown as means ± SEM. P value was determined by one-tail Chi-square test (c) or two-tail unpaired t-test (d, f). Source data are provided in Source Data file.
Fig. 5
Fig. 5. Lactate increases TCF-1 expression and reduces apoptosis of CD8+ T cells during ex vivo expansion.
a Experimental design of ex vivo OT-I CD8+ T cell expansion. Fresh splenocytes from C57BL/6-Tg(TcraTcrb)1100Mjb/J mice were primed with SIINFEKL peptide (1 μg/mL) and hIL-2 (50 U/mL) for two days and stimulated with anti-CD3 and anti-CD28 (0.5 μg/mL each) from day 3 to 8 with hIL-2 (30 U/mL). b, c Flow cytometry plots and quantification of TCF-1hiCXCR3hi population of OT-I CD8+ T cells on day 8 of ex vivo expansion (n = 4 biologically independent samples). d, e Quantification of percentage of apoptotic OT-I CD8+ T cells by flow cytometry on day 8 of ex vivo expansion (n = 4 biologically independent samples). f, Relative gene expression in OT-I CD8+ T cells on day 4 detected by RT-PCR (n = 3 biologically independent samples). g Experimental design of ex vivo expansion of CD8+ T cells from human PBMCs. PBMCs from cord blood were activated and cultured in the presence of anti-CD3 and anti-CD28 beads (T cell: Beads = 1: 1) supplemented with hIL-2 (30 U/mL). h, i Flow cytometry plots and quantification of TCF-1hiCXCR3hi population of human CD8+ T cells on day 8 of ex vivo expansion (n = 4 biologically independent samples). Data are shown as means ± SEM. P-value was determined by two-tail unpaired t-test (c, e, i) or one-tail two-way ANOVA without correction (f). Source data are provided in Source Data file.
Fig. 6
Fig. 6. Lactate increases TCF-1 expression through inhibition of histone deacetylases (HDAC).
a Potential mechanisms for lactate induced TCF-1 upregulation. b Heatmap of significantly changed metabolites in CD8+ T cells treated with or without 40 mM lactate. c Source of upregulated metabolites with 40 mM lactate treatment. d TCF-1 protein expression in CD8+ T cells treated by different metabolites, GPCR agonist or HDAC inhibitors (n = 3 biologically independent samples). e Gene expression of Tcf7 in CD8+ T cells treated by different metabolites, GPCR agonist or HDAC inhibitors. The concentration of different metabolites was the same as the highest concentration in d (n = 6 biologically independent samples). f Western blot of histone H3K27ac of CD8+ T cells cultured with or without 40 mM lactate (One representative data was shown from 3 independently repeated experiments). g Quantification of H3K27ac enrichment by CUT&RUN PCR at the Tcf7 super enhancer locus (n = 3 biologically independent samples). Data are shown as means ± SEM. P-value was determined by two-tail unpaired t-test without adjustment (d, e) or two-tail ratio paired t-test (g). Source data are provided in Source Data file.
Fig. 7
Fig. 7. CD8+ T cells expanded under high lactate condition show potent tumor growth inhibition in vivo.
a Treatment regimen of T cell receptor engineered T cell therapy (TCR-T). OT-I splenocytes were cultured ex vivo for 4 days with or without 40 mM sodium lactate in the culture medium. After purification with negative selection magnetic beads, CD8+ T cells were transferred to MC38-OVA tumor bearing mice. Average tumor size is above 100 mm3 at the time of cell transfer. b The growth curves of MC38-OVA tumor model were significantly inhibited after transfer of TCR-T (5 × 105 or 2 × 106) pretreated with sodium lactate (n = 5). c Analysis of tumor-infiltrating T cells after adoptive TCR-T cell transfer. Seven days after the cell transfer, tumor-infiltrating lymphocytes were analyzed by flow cytometry. df Flow cytometry plot and quantification of transferred (CD45.2+) and endogenous (CD45.1+) OVA-tetramer+ CD8+ T cells show lactate pretreatment significantly increased the number of transferred CD8+ T cells (CD45.2+) but not endogenous CD8+ T cells (CD45.1+) in the MC38-OVA tumors (n = 5). Data are shown as means ± SEM. P-value was determined by one-tail two-way ANOVA with correction using Tukey method (b, c) or one-tail one-way ANOVA with correction using Geisser-Greenhouse method (e, f). Source data are provided in Source Data file.

References

    1. Pearce EL, Pearce EJ. Metabolic pathways in immune cell activation and quiescence. Immunity. 2013;38:633–643. doi: 10.1016/j.immuni.2013.04.005. - DOI - PMC - PubMed
    1. Jung J, Zeng H, Horng T. Metabolism as a guiding force for immunity. Nat. Cell Biol. 2019;21:85–93. doi: 10.1038/s41556-018-0217-x. - DOI - PubMed
    1. O’Neill LAJ, Kishton RJ, Rathmell J. A guide to immunometabolism for immunologists. Nat. Rev. Immunol. 2016;16:553–565. doi: 10.1038/nri.2016.70. - DOI - PMC - PubMed
    1. Chang CH, et al. Posttranscriptional control of T cell effector function by aerobic glycolysis. Cell. 2013;153:1239–1251. doi: 10.1016/j.cell.2013.05.016. - DOI - PMC - PubMed
    1. Wang C, et al. CD5L/AIM regulates lipid biosynthesis and restrains Th17 cell pathogenicity. Cell. 2015;163:1413–1427. doi: 10.1016/j.cell.2015.10.068. - DOI - PMC - PubMed

Publication types