. 2022 Sep 6;8(1):85.
doi: 10.1038/s41421-022-00442-x.

Artificial intelligence defines protein-based classification of thyroid nodules

Affiliations

Artificial intelligence defines protein-based classification of thyroid nodules

Yaoting Sun et al. Cell Discov. .

Erratum in

  • Author Correction: Artificial intelligence defines protein-based classification of thyroid nodules.
    Sun Y, Selvarajan S, Zang Z, Liu W, Zhu Y, Zhang H, Chen W, Chen H, Li L, Cai X, Gao H, Wu Z, Zhao Y, Chen L, Teng X, Mantoo S, Lim TK, Hariraman B, Yeow S, Alkaff SMF, Lee SS, Ruan G, Zhang Q, Zhu T, Hu Y, Dong Z, Ge W, Xiao Q, Wang W, Wang G, Xiao J, He Y, Wang Z, Sun W, Qin Y, Zhu J, Zheng X, Wang L, Zheng X, Xu K, Shao Y, Zheng S, Liu K, Aebersold R, Guan H, Wu X, Luo D, Tian W, Li SZ, Kon OL, Iyer NG, Guo T. Sun Y, et al. Cell Discov. 2022 Sep 30;8(1):100. doi: 10.1038/s41421-022-00471-6. Cell Discov. 2022. PMID: 36180436 Free PMC article. No abstract available.

Abstract

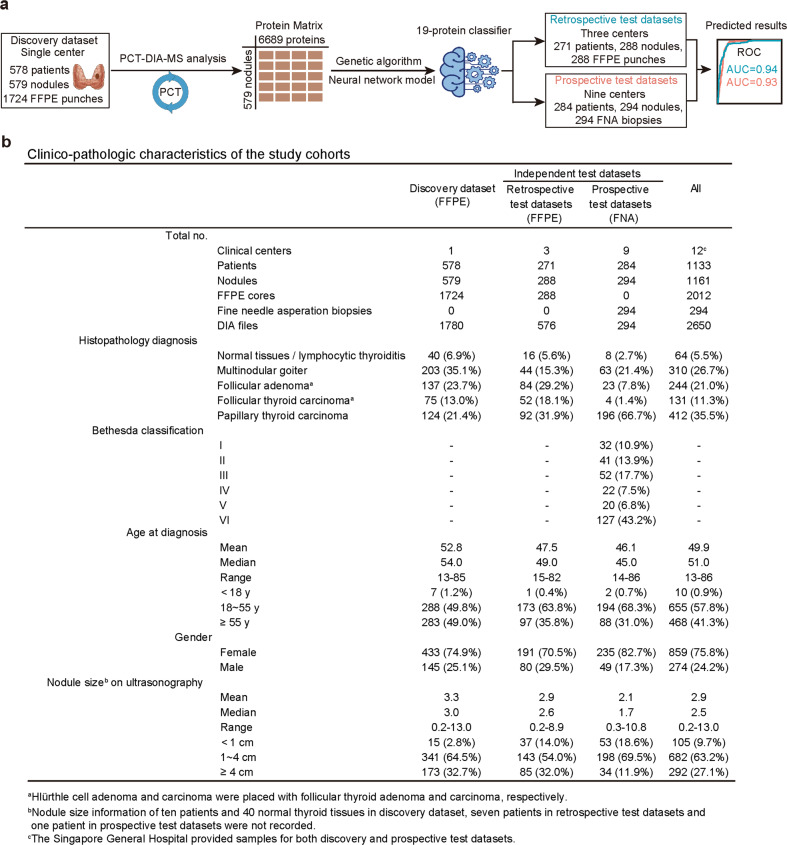
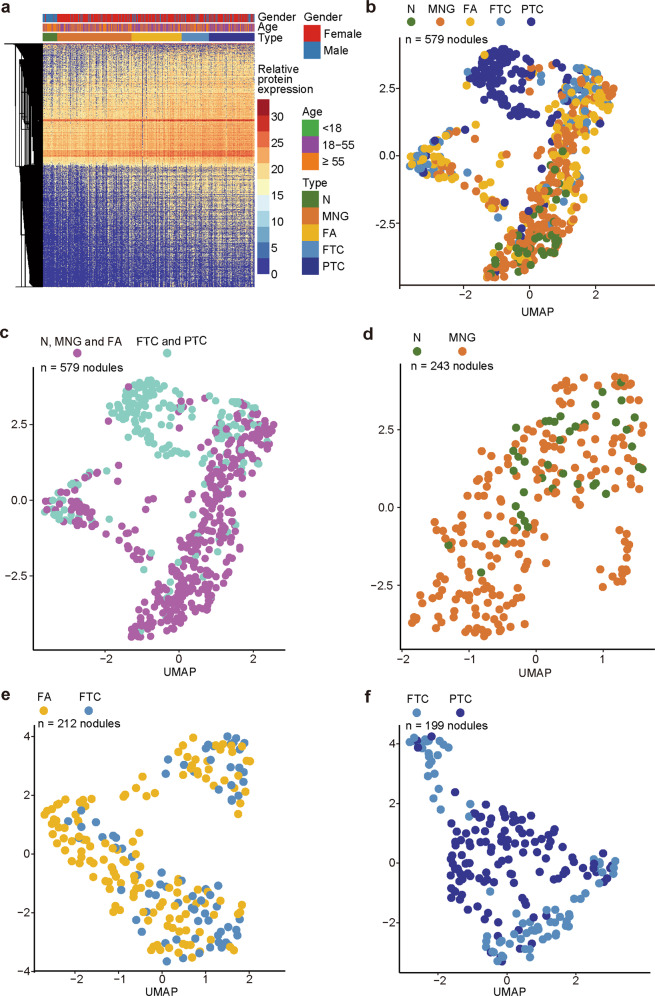
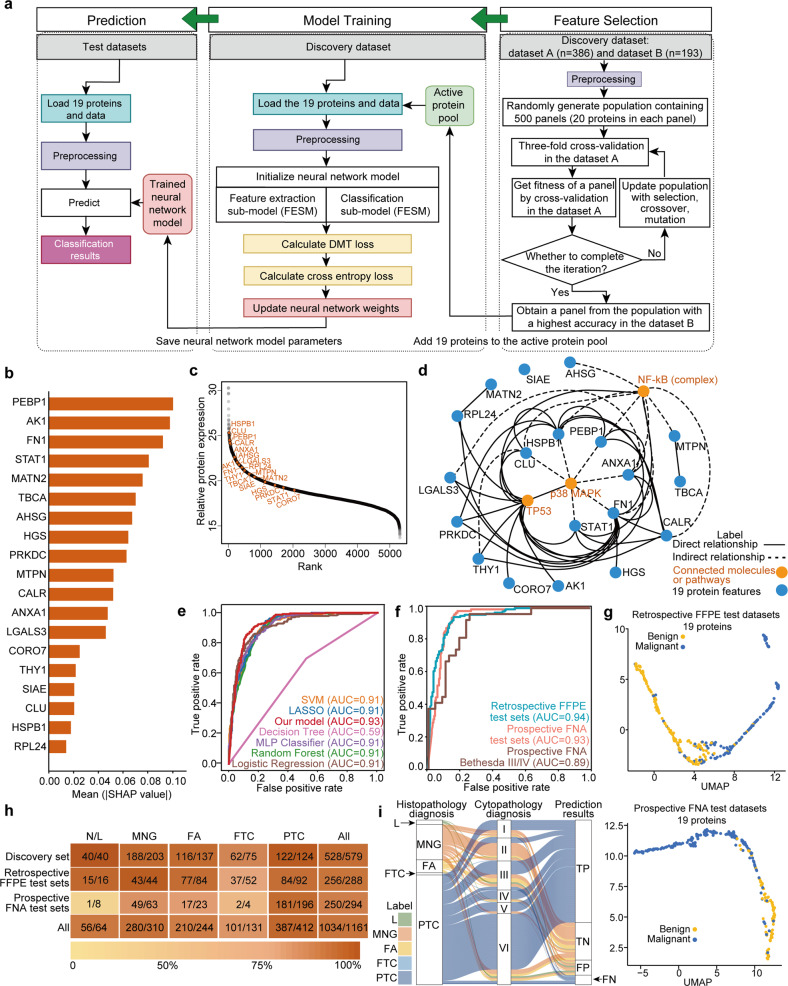
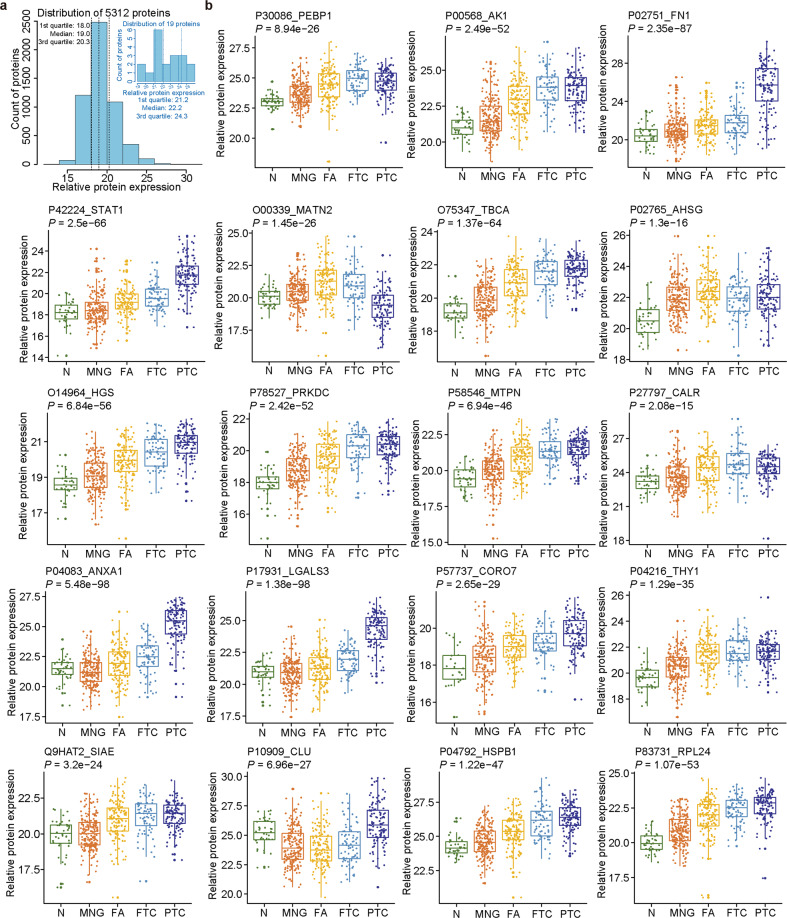
Determination of malignancy in thyroid nodules remains a major diagnostic challenge. Here we report the feasibility and clinical utility of developing an AI-defined protein-based biomarker panel for diagnostic classification of thyroid nodules: based initially on formalin-fixed paraffin-embedded (FFPE), and further refined for fine-needle aspiration (FNA) tissue specimens of minute amounts which pose technical challenges for other methods. We first developed a neural network model of 19 protein biomarkers based on the proteomes of 1724 FFPE thyroid tissue samples from a retrospective cohort. This classifier achieved over 91% accuracy in the discovery set for classifying malignant thyroid nodules. The classifier was externally validated by blinded analyses in a retrospective cohort of 288 nodules (89% accuracy; FFPE) and a prospective cohort of 294 FNA biopsies (85% accuracy) from twelve independent clinical centers. This study shows that integrating high-throughput proteomics and AI technology in multi-center retrospective and prospective clinical cohorts facilitates precise disease diagnosis which is otherwise difficult to achieve by other methods.


Conflict of interest statement

The research group of T.G. is supported by Pressure Biosciences Inc., which provides sample preparation instrumentation. T.G. and Y. Zhu are shareholders of Westlake Omics Inc. W.L., G.R., Q.Z., H.C., Y. Hu and W.G. are employees of Westlake Omics Inc. R.A. holds shares in Biognosys, a proteomics company operating in the field of research. The remaining authors declare no competing interests.

Figures

Fig. 1
Fig. 1. Schematic view of the study and clinic-pathologic characteristics.
a The project design and workflow of the FFPE-PCT-DIA pipeline. b Clinic-pathologic characteristics of the study cohorts.
Fig. 2
Fig. 2. Global thyroid proteome profile.
a Heatmap showing protein expression profiles of 579 thyroid tissue specimens from 578 patients. 5312 proteins (rows) are clustered without supervision. Samples (columns) are ordered based on the tissue types. The color indicates the log2-scaled intensity of each protein in each sample. bf UMAP plots showing global snapshots comparing the indicated types of thyroid tissues using 5312 proteins for all subtypes (b); benign vs malignant (c); only benign (d); FA vs FTC (e); and only malignant (f) tissue types.
Fig. 3
Fig. 3. Classifier development, performance testing, and validation in independent blinded datasets.
a Schematic workflow of the classifier development. Protein features were prioritized based on the discovery dataset. The model was trained using 19 proteins selected from the discovery dataset and further validated in test datasets. More details are described in Materials and Methods. b The importance rank of the selected 19 protein features was interpreted by SHapley Additive exPlanations (SHAP) algorithm. c Protein abundance distribution of the 19 features. d Network of the 19 proteins. Blue nodes and orange nodes indicate the protein features and connected molecules or pathways, respectively. Direct interactions are in solid lines and indirect interactions are in dash lines. e ROC plots of seven different machine learning models of 19 selected features. f ROC plots of the discovery set, retrospective test sets, prospective test sets and Bethesda III and IV samples in the prospective test sets. g UMAP plots showing the separation between benign and malignant groups in the retrospective and prospective test sets using 19 protein features with latent space. h Overall performance metrics of prediction of the neural network model for five specific histopathological types per set. Graduated colors in the shaded bar indicate accuracy levels. Numbers in the boxes indicate the number of correctly identified samples/total sample number. HCA and HCC were assigned as FA and FTC, respectively. i Sankey diagram showing the distribution ratio and correspondence between histopathology and cytopathology in the prospective sets. Histopathological type L denotes lymphocytic thyroiditis. Cytopathology scores were assigned by specialized pathologists using the Bethesda System. TP, TN, FP, and FN indicate true positive, true negative, false positive, and false negative, respectively, of the results predicted by our classifier model.
Fig. 4
Fig. 4. Protein expression plots for 19 selected protein features in the five histotypes of thyroid tissues in the discovery cohort.
a The plots showing the abundance distribution of 5312 proteins and 19 selected features. b y-axis shows log2 values of protein expression intensity, and x-axis indicates tissue types. P-value was calculated by one-way ANOVA.
Fig. 5
Fig. 5. Biological insights of thyroid tumor subtypes based on proteotypic data.
a Rose chart plotting the DEP counts of corresponding pairwise comparison for follicular-pattern tumors and control samples (cPTC). The threshold that we used was fold change > 4 and adjusted P-value < 0.01. The pink and blue colors represent counts of upregulated and downregulated proteins in the Rose chart, respectively. b Box plots showing CRABP1 and NAMPT dysregulated in six histological tumor subtypes, especially between FTC and FA. P-values were calculated by one-way ANOVA for six-group comparison in the box plots. c UMAP plot for 186 proteins distinguishing Hürthle cell tumors from other follicular neoplasms. d Network map showing expression of key mitochondrial proteins implicated in Hürthle cell neoplasms. e UMAP plot for 401 proteins distinguishing FTC from cPTC, with fvPTC as an intermediate phenotype. f, g Heatmap showing DEPs (f) in FTC compared with fvPTC and cPTC, with pathways (g) indicated in the chord plot.

References

    1. Burman KD, Wartofsky L. Clinical practice. Thyroid nodules. N. Engl. J. Med. 2015;373:2347–2356. - PubMed
    1. Jameson JL. Minimizing unnecessary surgery for thyroid nodules. N. Engl. J. Med. 2012;367:765–767. - PubMed
    1. Faquin WC, Bongiovanni M, Sadow PM. Update in thyroid fine needle aspiration. Endocr. Pathol. 2011;22:178–183. - PubMed
    1. Alexander EK, et al. Preoperative diagnosis of benign thyroid nodules with indeterminate cytology. N. Engl. J. Med. 2012;367:705–715. - PubMed
    1. Ahn HS, Kim HJ, Welch HG. Korea’s thyroid-cancer “epidemic”—screening and overdiagnosis. N. Engl. J. Med. 2014;371:1765–1767. - PubMed