. 2022 Sep 6;13(1):5253.
doi: 10.1038/s41467-022-32972-z.

Multimodal single cell sequencing implicates chromatin accessibility and genetic background in diabetic kidney disease progression

Affiliations

Multimodal single cell sequencing implicates chromatin accessibility and genetic background in diabetic kidney disease progression

Parker C Wilson et al. Nat Commun. .

Abstract

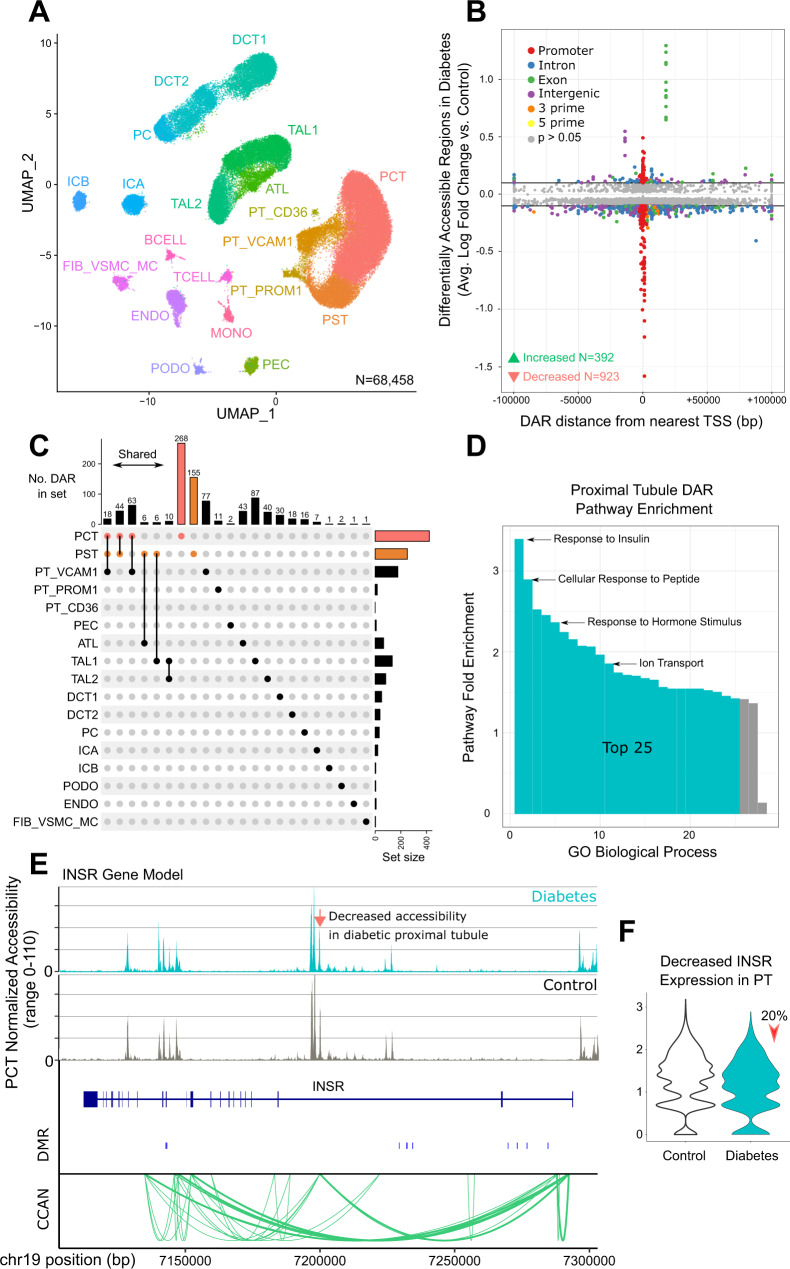
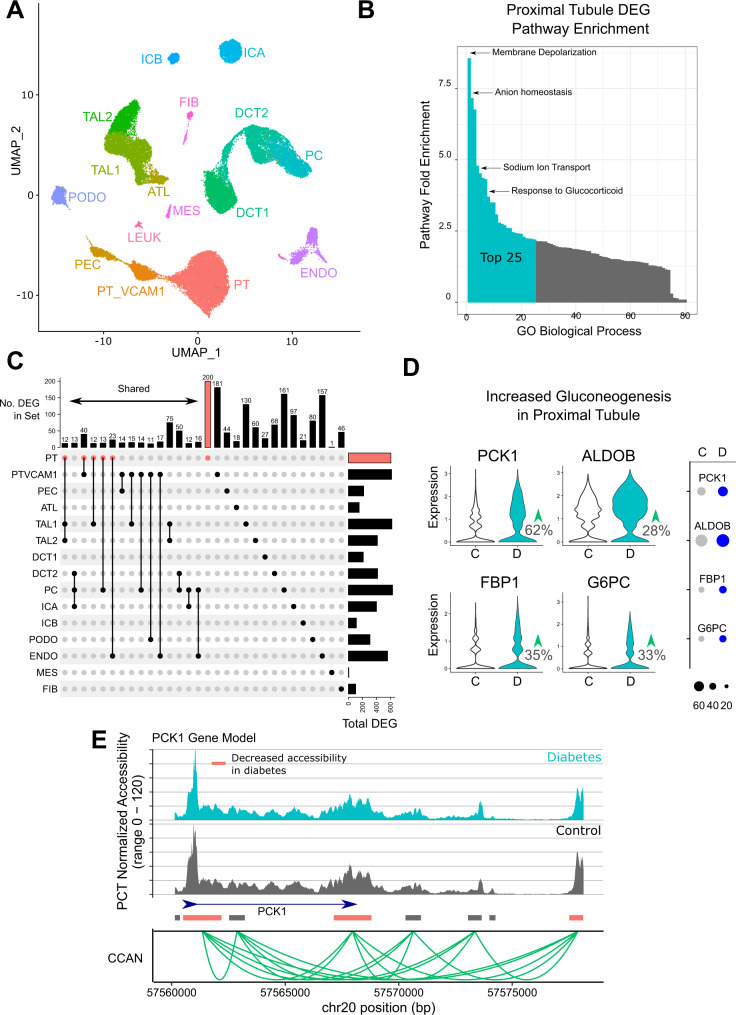
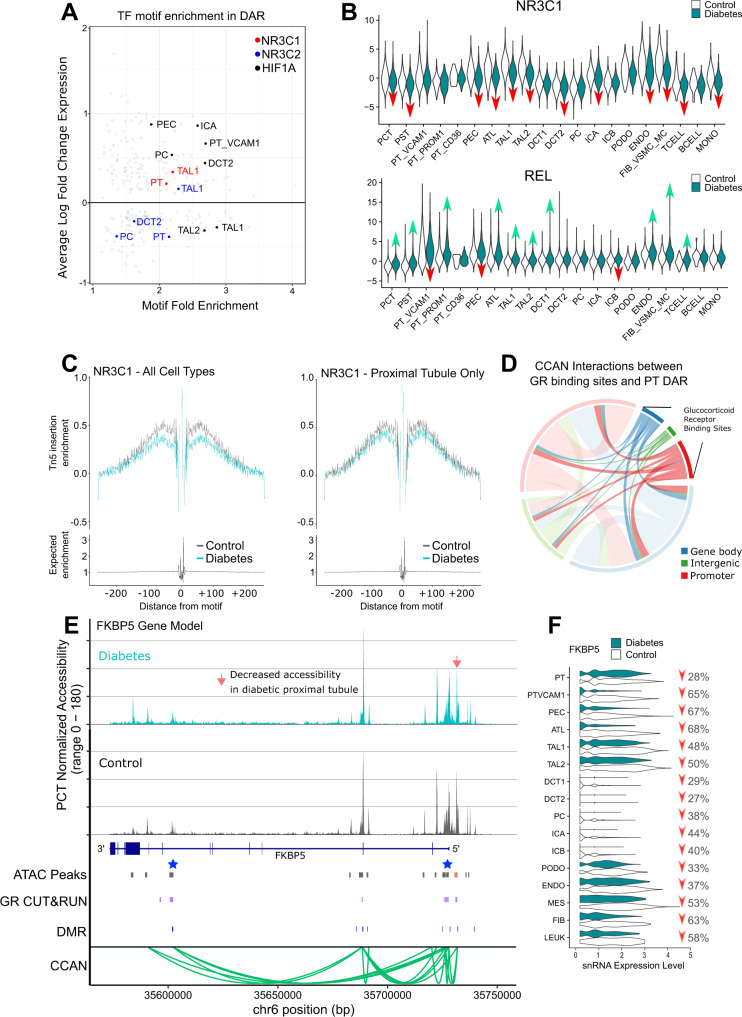
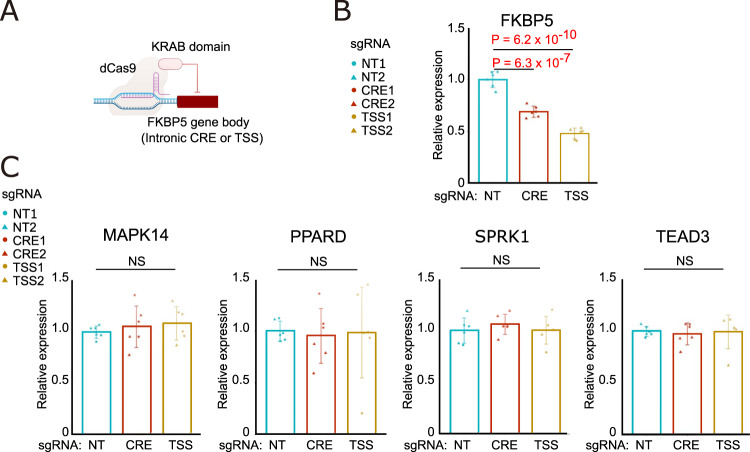
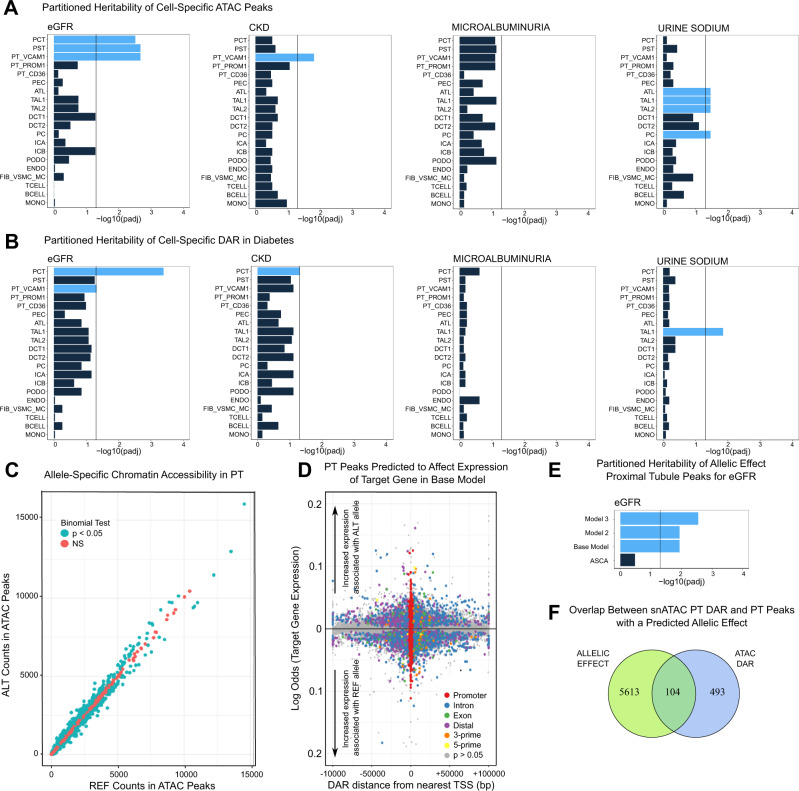
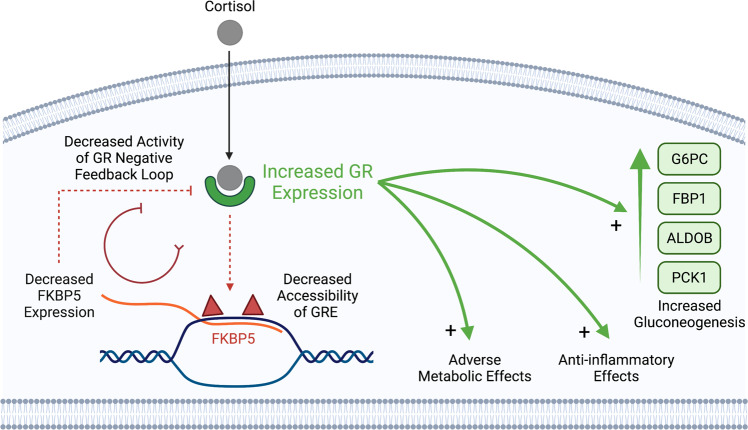
The proximal tubule is a key regulator of kidney function and glucose metabolism. Diabetic kidney disease leads to proximal tubule injury and changes in chromatin accessibility that modify the activity of transcription factors involved in glucose metabolism and inflammation. Here we use single nucleus RNA and ATAC sequencing to show that diabetic kidney disease leads to reduced accessibility of glucocorticoid receptor binding sites and an injury-associated expression signature in the proximal tubule. We hypothesize that chromatin accessibility is regulated by genetic background and closely-intertwined with metabolic memory, which pre-programs the proximal tubule to respond differently to external stimuli. Glucocorticoid excess has long been known to increase risk for type 2 diabetes, which raises the possibility that glucocorticoid receptor inhibition may mitigate the adverse metabolic effects of diabetic kidney disease.


Conflict of interest statement

The authors declare no competing interests.

Figures

Fig. 1
Fig. 1. snATAC-seq of human DKD.
A UMAP of snATAC-seq dataset. Six control and seven DKD samples with 68,458 cells. PCT-proximal convoluted tubule, PST-proximal straight tubule, PT_VCAM1-VCAM1(+) proximal tubule, PT_PROM1-PROM1(+) proximal tubule, PT_CD36-CD36(+) proximal tubule, PEC-parietal epithelial cells, ATL-ascending thin limb, TAL1-CLDN16(-) thick ascending limb, TAL2-CLDN16(+) thick ascending limb, DCT1-early distal convoluted tubule, DCT2-late distal convoluted tubule, PC-principal cells, ICA-type A intercalated cells, ICB-type B intercalated cells, PODO-podocytes, ENDO-endothelial cells, FIB_VSMC_MC-fibroblasts, vascular smooth muscle cells and mesangial cells, TCELL-T cells, BCELL-B cells, MONO-mononuclear cells. B Effect size and location of DAR in DKD. Control cell types were compared to DKD to identify cell-specific DAR (Source data are provided in Supplementary Dataset 3). Significance was evaluated with a Bonferroni-adjusted Wilcoxon Rank Sum test. DAR with padj < 0.05 that met an absolute log2-fold-change threshold of 0.1 (horizontal bars) were annotated relative to the nearest TSS. C DAR in DKD that are cell-specific or shared between cell types. DAR that were shared between multiple cell types or unique to a cell type are displayed. (Source data are provided in Supplementary Dataset 3). D Proximal tubule DAR pathway enrichment. Cell-specific DAR from PCT and PST were annotated with the nearest protein-coding gene to perform gene ontology enrichment. Fold-enrichment for all significant GO biological processes is shown and the top 25 are highlighted (Source data are provided as a Source Data file). E Proximal tubule-specific DAR and ATAC peaks in the insulin receptor. snATAC-seq coverage plots for DKD and control PCT are displayed. The orange arrow indicates a DAR in intron 2 that shows decreased accessibility in DKD (chr19:7196798-7198626, fold-change = 0.92, padj = 7.7 × 10−13). Differentially methylated regions (DMR) associated with end-stage kidney disease due to diabetes are shown as blue bars (see Methods). Green arcs depict the nodes of a cis-coaccessibility network (CCAN). Statistical significance was evaluated using a Bonferroni-adjusted Wilcoxon Rank Sum test. F Proximal tubule INSR expression by snRNA-seq. Control proximal tubule was compared to DKD to identify DEGs. DKD proximal tubule showed reduced INSR expression (fold-change = 0.78, padj = 1.2 × 10−27). Statistical significance was evaluated using a Bonferroni-adjusted Wilcoxon Rank Sum test.
Fig. 2
Fig. 2. snRNA-seq of human DKD.
A UMAP of snRNA-seq dataset. Six control and five DKD samples were aggregated, preprocessed, and filtered. A total of 39,176 cells are depicted. PT-proximal tubule, PT_VCAM1-VCAM1(+) proximal tubule, PEC-parietal epithelial cells, ATL-ascending thin limb, TAL1-CLDN16(-) thick ascending limb, TAL2-CLDN16(+) thick ascending limb, DCT1-early distal convoluted tubule, DCT2-late distal convoluted tubule, PC-principal cells, ICA-type A intercalated cells, ICB-type B intercalated cells, PODO-podocytes, ENDO-endothelial cells, MES-mesangial cells and vascular smooth muscle cells, FIB-fibroblasts, LEUK-leukocytes. B Proximal tubule DEG pathway enrichment. Significant cell-specific DEG from proximal tubule were used to perform gene ontology enrichment with Panther. Fold-enrichment for all significant GO biological processes is shown and the top 25 are highlighted (Source data are provided as a Source Data file). C DEG in DKD that are cell-specific or shared between cell types. DEG that were either shared between multiple cell types or unique to a specific cell type are displayed. DEG shared between multiple cell types are limited to groups that share ten or more DEG (Source data are provided in Supplementary Dataset 6). D Proximal tubule shows increased expression of gluconeogenic genes by snRNA-seq. Control proximal tubule was compared to DKD proximal tubule in the snRNA-seq dataset to identify differentially expressed genes with the FindMarkers function and visualized as violin plots and dot plots. DKD proximal tubule showed increased expression of PCK1, ALDOB, FBP1, and G6PC (see Supplementary Dataset 6 for adjusted p-values). E Proximal tubule-specific DAR and ATAC peaks in PCK1. snATAC-seq coverage plots for DKD and control PCT are displayed in relation to the PCK1 gene body. Orange bars indicate multiple DAR that show decreased accessibility in diabetic PCT (Supplementary Dataset 3). Green arcs depict the nodes of a cis-coaccessibility network (CCAN) surrounding the PCK1 gene body.
Fig. 3
Fig. 3. Transcribed cis-regulatory elements (tCRE) detected by 5-prime snRNA-seq.
A Distance from tCRE to TSS. Two control and two DKD samples were sequenced with 5’ paired-end sequencing and analyzed with SCAFE. A total of 37,698 tCRE were annotated with ChIPSeeker and displayed relative to the nearest TSS (Source data is provided as a Source Data file). B Annotation of tCRE. The relative proportion of tCRE in promoters, introns, exons, distal intergenic, 3-prime, and 5-prime regions is shown (Source data is provided as a Source Data file). C Overlap between tCRE and ATAC peaks. tCRE were intersected with cell-specific ATAC peaks and DAR in DKD using GenomicRanges. D Proximal convoluted tubule and PT_VCAM1 DAR and ATAC peaks in VCAM1. snATAC-seq coverage plots for PT_VCAM1 (green) and PCT (orange) are displayed in relation to the VCAM1 gene body. The orange arrows indicate DAR that show either increased or decreased accessibility in PT_VCAM1 relative to PCT (Supplementary Dataset 4). snATAC-seq peaks accessible in the proximal tubule are displayed (snATAC peaks, gray boxes) in the same track as PCT DAR (snATAC peaks, orange boxes). snRNA-seq tCRE regions are displayed below snATAC-seq peaks and DAR (snRNA tCRE, gray boxes). Differentially methylated regions (DMR) in publicly available databases associated with end-stage kidney disease due to diabetes are shown as blue bars (see Methods). Green arcs depict the nodes of a cis-coaccessibility network (CCAN) surrounding the VCAM1 gene body.
Fig. 4
Fig. 4. Glucocorticoid receptor (GR) CUT&RUN in bulk kidney cortex.
A Density of GR CUT&RUN sites relative to cell-specific ATAC peaks. Cell-specific ATAC peaks were identified with the Seurat FindMarkers function (Supplementary Dataset 2) and converted into a rainfall plot (green track) using the circlize package in R. Each dot in the rainfall plot corresponds to a cell-specific ATAC peak and the y-axis corresponds to the log-transformed minimal distance between the peak and its two neighboring peaks. Clusters of peaks appear as a “rainfall” in the plot. The density of cell-specific ATAC peaks (black track) and GR CUT&RUN peaks (purple track) are shown adjacent to the rainfall plot using a 10 Mb default window size. B Upset plot showing intersection between GR CUT&RUN sites and cell-specific ATAC peaks. Each column of the Upset plot indicates a unique grouping of ATAC peaks that intersect with bulk kidney GR CUT&RUN sites. The solid black circles in each column indicate which cell types are present within the intersection at the top of the plot. For example, the first column is a group of 14 ATAC peaks shared between PCT, ENDO, B-cells, and T-cells that each contain a GR CUT&RUN site that is not seen in other cell types. Only intersections with ten or more GR CUT&RUN sites are included in the plot. GR CUT&RUN sites that do not intersect a cell-specific ATAC peak are displayed as the black bar to the far right (N = 1296). The horizontal bars on the right of the Upset plot represent the total number of peaks within each cell type or GR CUT&RUN group (Source data is provided in Supplementary Dataset 2 and 11).
Fig. 5
Fig. 5. Glucocorticoid receptor (GR) binding and FKBP5 in DKD.
A Cell-specific transcription factor expression and motif enrichment. Transcription factors that were both differentially expressed (Supplementary Dataset 6) and showed motif enrichment in cell-specific DAR (Supplementary Dataset 13) were visualized. Cell types that showed differential expression and motif enrichment for GR (NR3C1, red), MR (NR3C2, blue), and HIF1A (HIF1A, black) motifs are highlighted. PT-proximal tubule, PT_VCAM1-VCAM1(+) proximal tubule cells, PEC-parietal epithelial cells, TAL1-CLDN16(-) thick ascending limb, TAL2-CLDN16(+) thick ascending limb, DCT2-late distal convoluted tubule, PC-principal cells, ICA-type A intercalated cells. B Cell-specific chromVAR motif activity for GR and REL. chromVAR was used to compute cell-specific activities for NR3C1 and REL motifs for control and DKD. Red arrows indicate significantly decreased motif activity and green arrows indicate increased activity (see Supplementary Dataset 14). C Transcription factor footprinting for GR. Transcription factor footprinting analysis was performed for NR3C1 (GR) for all cell types and for PCT only to quantitate Tn5 insertion enrichment. D Interaction between PCT DAR and hTERT-RPTEC GR CUT&RUN sites. PCT DAR in DKD (Supplementary Dataset 3) were intersected with cis-coaccessibility networks (CCAN) to identify all CCAN links that contain at least one PCT DAR. These regions were intersected with hTERT-RPTEC GR CUT&RUN sites and visualized with the circlize package in R to identify links between GR CUT&RUN sites and PCT DAR. E PCT-specific DAR and ATAC peaks in FKBP5. snATAC-seq coverage plots for DKD and control PCT are displayed in relation to FKBP5. The orange arrow indicates a DAR that shows decreased accessibility in DKD (Supplementary Dataset 3). PCT-specific ATAC peaks (Peaks, dark gray boxes) and DAR (Peaks, orange box) are shown in relation to hTERT-RPTEC CUT&RUN sites (GR, purple boxes), differentially methylated regions (DMR) associated with end-stage kidney disease due to diabetes (see Methods), and a cis-coaccessibility network (CCAN, green arcs) surrounding FKBP5. Blue stars indicate sites targeted by CRISPRi. F Cell-specific expression of FKBP5 by snRNA-seq. Individual cell types were compared between control and DKD and visualized to display relative change in FKBP5 expression. Red arrows indicate decreased FKBP5 expression (see Supplementary Dataset 6 for adjusted p-values).
Fig. 6
Fig. 6. Knockdown of FKBP5 cis-regulatory elements with CRISPR interference.
A CRISPR interference diagram. dCas9-KRAB domain fusion protein and small guide RNAs (sgRNA) were used to target the TSS and a potential intronic CRE in the FKBP5 gene. Targeted regions are depicted as blue stars in the FKBP5 gene model diagram in Fig. 5E. sgRNA primers and region coordinates are provided in Supplementary Dataset 21. B, C Quantitative PCR of CRISPRi. RT and real-time PCR analysis of mRNAs for FKBP5 and surrounding genes (MAPK14, PPARD, SPRK1 and TEAD3) in primary renal proximal tubular epithelial cells (primary RPTEC) with CRISPR interference targeting the TSS and predicted cis-regulatory element (CRE) for FKBP5. NT, non-targeting control. Each group consists of n = 2 biologically independent experiments each with n = 3 biological replicates (2 sgRNAs with 3 biological replicates). Bar graphs represent the mean and error bars are the s.d. p-values are calculated with one-way ANOVA and a post-hoc Dunnett’s test for multiple comparisons. Statistical significance was evaluated as an adjusted p-value < 0.05 (Source data are provided as a Source Data file).
Fig. 7
Fig. 7. Partitioned heritability of GWAS traits and predicted allelic effects with SALSA.
A Cell-specific analysis. Cell-type-specific ATAC peaks (Supplementary Dataset 2) were partitioned for heritability of GWAS traits using the ldsc cell-type-specific workflow. Significance was evaluated with a Benjamini-Hochberg-adjusted one-sided test using padj <  0.05. N = 13 biologically independent samples containing 68,458 cells were examined in a joint analysis (Source data are provided as a Source Data file). B Cell-specific DAR that change in DKD. Cell-specific DAR in DKD (Supplementary Dataset 3) were analyzed with ldsc using the cell-type-specific workflow. Significance was evaluated as described above. C Ratio of snATAC-seq fragments in the proximal tubule. SALSA was used to identify heterozygous SNV in the proximal tubule (PCT, PST) and counts mapping to the reference or alternate allele were aggregated across libraries and evaluated for allele-specific chromatin accessibility using an exact binomial test (see Supplementary Dataset 20. D Predicting an allele-specific effect with SALSA. The presence of a fragment mapping to an alternate allele in a proximal tubule peak (binary dependent variable) was modeled as a function of target gene expression (continuous predictor variable) after controlling for sample-to-sample variability with a mixed effect per library using glmer in lme4. Effect size is displayed in log-odds where a 1 unit increase corresponds to a 1% increase in gene expression. N = 11 biologically independent samples containing 26,929 proximal tubule cells were examined in a joint analysis (see Supplementary Dataset 20). E Partitioned heritability of proximal tubule peaks with a predicted effect. Peaks that were associated with changes in target gene expression were partitioned for heritability of eGFR for each of three generalized linear mixed models in addition to peaks that met the binomial threshold for allele-specific chromatin accessibility. Significance was evaluated with a Benjamini-Hochberg-adjusted one-sided test using padj < 0.05. N = 11 biologically independent samples were examined in a joint analysis (Source data are provided as a Source Data file). F Overlap between proximal tubule DAR and peaks with a predicted effect. DAR from PCT and PST were intersected with proximal tubule peaks with a predicted effect in Model 3.
Fig. 8
Fig. 8. Model of altered glucocorticoid receptor signaling in the diabetic proximal tubule.
GR expression is increased in the diabetic proximal tubule. Cortisol binds GR and translocates to the nucleus where it localizes to glucocorticoid response elements (GRE) in genes like FKBP5. Decreased chromatin accessibility of GRE in the FKBP5 gene body is observed as reduced accessibility of proximal-tubule-specific ATAC peaks in DKD (red triangles). Reduced accessibility of FKBP5 GRE leads to reduced transactivation by GR and reduced FKBP5 expression. Reduced FKBP5 expression decreases activity of the GR negative feedback loop. In the absence of FKBP5 negative feedback, GR can exert both DNA-binding-dependent and DNA-binding-independent actions that lead to adverse metabolic effects, anti-inflammatory effects, and increased gluconeogenesis. GR hallmark pathway genes that are differentially expressed in our study include: CDKN1A, CREBBP, EGR1, FKBP5, FOS, HSP90AA1, ICAM1, JUN, MAPK10, NCOA2, NFKB1, NR3C1, NR4A1, PBX1, PCK2, PRKACB, SGK1, SMARCA4, STAT1, STAT5A, STAT5B.

References

    1. Johansen KL, et al. US Renal Data System 2020 Annual Data Report: Epidemiology of Kidney Disease in the United States. Am. J. Kidney Dis. 2021;77:A7–A8. doi: 10.1053/j.ajkd.2021.01.002. - DOI - PMC - PubMed
    1. Boer IH, et al. KDIGO 2020 clinical practice guideline for diabetes management in chronic kidney disease. Kidney Int. 2020;98:S1–115. doi: 10.1016/j.kint.2020.06.019. - DOI - PubMed
    1. Muto Y, et al. Single cell transcriptional and chromatin accessibility profiling redefine cellular heterogeneity in the adult human kidney. Nat. Commun. 2021;12:2190. doi: 10.1038/s41467-021-22368-w. - DOI - PMC - PubMed
    1. Stuart T, et al. Comprehensive integration of single-cell data. Cell. 2019;177:1888–1902.e21. doi: 10.1016/j.cell.2019.05.031. - DOI - PMC - PubMed
    1. Bauerle KT, Harris C. Glucocorticoids and diabetes. Mo Med. 2016;113:378–383. - PMC - PubMed

Publication types

MeSH terms