

Cerebro-cerebellar motor networks in clinical subtypes of Parkinson's disease
- PMID: 36068246
- PMCID: PMC9448730
- DOI: 10.1038/s41531-022-00377-w
Cerebro-cerebellar motor networks in clinical subtypes of Parkinson's disease
Abstract
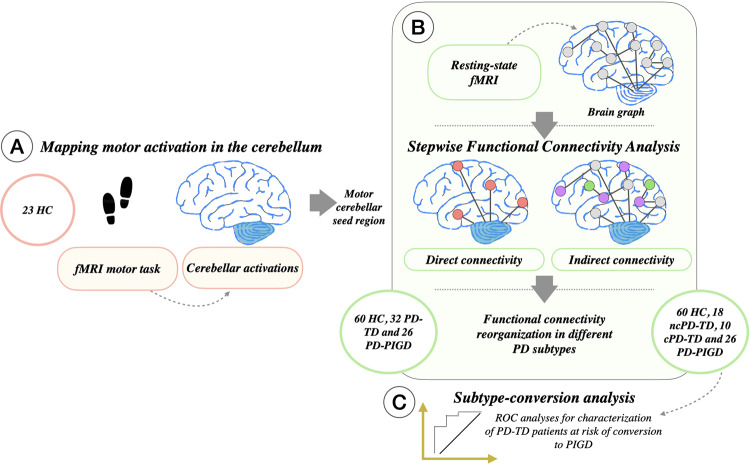
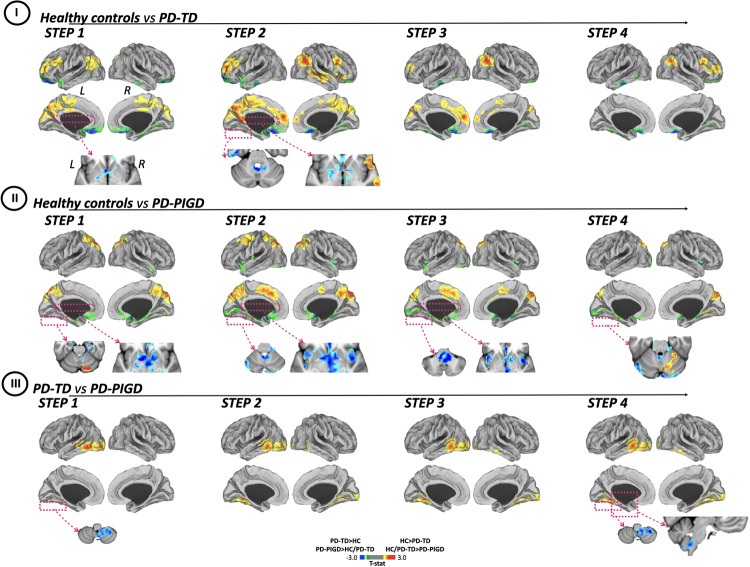
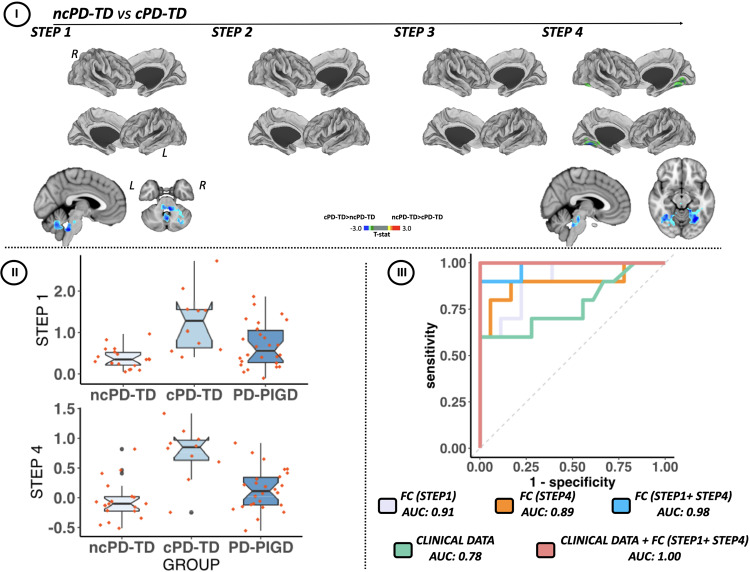
Parkinson's disease (PD) patients can be classified in tremor-dominant (TD) and postural-instability-and-gait-disorder (PIGD) motor subtypes. PIGD represents a more aggressive form of the disease that TD patients have a potentiality of converting into. This study investigated functional alterations within the cerebro-cerebellar system in PD-TD and PD-PIGD patients using stepwise functional connectivity (SFC) analysis and identified neuroimaging features that predict TD to PIGD conversion. Thirty-two PD-TD, 26 PD-PIGD patients and 60 healthy controls performed clinical/cognitive evaluations and resting-state functional MRI (fMRI). Four-year clinical follow-up data were available for 28 PD-TD patients, who were classified in 10 converters (cTD-PD) and 18 non-converters (ncTD-PD) to PIGD. The cerebellar seed-region was identified using a fMRI motor task. SFC analysis, characterizing regions that connect brain areas to the cerebellar seed at different levels of link-step distances, evaluated similar and divergent alterations in PD-TD and PD-PIGD. The discriminatory power of clinical data and/or SFC in distinguishing cPD-TD from ncPD-TD patients was assessed using ROC curve analysis. Compared to PD-TD, PD-PIGD patients showed decreased SFC in temporal lobe and occipital lobes and increased SFC in cerebellar cortex and ponto-medullary junction. Considering the subtype-conversion analysis, cPD-TD patients were characterized by increased SFC in temporal and occipital lobes and in cerebellum and ponto-medullary junction relative to ncPD-TD group. Combining clinical and SFC data, ROC curves provided the highest classification power to identify conversion to PIGD. These findings provide novel insights into the pathophysiology underlying different PD motor phenotypes and a potential tool for early characterization of PD-TD patients at risk of conversion to PIGD.
© 2022. The Author(s).
Conflict of interest statement
S.B., A.F., C.C., R.B., I.S., V.M., E.S., A.G., R.D.M., L.A., and E.S. report no disclosures. F.A. is Section Editor of NeuroImage: Clinical; has received speaker honoraria from Biogen Idec, Roche and Zambon; and receives or has received research supports from the Italian Ministry of Health, AriSLA (Fondazione Italiana di Ricerca per la SLA), Foundation Research on Alzheimer Disease and the European Research Council. T.S. has received speaker honoraria from Actavis and Alzheimer’s Association International Research Grant. V.S.K. has received speaker honoraria from Actavis and Solveo. M.F. is Editor-in-Chief of the Journal of Neurology; received compensation for consulting services and/or speaking activities from Bayer, Biogen Idec, Merck-Serono, Novartis, Roche, Sanofi Genzyme, Takeda, and Teva Pharmaceutical Industries; and receives research support from Biogen Idec, Merck-Serono, Novartis, Roche, Teva Pharmaceutical Industries, Italian Ministry of Health, Fondazione Italiana Sclerosi Multipla, and ARiSLA (Fondazione Italiana di Ricerca per la SLA).
Figures
Similar articles
-
Differences in gray matter atrophy and functional connectivity between motor subtypes of Parkinson's disease.Acta Neurol Belg. 2024 Dec;124(6):1899-1911. doi: 10.1007/s13760-024-02610-0. Epub 2024 Jul 27. Acta Neurol Belg. 2024. PMID: 39066885
-
Different patterns of spontaneous brain activity between tremor-dominant and postural instability/gait difficulty subtypes of Parkinson's disease: a resting-state fMRI study.CNS Neurosci Ther. 2015 Oct;21(10):855-66. doi: 10.1111/cns.12464. CNS Neurosci Ther. 2015. PMID: 26387576 Free PMC article.
-
Aberrant inter-network functional connectivity in drug-naive Parkinson's disease patients with tremor dominant and postural instability and gait difficulty.Front Hum Neurosci. 2023 Feb 2;17:1100431. doi: 10.3389/fnhum.2023.1100431. eCollection 2023. Front Hum Neurosci. 2023. PMID: 36816505 Free PMC article.
-
Cerebellar alterations in Parkinson's disease with postural instability and gait disorders.J Neurol. 2023 Mar;270(3):1735-1744. doi: 10.1007/s00415-022-11531-y. Epub 2022 Dec 19. J Neurol. 2023. PMID: 36534200
-
Executive function network's white matter alterations relate to Parkinson's disease motor phenotype.Neurosci Lett. 2021 Jan 10;741:135486. doi: 10.1016/j.neulet.2020.135486. Epub 2020 Nov 5. Neurosci Lett. 2021. PMID: 33161103 Free PMC article.
Cited by
-
Altered Functional Connectivity of the Subthalamic Nucleus in Parkinson's Disease: Focus on Candidates for Deep Brain Stimulation.J Parkinsons Dis. 2023;13(5):797-809. doi: 10.3233/JPD-230005. J Parkinsons Dis. 2023. PMID: 37270810 Free PMC article.
-
Neural correlates of bradykinesia in Parkinson's disease: a kinematic and functional MRI study.NPJ Parkinsons Dis. 2024 Sep 6;10(1):167. doi: 10.1038/s41531-024-00783-2. NPJ Parkinsons Dis. 2024. PMID: 39242570 Free PMC article.
-
Altered brain connectivity in hyperkinetic movement disorders: A review of resting-state fMRI.Neuroimage Clin. 2023;37:103302. doi: 10.1016/j.nicl.2022.103302. Epub 2022 Dec 24. Neuroimage Clin. 2023. PMID: 36669351 Free PMC article.
-
Data-Driven Discovery of Movement-Linked Heterogeneity in Neurodegenerative Diseases.Nat Mach Intell. 2024 Sep;6(9):1034-1045. doi: 10.1038/s42256-024-00882-y. Epub 2024 Aug 9. Nat Mach Intell. 2024. PMID: 40357335 Free PMC article.
-
White matter alterations in tremor-dominant and postural instability and gait disturbance subtypes of Parkinson's disease.J Neural Transm (Vienna). 2025 Aug 11. doi: 10.1007/s00702-025-03001-2. Online ahead of print. J Neural Transm (Vienna). 2025. PMID: 40788494
References
Grants and funding
LinkOut - more resources
Full Text Sources
