. 2022 Nov;127(9):1603-1614.
doi: 10.1038/s41416-022-01933-0. Epub 2022 Sep 6.

Spatiotemporal analysis of tumour-infiltrating immune cells in biliary carcinogenesis

Affiliations

Spatiotemporal analysis of tumour-infiltrating immune cells in biliary carcinogenesis

Alphonse Charbel et al. Br J Cancer. 2022 Nov.

Abstract

Background: Intraductal papillary neoplasms (IPN) and biliary epithelial neoplasia (BilIN) are well-defined precursor lesions of biliary tract carcinoma (BTC). The aim of this study was to provide a comprehensive characterisation of the inflammatory microenvironment in BTC precursor lesions.

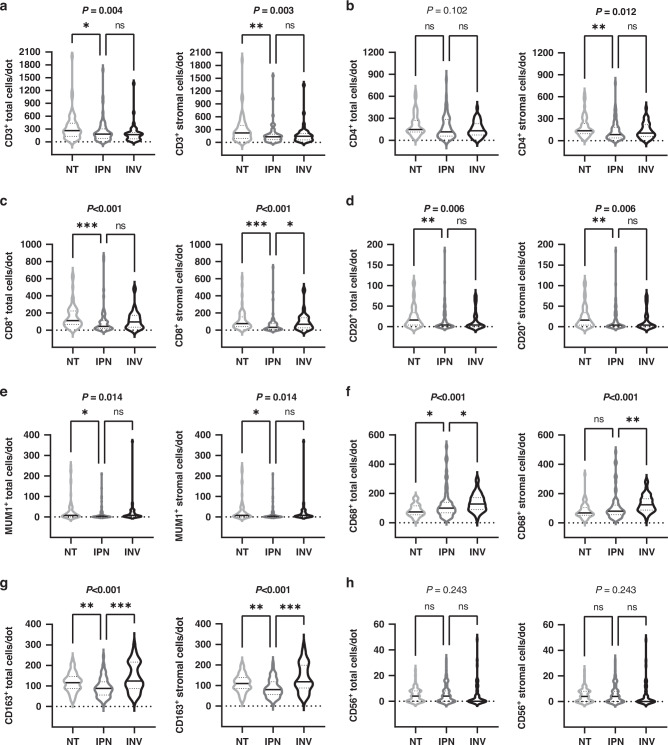
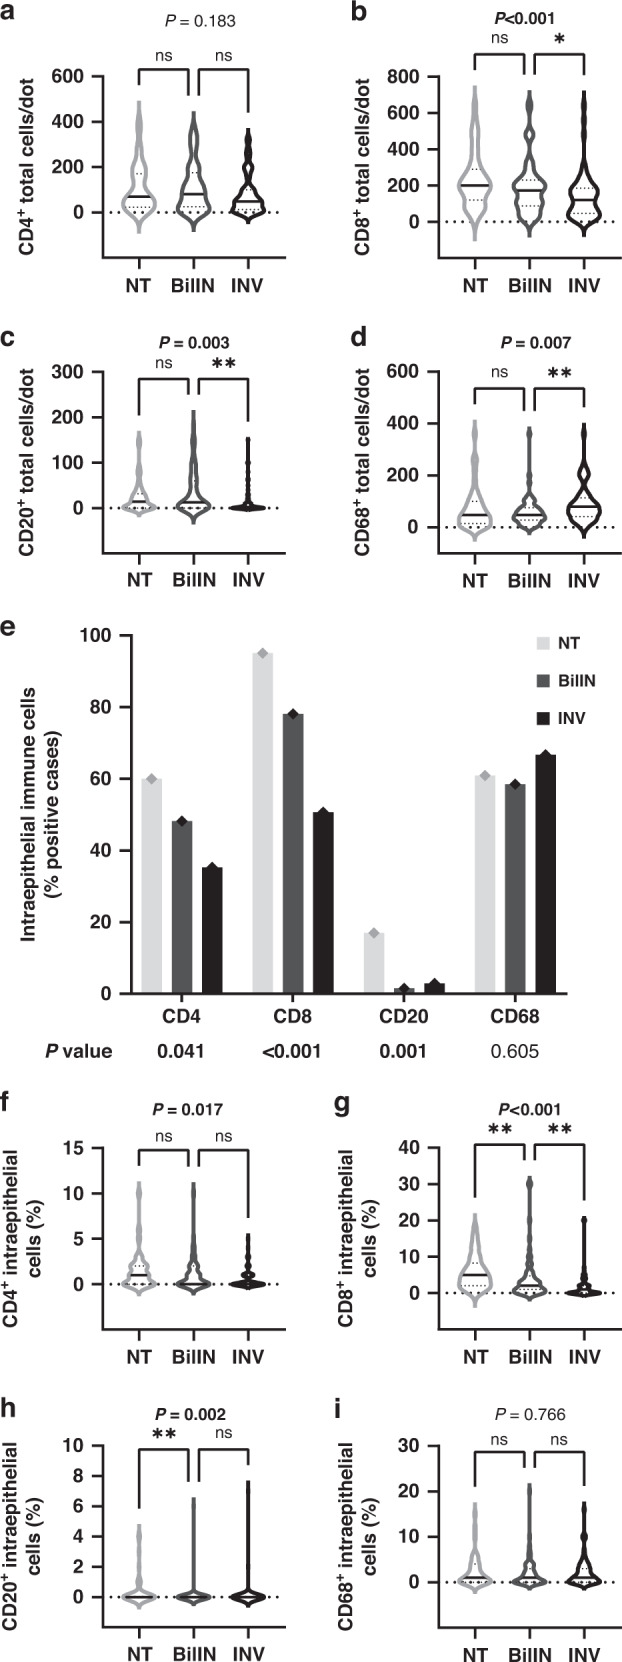
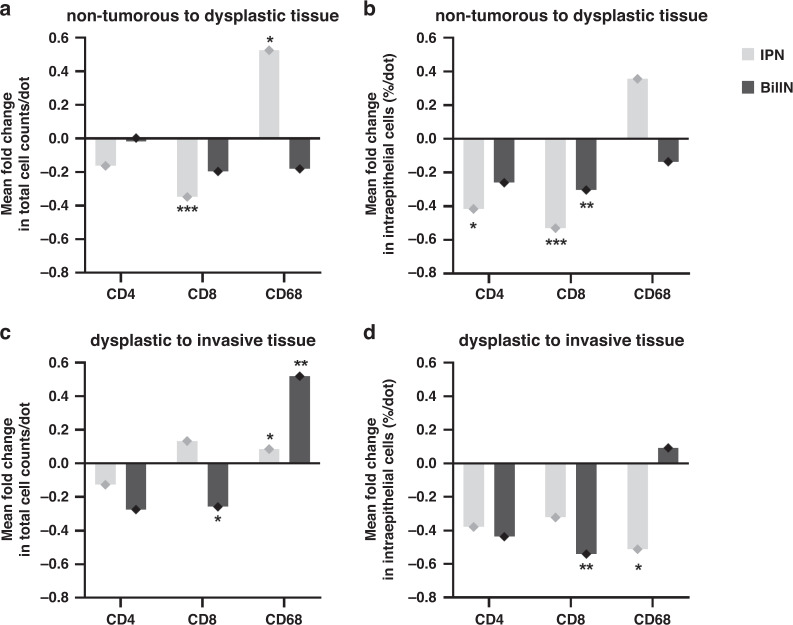
Methods: Immunohistochemistry was employed to assess tumour-infiltrating immune cells in tissue samples from patients, for whom precursor lesions were identified alongside invasive BTC. The spatiotemporal evolution of the immune microenvironment during IPN-associated carcinogenesis was comprehensively analysed using triplet sample sets of non-neoplastic epithelium, precursor lesion and invasive BTC. Immune-cell dynamics during IPN- and BilIN-associated carcinogenesis were subsequently compared.

Results: Stromal CD3+ (P = 0.002), CD4+ (P = 0.007) and CD8+ (P < 0.001) T cells, CD20+ B cells (P = 0.008), MUM1+ plasma cells (P = 0.012) and CD163+ M2-like macrophages (P = 0.008) significantly decreased in IPN compared to non-tumorous biliary epithelium. Upon transition from IPN to invasive BTC, stromal CD68+ (P = 0.001) and CD163+ (P < 0.001) macrophages significantly increased. In contrast, BilIN-driven carcinogenesis was characterised by significant reduction of intraepithelial CD8+ T-lymphocytic infiltration from non-tumorous epithelium via BilIN (P = 0.008) to BTC (P = 0.004).

Conclusion: IPN and BilIN are immunologically distinct entities that undergo different immune-cell variations during biliary carcinogenesis. Intraepithelial CD8+ T-lymphocytic infiltration of biliary tissue decreased already at the IPN-precursor stage, whereas BilIN-associated carcinogenesis showed a slowly progressing reduction towards invasive carcinoma.


Conflict of interest statement

PS: grant, boards and presentations from Novartis, and boards from Incyte. BG: advisory board from Novartis.

Figures

Fig. 1
Fig. 1. Study design and cohort characterisation.
a A total of 139 patients with biliary tract cancer precursor lesions were included in this study: n = 65 high-grade intraductal papillary neoplasms of the biliary tract (IPNB/ITPN), n = 74 high-grade BilIN and their associated invasive and non-tumorous counterparts were selected for tissue microarray construction. Scale bars represent 100 µm. Images were acquired at ×20 magnification. b Representative immunohistochemical staining of a tissue microarray dot showing CD8+ lymphocytes in the stromal (S) and intraepithelial (E) compartments of IPNB tissue. c Kaplan–Meier survival curves of IPN- and BilIN-associated cases.
Fig. 2
Fig. 2. Distribution of total and stromal inflammatory cell infiltrates in intraductal papillary neoplasms of the biliary tract (IPN), their associated invasive BTC (INV) and non-tumorous tissue (NT).
ah Total and stromal counts of a CD3+ T lymphocytes (NT: n = 56; IPN: n = 65; INV: n = 41), b CD4+ T lymphocytes (NT: n = 57; IPN: n = 65; INV: n = 41), c CD8+ T lymphocytes (NT: n = 57; IPN: n = 65; INV: n = 41), d CD20+ B lymphocytes (NT: n = 60; IPN: n = 65; INV: n = 43), e MUM1+ plasma cells (NT: n = 59; IPN: n = 65; INV: n = 42), f CD68+ macrophages (NT: n = 58; IPN: n = 65; INV: n = 42), g CD163+ macrophages (NT: n = 56; IPN: n = 65; INV: n = 42) and h CD56+ NK cells (NT: n = 57; IPN: n = 65; INV: n = 44). Significant P values of Kruskal–Wallis test are shown in bold, followed by Dunn’s post hoc analysis. *P < 0.05, **P < 0.01, ***P < 0.001; ns not significant, NA not applicable.
Fig. 3
Fig. 3. Distribution of intraepithelial inflammatory cell infiltrates in intraductal papillary neoplasms of the biliary tract (IPN), their associated invasive BTC (INV) and non-tumorous tissue (NT).
a Percentage of cases showing any positive intraepithelial inflammatory cells in NT, IPN and INV. Significant P values of Pearson’s chi-squared test are shown in bold. bd Proportion per 100 biliary epithelial cells of intraepithelial, b CD3+ T lymphocytes, c CD4+ T lymphocytes, d CD8+ T lymphocytes. Significant P values of Kruskal–Wallis test are shown in bold, followed by Dunn’s post hoc analysis. e Spearman’s correlation between all assessed inflammatory parameters in intraductal papillary lesions (IPN). Significant correlations were marked with asterisks: *P < 0.05; **P < 0.01; ***P < 0.001; ns not significant, NA not applicable.
Fig. 4
Fig. 4. Distribution of inflammatory cell infiltrates in biliary intraepithelial neoplasia (BilIN), their associated invasive BTC (INV) and non-tumorous tissue (NT).
ad Total number of a CD4+ T lymphocytes (NT: n = 38; BilIN: n = 56; INV: n = 68), b CD8+ T lymphocytes (NT: n = 42; BilIN: n = 65; INV: n = 66), c CD20+ B lymphocytes (NT: n = 46; BilIN: n = 65; INV: n = 69) and d CD68+ macrophages (NT: n = 48; BilIN: n = 66; INV: n = 69). e Percentage of cases showing intraepithelial inflammatory cells in NT, IPN and INV. fi Proportion per 100 biliary epithelial cells of intraepithelial, f CD4+ T lymphocytes, g CD8+ T lymphocytes, h CD20+ B lymphocytes and i CD68+ macrophages. Significant P values of Kruskal–Wallis (ad, fi) followed by Dunn’s post hoc analysis and Pearson’s chi-squared test (e) are shown in bold. *P < 0.05, **P < 0.01, ***P < 0.001; ns not significant, NA not applicable.
Fig. 5
Fig. 5. Changes in immune-cell distribution throughout IPN- and BilIN-associated carcinogenesis.
ad Each bar represents the mean fold change of total cell counts or intraepithelial cell percentages between (a, b) non-tumorous to dysplastic tissue and (c, d) between dysplastic and invasive tissue. Asterisks above bars indicate significance for comparisons shown in Figs. 2, 3 and 4. *P < 0.05, **P < 0.01, ***P < 0.001.

References

    1. Brierley JD, Gospodarowicz MK, Wittekind C. (eds). TNM classification of malignant tumours. 8th edn. Hoboken, NJ, USA: Wiley-Blackwell; 2016. p. 272.
    1. Amin MB, Edge SB, Greene FL, Byrd DR, Brookland RK, Washington MK, et al. AJCC Cancer Staging Manual. 8th edn. Cham, Switzerland: Springer International Publishing; 2017. p. 1032.
    1. Banales JM, Marin JJG, Lamarca A, Rodrigues PM, Khan SA, Roberts LR, et al. Cholangiocarcinoma 2020: the next horizon in mechanisms and management. Nat Rev Gastroenterol Hepatol. 2020;17:557–88. doi: 10.1038/s41575-020-0310-z. - DOI - PMC - PubMed
    1. Kendall T, Verheij J, Gaudio E, Evert M, Guido M, Goeppert B, et al. Anatomical, histomorphological and molecular classification of cholangiocarcinoma. Liver Int. 2019;39:7–18. doi: 10.1111/liv.14093. - DOI - PubMed
    1. Braconi C, Roessler S, Kruk B, Lammert F, Krawczyk M, Andersen JB. Molecular perturbations in cholangiocarcinoma: Is it time for precision medicine? Liver Int. 2019;39:32–42. doi: 10.1111/liv.14085. - DOI - PubMed

Publication types