. 2022 Sep;19(9):1097-1108.
doi: 10.1038/s41592-022-01595-z. Epub 2022 Sep 6.

MIRA: joint regulatory modeling of multimodal expression and chromatin accessibility in single cells

Affiliations

MIRA: joint regulatory modeling of multimodal expression and chromatin accessibility in single cells

Allen W Lynch et al. Nat Methods. 2022 Sep.

Abstract

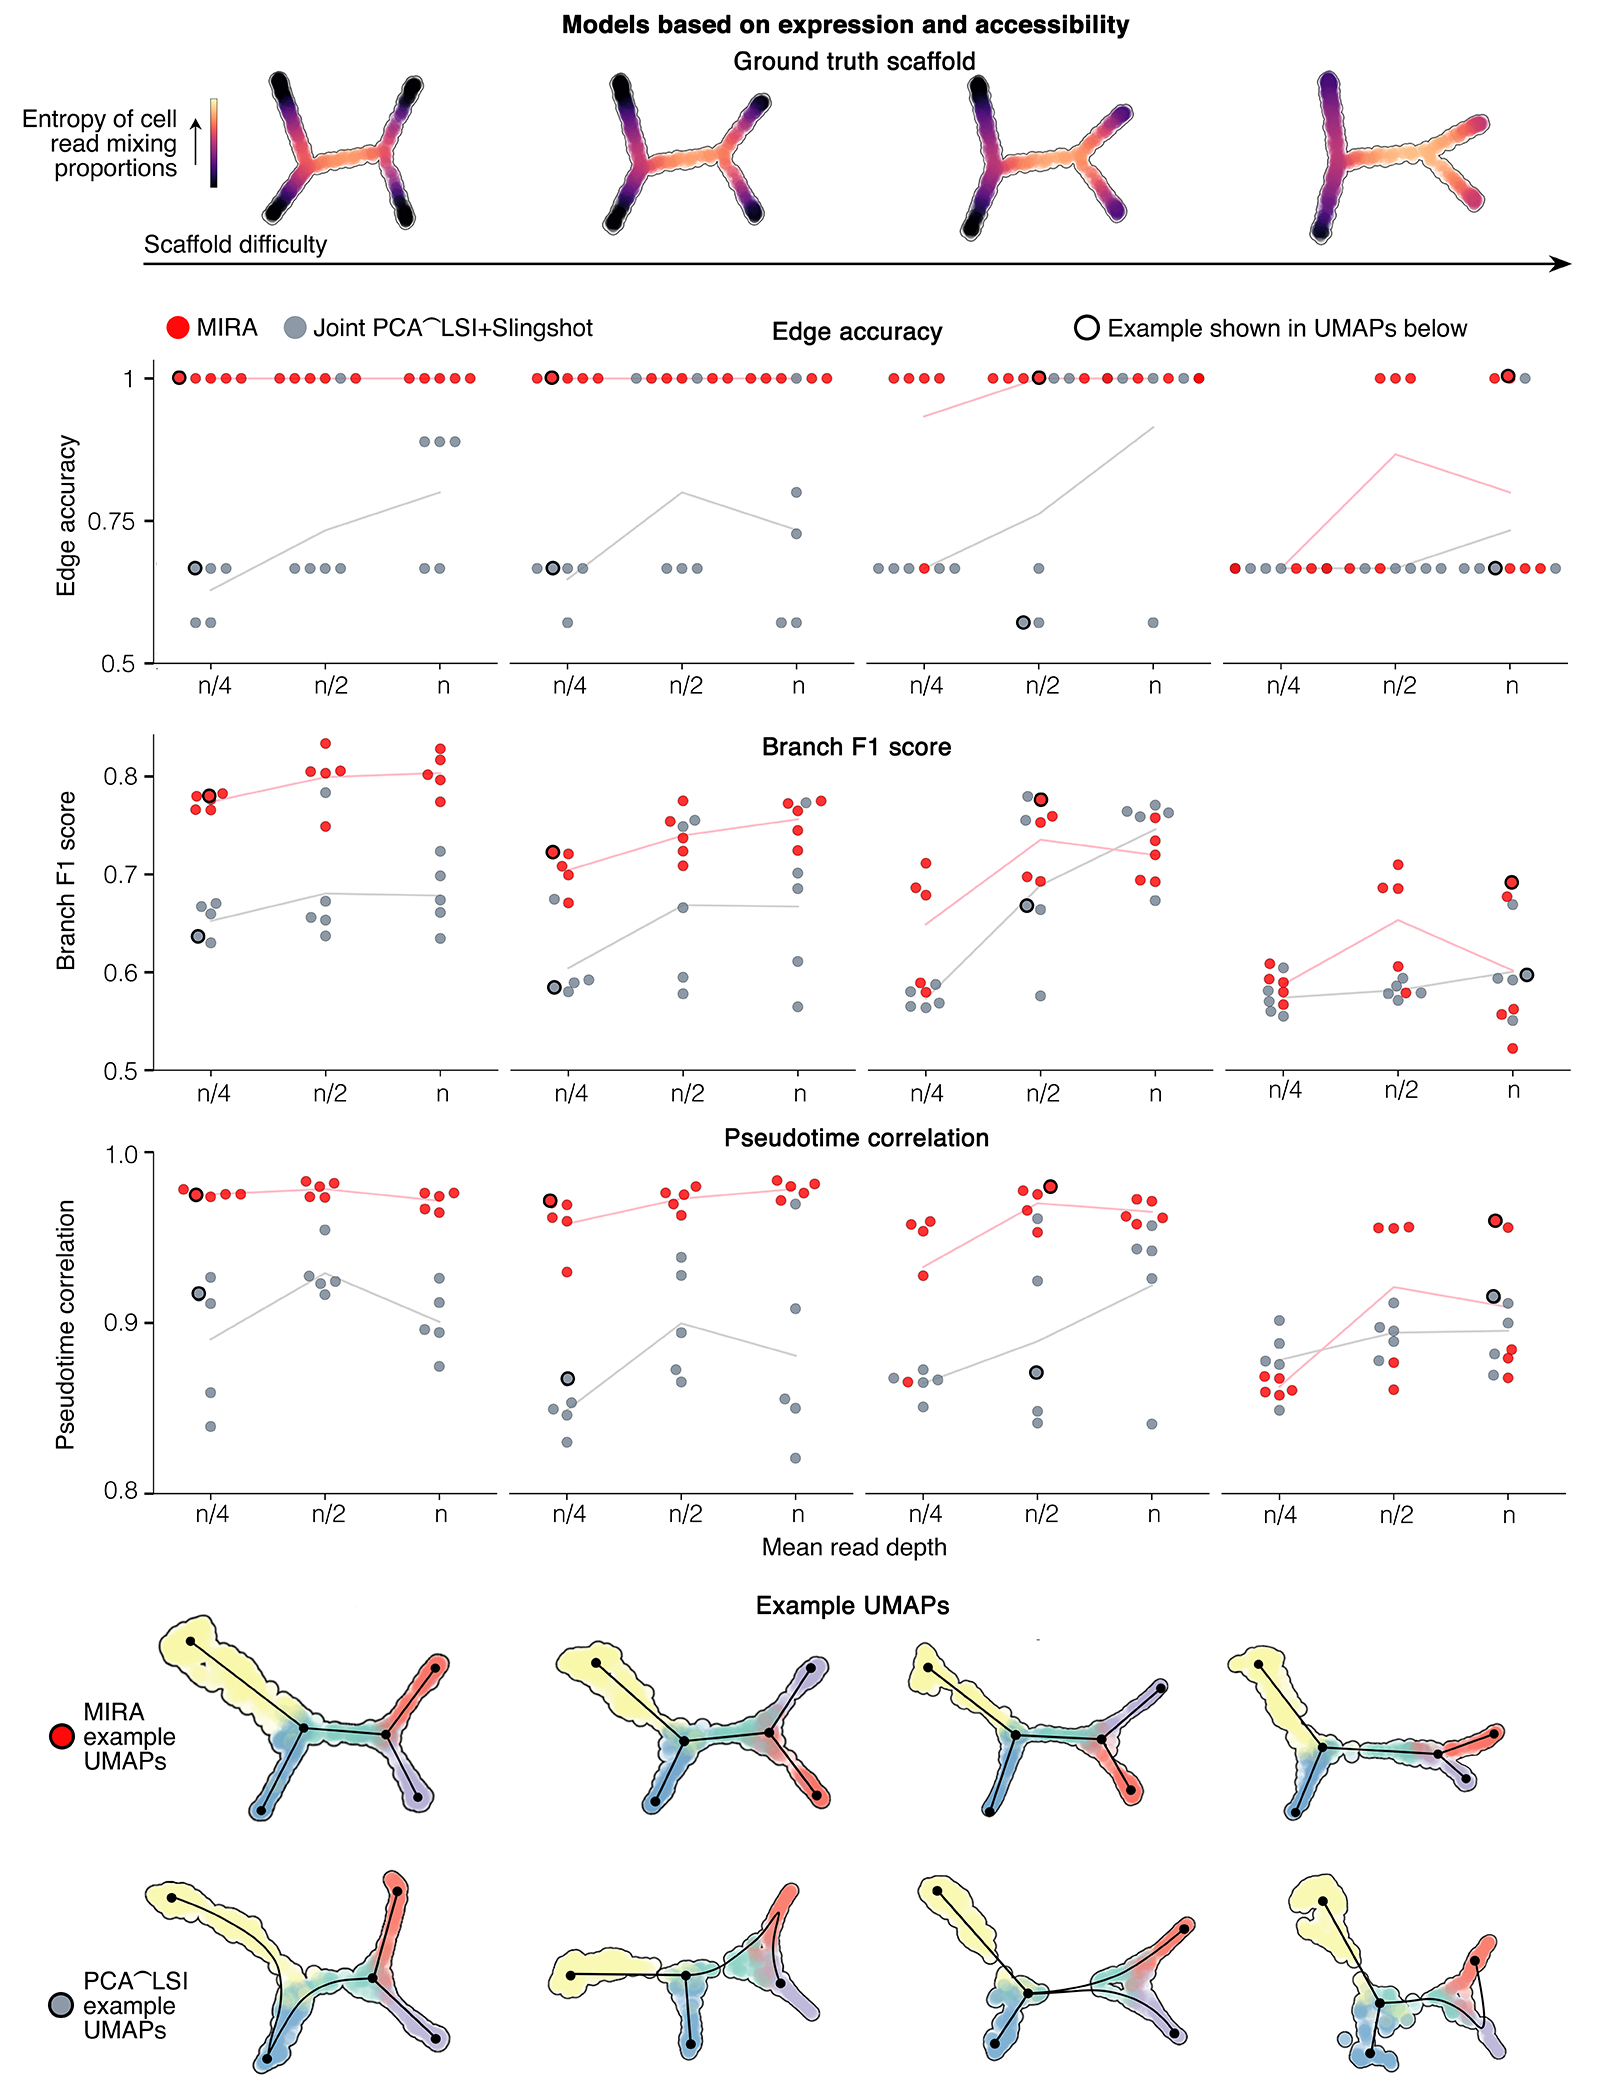
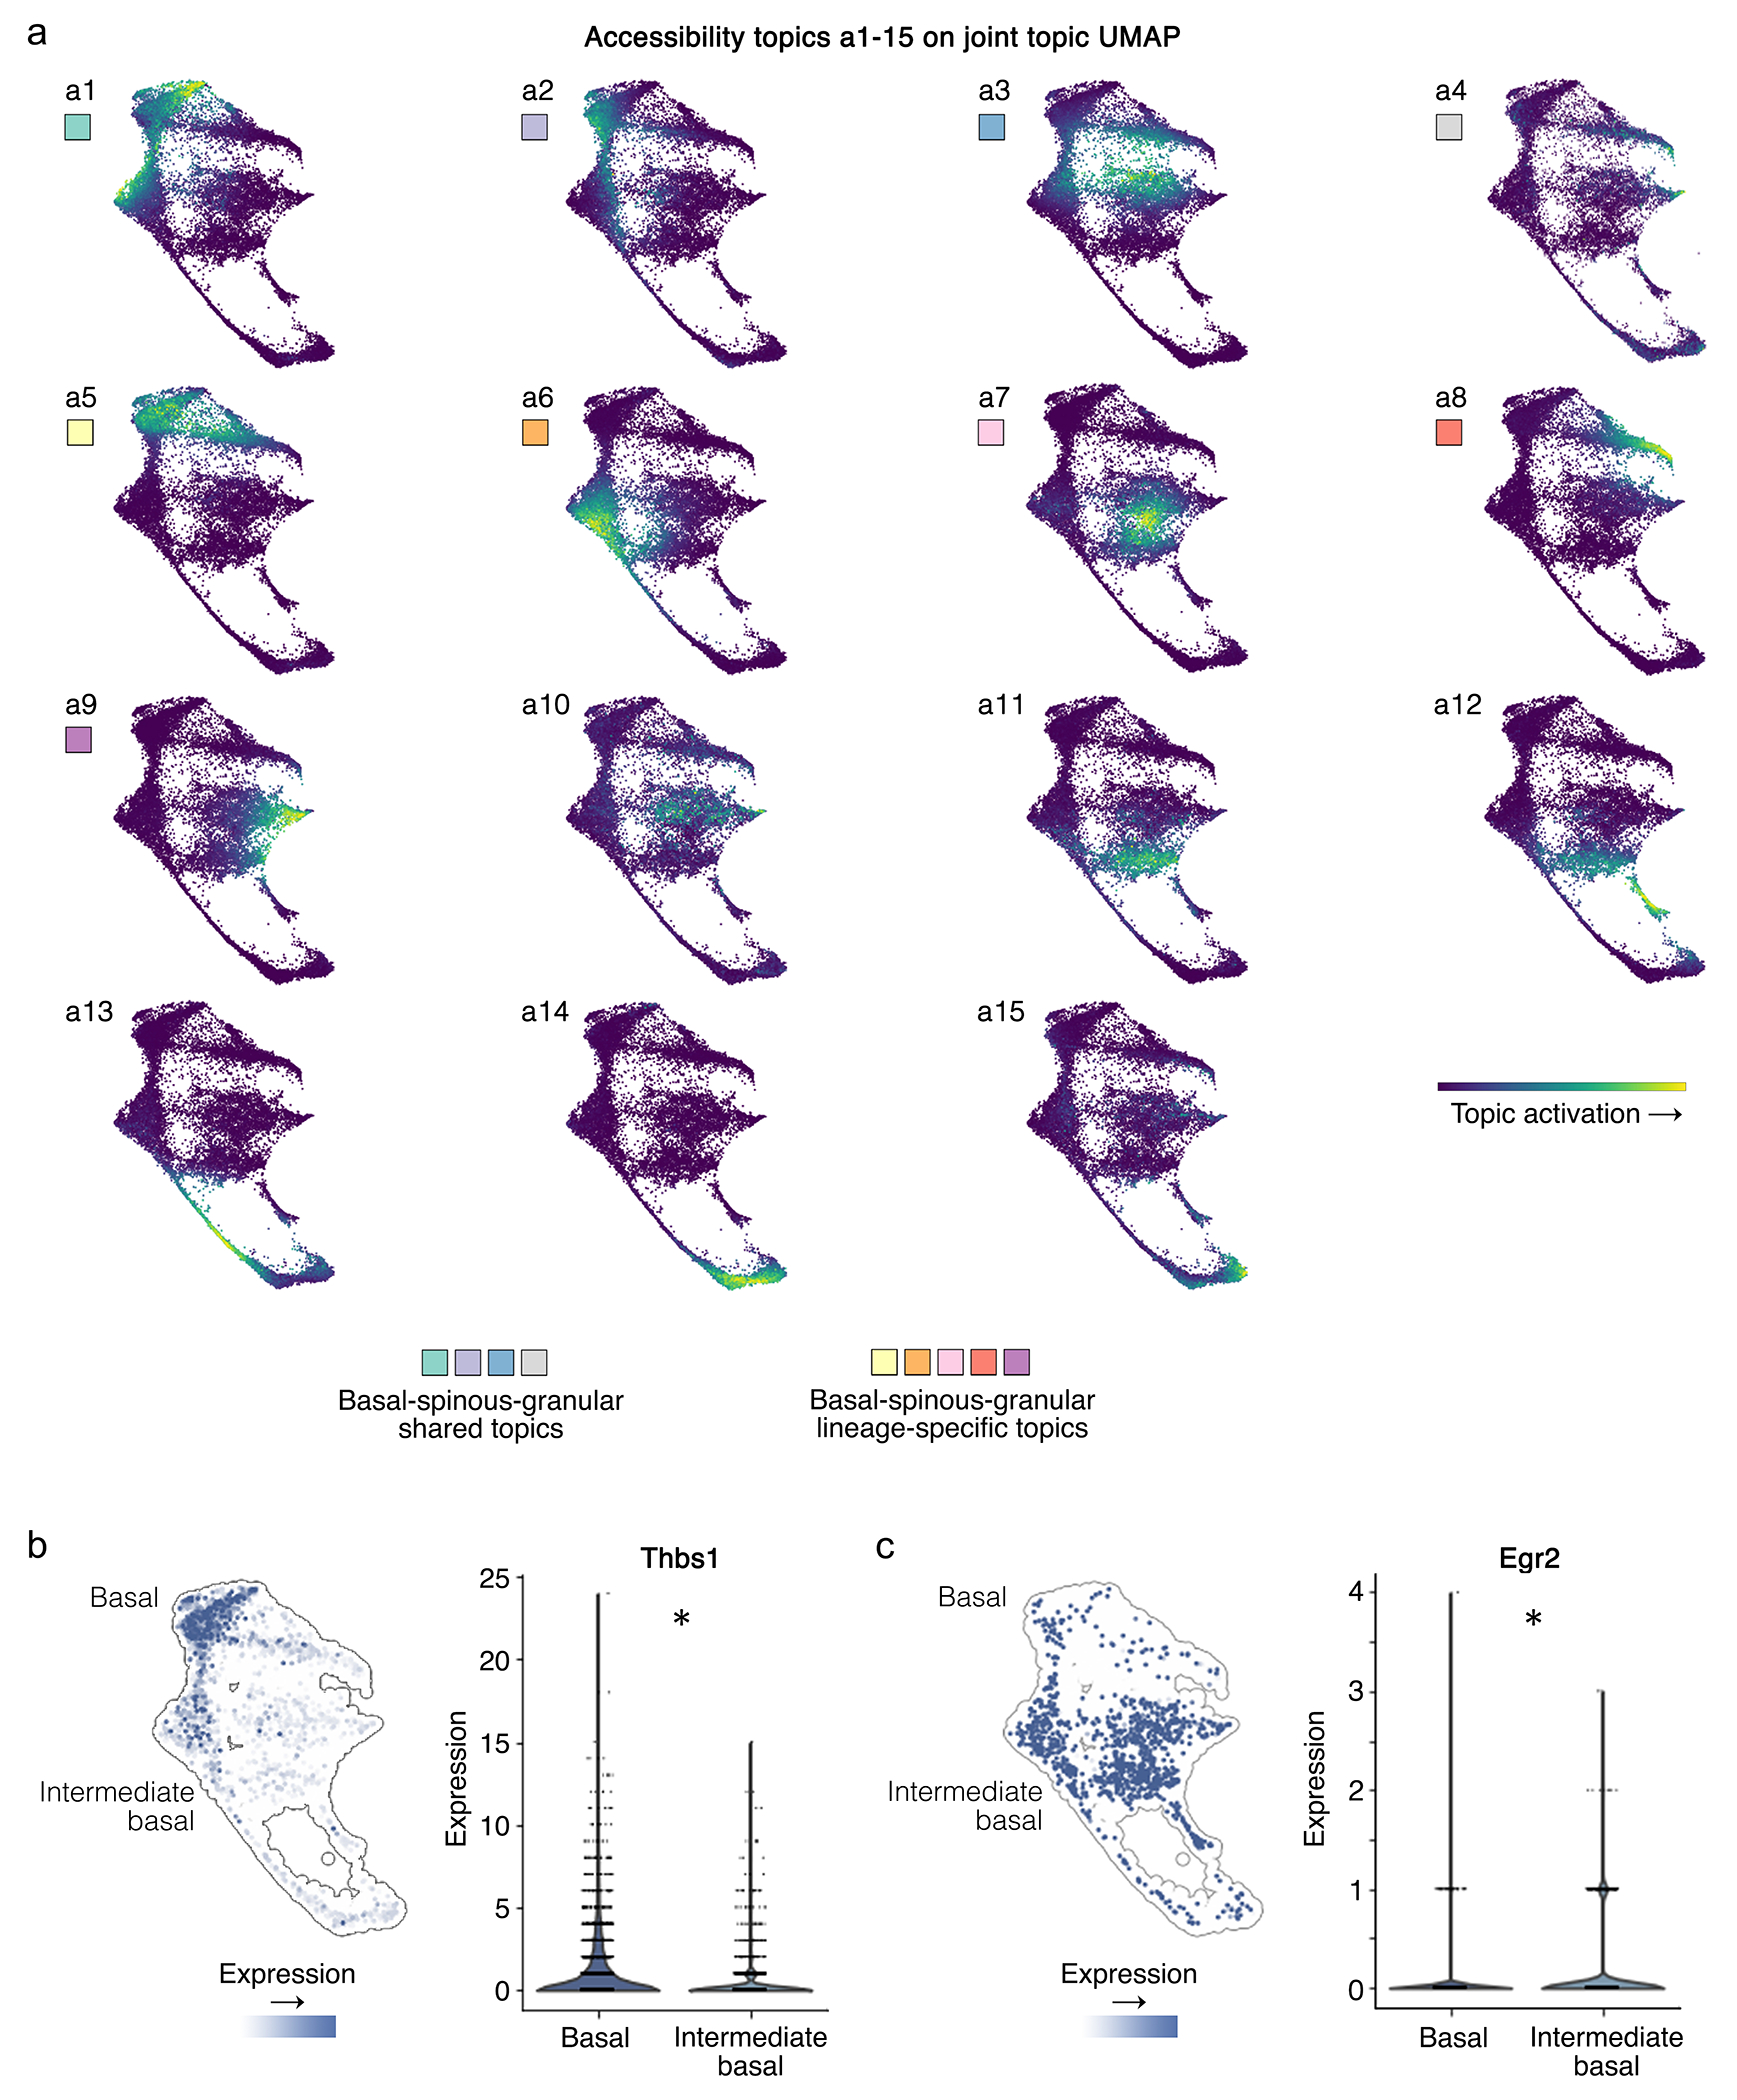
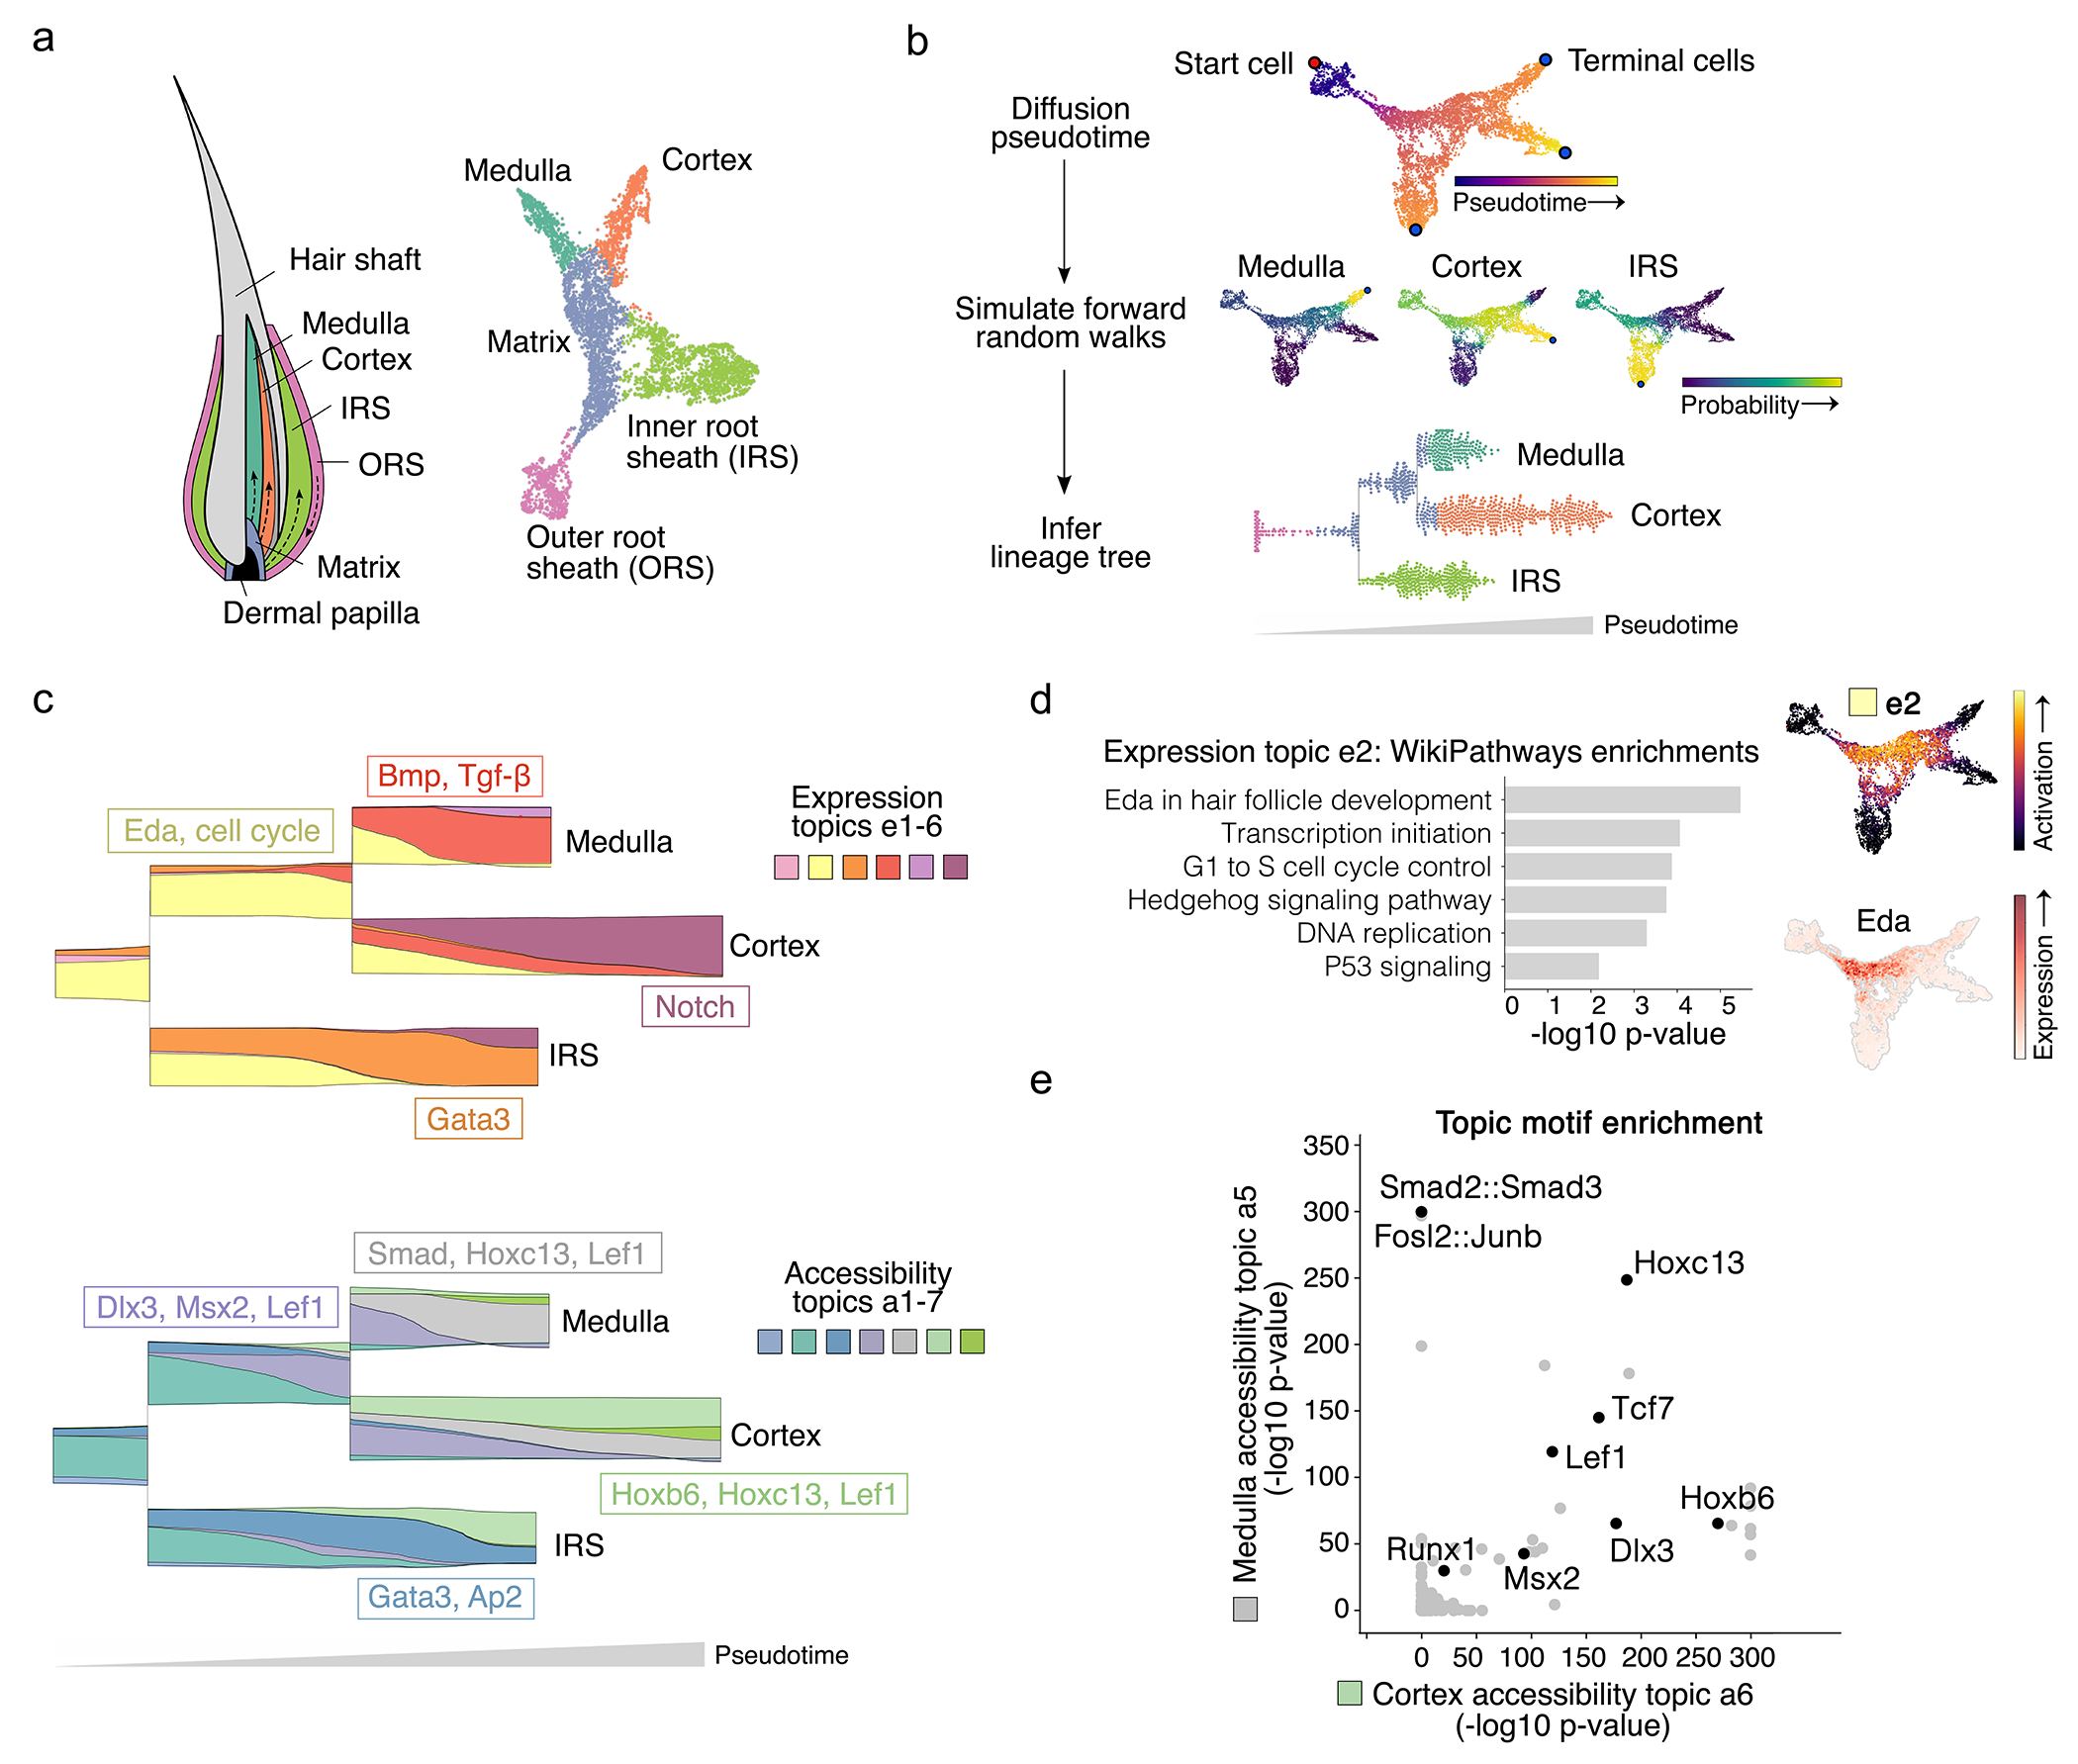
Rigorously comparing gene expression and chromatin accessibility in the same single cells could illuminate the logic of how coupling or decoupling of these mechanisms regulates fate commitment. Here we present MIRA, probabilistic multimodal models for integrated regulatory analysis, a comprehensive methodology that systematically contrasts transcription and accessibility to infer the regulatory circuitry driving cells along cell state trajectories. MIRA leverages topic modeling of cell states and regulatory potential modeling of individual gene loci. MIRA thereby represents cell states in an efficient and interpretable latent space, infers high-fidelity cell state trees, determines key regulators of fate decisions at branch points and exposes the variable influence of local accessibility on transcription at distinct loci. Applied to epidermal differentiation and embryonic brain development from two different multimodal platforms, MIRA revealed that early developmental genes were tightly regulated by local chromatin landscape whereas terminal fate genes were titrated without requiring extensive chromatin remodeling.


Conflict of interest statement

The remaining authors declare no competing interests.

Figures

Extended Data Fig. 1
Extended Data Fig. 1. Overview of MIRA topic model architecture
a, The MIRA topic model uses a variational autoencoder (VAE) approach to learn stochastic mappings between observations in X-space, gene-counts or peak-counts in a cell, which are high-dimensional and noisy, and a simpler latent Z-space or topic space, which exists on the simplex basis with a Dirichlet prior. (bottom right) The generative model relates the observations X to the estimated composition ρ over features (genes or peaks), sampling a negative binomial distribution for RNA counts and a multinomial distribution for ATAC peaks. (top right) The composition over features is given by the topic matrix β encoding topic-feature associations and the latent topics Z of a cell, which are sampled from the distribution qϕ(Z|X), the variational approximation of pϑ(Z|X). (top left) The distribution of Z is parameterized by μ and σ2, outputs from the encoder neural network given the X-space observations as inputs. (bottom left) The encoder neural network for RNA data performs deviance residual featurization of counts which are passed through feed-forward layers. The ATAC data encoder passes binarized peak accessibility features through a deep averaging network. (Illustration adapted from Kingma and Welling, Foundations and Trends in Machine Learning, 2019). b, Ratio of probability of medulla fate commitment versus cortex commitment of each cell in the hair follicle, arranged by pseudotime. MIRA defines branch points between cell states where probabilities of differentiating into one terminal state diverges from another. c, MIRA joint representation UMAP colored by ratio of probability of medulla fate commitment within the ORS, matrix, medulla, and cortex populations. Differentiation in the hair follicle proceeds from ORS to progenitor matrix cells, which then specify into the medulla or cortex fate. (IRS cells indicated in black are not included in this trajectory).
Extended Data Fig. 2
Extended Data Fig. 2. MIRA outperforms standard methodology for resolving cell state trajectories using expression data alone
Benchmarking results comparing MIRA to standard methodology of Seurat PCA+Slingshot in the indicated metrics of cell state trajectory inference using expression data alone. Top row shows ground truth scaffolds, which are computationally synthesized by mixing reads from distinct populations of single cells from a 10x Genomics dataset of peripheral blood mononuclear cells (PBMCs). Scaffold difficulty increases from left to right, where more difficult scaffolds contain cell states where mixture components are more similar (increased entropy), making them more difficult to distinguish by the tested lineage inference methodologies. Line plots indicate MIRA (red) versus Seurat PCA+Slingshot (blue) performance in each of the four scaffold difficulties with trials for three different mean read depths (lower read depth further increases the difficulty of solving the topology). For each trial, 5 replicates were tested for each modeling approach. Edge accuracy measures the accuracy of the inferred edges compared to ground truth (dynverse’s edge flip score). Branch F1 score measures the precision and recall of the inferred branches compared to ground truth. Pseudotime correlation measures the correlation between inferred versus ground truth pseudotime for each cell. The bottom rows show example UMAPs for MIRA or Seurat PCA+Slingshot for each scaffold difficulty with black edges showing cell state parsing from each algorithm. Cells colored by ground truth branch assignment where blue cells are the origin state. In the line plots above, black outlines indicate the points for the models shown in the example UMAPs.
Extended Data Fig. 3
Extended Data Fig. 3. MIRA outperforms standard methodology for resolving cell state trajectories using accessibility data alone
Benchmarking results comparing MIRA to standard methodology of Seurat LSI+Slingshot in the indicated metrics of cell state trajectory inference using accessibility data alone. Top row shows ground truth scaffolds with scaffold difficulty increasing from left to right. No models solved the topology of the most difficult scaffold using accessibility alone so metric comparisons are shown for the other three scaffolds. See Extended Data Fig. 3 for description of metrics.
Extended Data Fig. 4
Extended Data Fig. 4. MIRA outperforms standard methodology for resolving cell state trajectories using both expression and accessibility data jointly
Benchmarking results comparing MIRA joint representation to standard methodology of joint representation combining Seurat PCA of expression data and Seurat LSI of accessibility data followed by Slingshot. See Extended Data Fig. 3 for description of metrics. For expression data, mean read depth n=4000; for accessibility data, mean read depth n=14000.
Extended Data Fig. 5
Extended Data Fig. 5. MIRA topics describing hair follicle cells were sparse and nonredundant
a, UMAP based on standard methodology versus MIRA topic modeling for expression or accessibility. Standard PCA-based representation of expression shows matrix population as shifted away from its predecessor ORS and descendant IRS, medulla, and cortex cells. However, MIRA topic modeling of expression appropriately represents matrix cells as an intermediate population between the aforementioned lineages. Standard LSI-based representation of accessibility shows ORS cells interjected between matrix and its descendant IRS and shows medulla situated between two separate cortex populations. Conversely, MIRA topic modeling of accessibility appropriately represents matrix cells as continuous with its descendant IRS and better separates medulla and cortex into two distinct branches. b, MIRA joint topic representation of expression and accessibility. In (a-b), colors demonstrate expression of marker genes of indicated lineages. c, MIRA expression topics e1-6 and d, MIRA accessibility topics a1-7 on joint representation UMAP. In (c-d), colored boxes correspond to topic colors as on stream graphs in Fig. 2c and Extended Data Fig. 7a.
Extended Data Fig. 6
Extended Data Fig. 6. MIRA topics described gene modules activated in each lineage
a, Stream graph of window-averaged cell-topic compositions starting from ORS cell state, progressing rightward through pseudotime (to facilitate visualization of all lineages concurrently, pseudotime scale is not log-transformed, unlike other presented stream graphs). b, MIRA joint topic representation colored by expression of genes highly activated in each of the indicated topics, which described the activated gene modules in each lineage. c, MIRA joint topic representation colored by indicated motif scores.
Extended Data Fig. 7
Extended Data Fig. 7. Terminal medulla and cortex cells showed significantly higher NITE regulation compared to cells earlier in hair follicle differentiation
a, MIRA joint topic representation colored by expression of Hoxc genes, indicating that Hoxc motifs activated in both the medulla and cortex accessibility topics (a5 and a6, respectively) were most attributable to Hoxc13 based on its expression in these lineages. b, Correlation matrix between expression and accessibility topics. While some topics had a clear one-to-one correlation between modalities (e.g. expression topic e1 with accessibility topic a1), others did not strongly correlate with a single topic from the opposing modality (e.g. branch accessibility topic a4). c, Comparison of motif enrichment in top peaks of preceding matrix versus subsequent branch accessibility topics (a2 and a4, respectively). While most motifs were shared between these topics, accessibility of Wnt signaling-related motifs uniquely arose at the branch. d, Distribution of NITE scores among genes expressed in the hair follicle. Scores of example LITE gene Braf and NITE gene Krt23 are indicated by arrows. e, LITE gene Braf as shown in Fig. 3c but extended to include further downstream region. As described in Fig. 3c, plot shows chromatin accessibility fragments across pseudotime (moving downwards) in trajectories from ORS to matrix to cortex or medulla. Colored bars on the right indicate the identity of cells (colored by clusters in Fig. 2a) within each bin reflected by each row of accessibility fragments. Line plots across pseudotime depict the indicated gene’s observed expression (red) and LITE model prediction of expression (black), which is informed by the local accessibility reflected in the fragment plot. f, Medulla and cortex cells showed significantly more NITE regulation than other cells in the hair follicle (data are presented as mean values +/− standard deviation; rest n=4565, cortex/medulla n=1607; *p<0.05 (1.4e-13), two-sided Wilcoxon rank-sum). g, Genes ultimately expressed in medulla or cortex that were primed at the branch were defined as those with a NITE regulation score above the indicated thresholds that had positive chromatin differential at the branch, indicating that expression was overestimated based on local chromatin accessibility. Branch-primed genes must also be upregulated in the downstream lineage relative to matrix cells. h, Driver transcription factor analysis of non-primed medulla versus cortex genes.
Extended Data Fig. 8
Extended Data Fig. 8. MIRA expression topics describing IFE cells captured shared and lineage-specific states
a, Expression of marker genes of indicated lineages on MIRA expression, accessibility, and joint topic UMAPs. b, MIRA expression topics e1-13 on joint representation UMAP.
Extended Data Fig. 9
Extended Data Fig. 9. MIRA accessibility topics describing IFE cells captured shared and lineage-specific states
a, MIRA accessibility topics a1-15 on joint representation UMAP. Colored boxes correspond to topics indicated in Fig. 5h, which are shared or lineage-specific within the basal-spinous-granular or intermediate basal-spinous-granular differentiation trajectories as annotated in Fig. 5a–b. b, Thbs1 and c, Egr2 expression distinguished basal cells distant from the hair follicle from those within the intermediate basal-spinous-granular trajectory near the hair follicle (*p<0.05, two-sided Wilcoxon rank-sum, Benjamini-Hochberg corrected).
Extended Data Fig. 10
Extended Data Fig. 10. Terminal granular cells were enriched for NITE regulation
a, Stream graph of expression topic compositions of basal-spinous-granular (top) and intermediate basal-spinous-granular (bottom) lineages. b, Terminal IFE granular cells showed significantly more NITE regulation than cells earlier in the differentiation trajectory (basal and spinous cells) (data are presented as mean values +/− standard deviation; basal and spinous n=10850, granular n=1596; *p<0.05 (1.5e-15), two-sided Wilcoxon rank-sum). c, Genes upregulated in granular cells that were differentially-expressed between granular populations had significantly higher NITE scores than other genes (data are presented as mean values +/− standard deviation; rest n=4641, terminal and differentially-expressed granular genes n=241; *p<0.05 (0.041), two-sided Wilcoxon rank-sum). d, Examples of terminally upregulated, differentially-expressed granular genes’ local chromatin accessibility (LITE model prediction) and expression. Despite accessibility increasing in both lineages, expression only increased in one lineage. e, Mef2c was more highly expressed in excitatory neurons, indicating that Mef2 motifs enriched in the terminal excitatory neuron topic were likely attributable to Mef2c. f, Stream graphs of expression topics across cells state trajectory colored by NITE versus LITE regulation of the top genes in each topic. Topics describing earlier states tended towards LITE regulation with the notable exception of topic e3, which is composed of cell cycle genes that have been previously described to be regulated with minimal influence of local chromatin accessibility state. Topics describing terminal states tended more towards NITE regulation, including the major terminal excitatory and inhibitory neuron topics that are composed of neurotransmitter genes. Overall, expression topics describing the excitatory and inhibitory progenitor states (labeled mixed progenitor) were significantly enriched for LITE regulation, whereas after commitment to either the excitatory or inhibitory fate, topics were significantly enriched for NITE regulation (*p<0.05, two-sided Wilcoxon rank-sum, Benjamini-Hochberg corrected). g, Genes predicted by MIRA pISD modeling to be regulated by pioneer transcription factor Ascl1 showed significantly more LITE regulation compared to genes predicted to be regulated by non-pioneer-like Egr1 (data are presented as mean values +/− standard deviation; n=200; *p<0.05 (0.0464), two-sided Wilcoxon rank-sum).
Fig. 1 |
Fig. 1 |. Schematic of MIRA’s cell-level topic and gene-level RP models for integrated analysis of single cell multimodal transcription and accessibility data.
a, Schematic of MIRA’s variational autoencoder approach to modeling the transcription and chromatin accessibility topics defining each cell’s identity. The joint representation output can be leveraged for visualization and clustering, construction of high fidelity cell state trajectories, and rigorous topic analysis to determine regulators driving key fate decisions at trajectory branch points. b, MIRA’s RP model integrates transcriptional and chromatin accessibility data at each gene locus to determine how regulatory elements surrounding each gene influence its expression. MIRA quantifies the regulatory influence of local chromatin state to distinguish genes primarily regulated by local chromatin remodeling (LITE genes) versus those more heavily influenced by non-local signals (NITE genes) reflected in the genome-wide accessibility topics with minimal impact on local chromatin landscape. MIRA furthermore predicts key regulators at each locus by examining transcription factor motif or occupancy (from ChIP-seq) enrichment within elements predicted to highly influence transcription at that locus. c, Benchmarking results comparing MIRA joint cell state trajectory inference to standard methodology of Seurat principal component analysis (PCA)+Slingshot on expression data only, Seurat latent semantic indexing (LSI)+Slingshot on accessibility data only, or joint model combining Seurat PCA on expression data and LSI on accessibility data followed by Slingshot. Overall score is the geometric mean of edge accuracy, branch F1 score, and pseudotime correlation metrics. Performance was tested on four different ground truth scaffolds, which are computationally synthesized by mixing reads from distinct populations of single cells. Scaffold difficulty increases from left to right, where more difficult scaffolds contain cell states where mixture components are more similar (increased entropy), making them more difficult to distinguish. Line plots indicate performance in each of the four scaffold difficulties with trials (5 replicates each) for three different mean read depths (lower read depth further increases the difficulty of solving the topology). scRNA-seq mean read depth n=4000; scATAC-seq mean read depth n=14000. d, Example UMAPs for the least difficult scaffold. Black edges show cell state parsing. Cells colored by ground truth branch assignment.
Fig. 2 |
Fig. 2 |. MIRA topic modeling determined regulatory factors driving key fate decisions in hair follicle differentiation.
a, MIRA’s joint topic representation constructed a UMAP (right) whose structure mimicked the true spatial layout (left) of the progenitor matrix cells and descendant medulla, cortex, and IRS lineages in the hair follicle. Colors indicate cell types defined by fine Leiden clustering followed by agglomeration of clusters based on known marker gene expression. b, (top) Diffusion pseudotime through joint KNN graph representing differentiation progress. Terminal cells were identified using stationary states from a forward Markov chain model of differentiation. (middle) Each cell’s probability of reaching each terminal state. (bottom) Parsed bifurcating tree structure of cell state probabilities visualized as stream graph. Each point is an individual cell arranged as a swarm plot (arranged such that points do not overlap, resulting in larger spread where there are more points). Cells are colored by clusters in 2a, indicating that bifurcation points closely correspond to changes in cell identity as separately defined by markers for each cell type. c, Stream graph of window-averaged cell-topic compositions as cells progress through differentiation starting from matrix cell state (see Extended Data Fig. 6a for stream graph including outer root sheath (ORS); topics that comprise ≥3% of the total at any point are shown). Representative genes activated in expression topics and motifs enriched in accessibility topics are depicted in boxes corresponding with the color of the source topic. Accessibility topic a4 described a transitory accessibility state at the branch point between the medulla and cortex lineages without a corresponding expression topic, suggesting global chromatin remodeling in progenitor matrix cells preceded transcriptional alterations specifying each downstream lineage. d, (left) Gene set enrichment for progenitor matrix cell expression topic e2. (right) Expression topic e2 activation or Eda expression on UMAP of joint topic representation. e, Comparison of motif enrichment in top peaks of medulla versus cortex accessibility topics (a5 and a6, respectively).
Fig. 3 |
Fig. 3 |. MIRA RP modeling identified genes for which changes in expression were insufficiently explained by local chromatin accessibility.
a, LITE gene Braf or b, NITE gene Krt23 expression or local-only RP model predictions (LITE model) on joint representation UMAP. c, LITE gene Braf or d, NITE gene Krt23 locus’s chromatin accessibility fragments across pseudotime (moving downwards) in trajectories from ORS to matrix to cortex (top) or medulla (bottom). Colored bars on the right indicate the identity of cells (colored by clusters in 2a) within each bin reflected by each row of accessibility fragments. Line plots across pseudotime depict the indicated gene’s observed expression (red) and LITE model prediction of expression (black), which is informed by the local accessibility reflected in the fragment plot. While the observed expression and LITE model prediction align for LITE gene Braf, they diverge for NITE gene Krt23. e, Joint representation UMAP colored by (left) Krt23 NITE model prediction or (right) medulla accessibility topic a5 capturing a genome-wide chromatin state. NITE model predictions were more closely aligned with Krt23 expression shown in 3b. f, Proposed mechanism of LITE versus NITE regulation. In LITE regulation, expression is tightly regulated by chromatin remodeling. In NITE regulation, binding of an additional factor is required to enact transcription. g, LITE gene Braf or h, NITE gene Krt23 LITE versus NITE model predictions (cells colored by gene expression) and “chromatin differential” (relative prediction of LITE versus NITE models). In chromatin differential plots, red indicates LITE model overestimates expression while blue indicates LITE model under-estimates expression relative to NITE model.
Fig. 4 |
Fig. 4 |. Gene-level and cell-level analysis of NITE gene regulation in the hair follicle elucidated regulatory mechanisms of fate commitment.
a, NITE regulation score of each cell. b, Stream graph contrasting expression versus LITE model prediction (which represents local accessibility) of NITE gene Rnaset2b. When the lines diverge, this indicates that observed expression or local accessibility is changing in a way that is not coordinated with the other, drawing attention to genes whose expression is regulated by mechanisms not solely determined by local chromatin accessibility. c, (left) Regulatory classifications of medulla or cortex terminally expressed genes based on expression and local chromatin accessibility at the branch point between medulla and cortex lineages. Classifications colored green or orange by whether the genes were significantly upregulated in the medulla or cortex cells, respectively. The High Expression-High Accessibility group is composed of medulla- or cortex-specific genes that are already highly expressed and accessible at the branch. The Low Expression-High Accessibility group, referred to as “branch-primed genes”, are medulla- or cortex-specific genes that are more accessible at the branch than would be expected based on their expression at the branch. They subsequently increase in expression levels after the branch in one of the two lineages. The Low Expression-Low Accessibility group, referred to as “terminal genes”, are medulla- or cortex-specific genes that are not yet expressed nor accessible at the branch. Only after the cells have committed to one of the two fates do these genes become expressed and accessible in that lineage. (right) Example of each classification. d, Interaction between gene-level regulation and cell-level topics. (top) Expression of branch-primed cortex genes increased after branch, correlating with expression topic e6. (bottom) LITE model prediction (local chromatin accessibility) of branch-primed genes increased before cortex commitment, correlating with accessibility topic a4. e, Driver transcription factor analysis of branch-primed medulla versus cortex genes. f, Model for regulation of fate commitment in hair follicle depending on activation of distinct signaling pathways. Accessibility topic a4 opens chromatin around branch-primed genes at branch point between lineages. Depending on signal, branch-primed lineage-specific genes are expressed, enforcing lineage commitment.
Fig. 5 |
Fig. 5 |. MIRA joint representation reconstructed complex multi-axis differentiation in the IFE.
a, Anatomical model of mouse keratinocyte differentiation along epidermal and follicular axes. b, UMAP calculated from MIRA joint expression and accessibility topic representation. Dotted lines show constructed cell state structure resulting from two axes of differentiation. c, UMAP calculated from MIRA expression topics alone. d, UMAP calculated from MIRA accessibility topics alone. e, Activation of intermediate granular expression topic e8 on joint representation UMAP. f, Gene Ontology (GO) enrichment of top genes from intermediate granular expression topic e8. g, Two separate terminal states were identified from the Markov chain model of differentiation starting from basal cells labeled “Start state”. h, Stream graph of accessibility topic compositions of basal-spinous-granular (top) and intermediate basal-spinous-granular (bottom) lineages. Top enriched factors shown in boxes with color indicating source topics. i, NITE regulation score of each cell in the IFE.
Fig. 6 |
Fig. 6 |. MIRA elucidated regulatory factors driving fate decisions in key developmental trajectories in the developing brain.
a, Expression of marker genes for progenitor Pax6+ cells and terminal states of astrocytes, excitatory neurons, or inhibitory neurons. b, MIRA joint representation UMAP colored by inferred cell states. Mixed progenitor cells include both excitatory and inhibitory progenitors, which are transcriptionally similar. (See Supplementary Fig. 2). c, Stream graphs of expression and accessibility topic activation across cell state trajectory. Pathways activated in expression topics and motifs enriched in accessibility topics are indicated by topic color. d, Motif score of Rbpj and Neurog2 on joint representation UMAP. e, Motif score of Rbpj and Neurog2 in the indicated cell states (*p<0.05, two-sided Wilcoxon rank-sum compared to progenitors (including mixed progenitors), Benjamini-Hochberg-corrected; Rbpj: astrocyte vs. progenitors p=3e-26, excitatory vs. progenitors p=3e-97; Neurog2: astrocyte vs. progenitors p=3e-39, excitatory vs. progenitors p=5e-98; all adjusted p-values~0). f, Activation level of Ascl1 versus Neurod1 motif scores in each single cell along cell state trajectory. g, GO terms enriched in top 500 genes with NITE regulation where local chromatin accessibility state is insufficient to predict expression. h, Correlation of LITE versus NITE model predictions of expression of example genes with LITE versus NITE regulation.

References

    1. Chen S, Lake BB & Zhang K High-throughput sequencing of the transcriptome and chromatin accessibility in the same cell. Nat. Biotechnol 37, 1452–1457 (2019). - PMC - PubMed
    1. Cao J et al. Joint profiling of chromatin accessibility and gene expression in thousands of single cells. Science 361, 1380–1385 (2018). - PMC - PubMed
    1. Ma S et al. Chromatin Potential Identified by Shared Single-Cell Profiling of RNA and Chromatin. Cell 183, 1103–1116.e20 (2020). - PMC - PubMed
    1. Zhu C et al. An ultra high-throughput method for single-cell joint analysis of open chromatin and transcriptome. Nat. Struct. Mol. Biol 26, 1063–1070 (2019). - PMC - PubMed
    1. Duren Z, Chen X, Xin J, Wang Y & Wong WH Time course regulatory analysis based on paired expression and chromatin accessibility data. Genome Res. 30, 622–634 (2020). - PMC - PubMed

Methods References

    1. Blei DM., Ng AY. & Edu JB. Latent Dirichlet Allocation Michael I. Jordan. Journal of Machine Learning Research 3, 993–1022 (2003).
    1. Kingma DP & Welling M Auto-Encoding Variational Bayes. arXiv:1312.6114 (2013).
    1. Lopez R, Regier J, Cole MB, Jordan MI & Yosef N Deep generative modeling for single-cell transcriptomics. Nature Methods 2018 15:12 15, 1053–1058 (2018). - PMC - PubMed
    1. Choi K, Chen Y, Skelly DA & Churchill GA Bayesian model selection reveals biological origins of zero inflation in single-cell transcriptomics. Genome Biology 21, 1–16 (2020). - PMC - PubMed
    1. Chen EY et al. Enrichr: Interactive and collaborative HTML5 gene list enrichment analysis tool. BMC Bioinformatics 14, 1–14 (2013). - PMC - PubMed

Publication types

MeSH terms