. 2022 Sep;41(40):4560-4572.
doi: 10.1038/s41388-022-02450-3. Epub 2022 Sep 6.

Targeting the MYC interaction network in B-cell lymphoma via histone deacetylase 6 inhibition

Affiliations

Targeting the MYC interaction network in B-cell lymphoma via histone deacetylase 6 inhibition

René Winkler et al. Oncogene. 2022 Sep.

Abstract

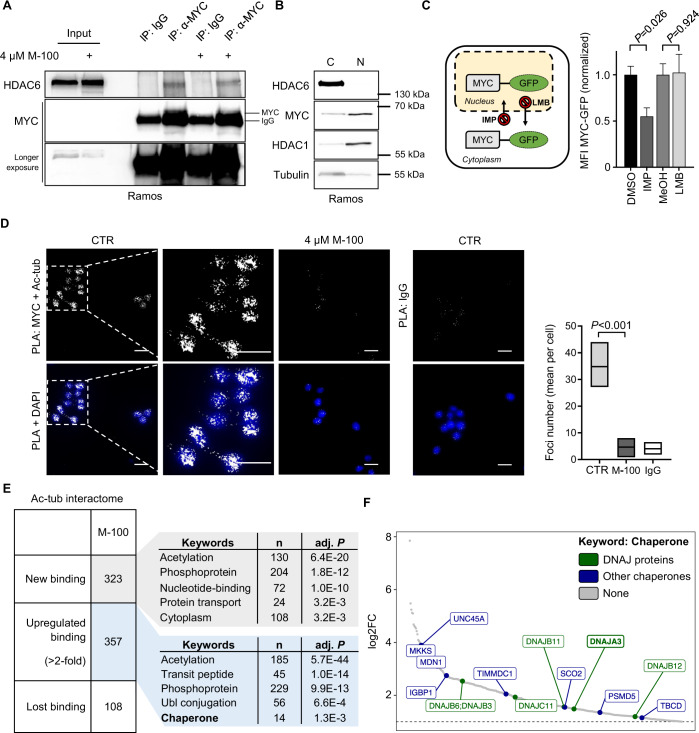
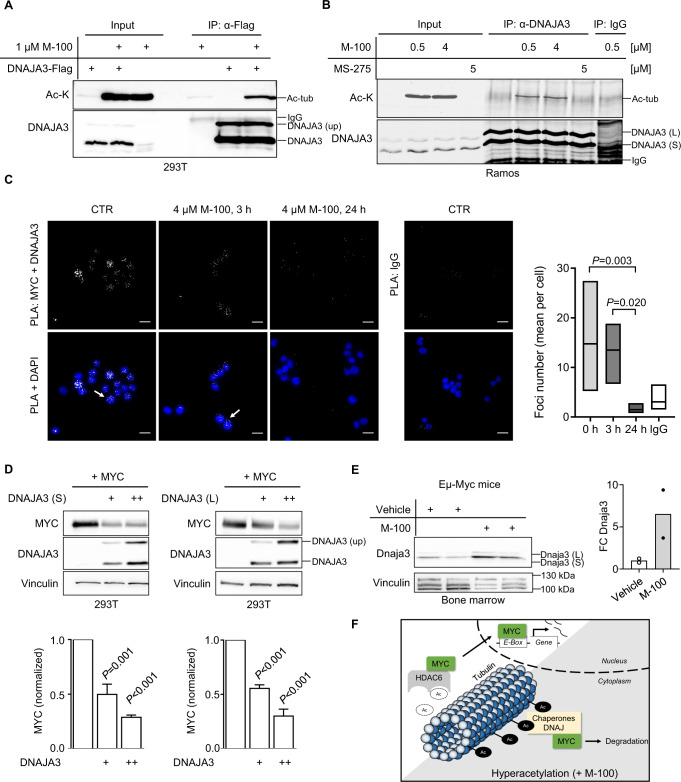
Overexpression of MYC is a genuine cancer driver in lymphomas and related to poor prognosis. However, therapeutic targeting of the transcription factor MYC remains challenging. Here, we show that inhibition of the histone deacetylase 6 (HDAC6) using the HDAC6 inhibitor Marbostat-100 (M-100) reduces oncogenic MYC levels and prevents lymphomagenesis in a mouse model of MYC-induced aggressive B-cell lymphoma. M-100 specifically alters protein-protein interactions by switching the acetylation state of HDAC6 substrates, such as tubulin. Tubulin facilitates nuclear import of MYC, and MYC-dependent B-cell lymphoma cells rely on continuous import of MYC due to its high turn-over. Acetylation of tubulin impairs this mechanism and enables proteasomal degradation of MYC. M-100 targets almost exclusively B-cell lymphoma cells with high levels of MYC whereas non-tumor cells are not affected. M-100 induces massive apoptosis in human and murine MYC-overexpressing B-cell lymphoma cells. We identified the heat-shock protein DNAJA3 as an interactor of tubulin in an acetylation-dependent manner and overexpression of DNAJA3 resulted in a pronounced degradation of MYC. We propose a mechanism by which DNAJA3 associates with hyperacetylated tubulin in the cytoplasm to control MYC turnover. Taken together, our data demonstrate a beneficial role of HDAC6 inhibition in MYC-dependent B-cell lymphoma.


Conflict of interest statement

The authors declare no competing interests.

Figures

Fig. 1
Fig. 1. Continuous HDAC6 inhibition increases survival of lymphoma-prone MYC-overexpressing mice.
A Western Blot analysis of Eµ-Myc lymphoma cells isolated from malignant lymph nodes and treated ex vivo with increasing concentrations of M-100 for 24 h. Levels of Myc were quantified to untreated conditions. Actin was used as a loading control. Cl. - cleaved. B Western Blot analysis of splenocytes from wild-type mice treated once via i.p. injection with 30 mg/kg M-100 or vehicle for the indicated time. Each lane represents one individual mouse. Vinculin was used as a loading control. Ac-tub - acetylated tubulin. C Survival curves of Eµ-Myc mice treated every 72 h with 30 mg/kg M-100 (n = 17) or vehicle (n = 15). Treatment (Tx) started at age 70 d for six weeks. Mice were monitored for additional six weeks for signs of lymphoma development. Median survival vehicle cohort: 136 d, M-100 cohort: not possible to calculate, untreated Eµ-Myc mice: 140 d. Log-Rank-test. D Lymphoma phenotypes of diseased Eµ-Myc mice measured by flow cytometry. E Spleen weights of all mice from the different cohorts. Spleen weights from wild-type mice serve as control. Wilcoxon rank-sum test. F Flow cytometry analysis of splenic immune cell populations of survivors. Unpaired Student’s t-test, two-tailed. G Survival curves of Eµ-Myc mice suffering from lymphoma treated with M-100 (median 16 d) or left untreated (median 6 d). Mice received M-100 (30 mg/kg) every 72 h starting when palpable lymph node swelling was present. Treatment continued until endpoint criteria were reached. Log-Rank-test. Data in A are representative of n = 3 independent experiments. E, F Each dot represents one mouse. Bars depict mean.
Fig. 2
Fig. 2. M-100 specifically induces apoptosis in murine lymphoma B-cells but not activated wild-type B-cells.
A Apoptosis detection using Annexin V and PI staining. Eµ-Myc lymphoma and activated (10 µg LPS/ml) wild-type mouse B-cells were compared. B Representative cell cycle analysis of Eµ-Myc lymphoma and activated B-cells treated for 72 h. C Cell cycle analysis from B was quantified. Two-Way ANOVA (Sidak’s posthoc). D Gene expression changes of Eµ-Myc lymphoma or activated wild-type (WT) B-cells cells treated for 24 h with 4 µM M-100 using quantitative real-time PCR analysis. One-Way ANOVA (Tukey’s posthoc). E Western Blot analysis of activated wild-type B-cells or Eµ-Myc lymphoma cells treated with M-100 for 24 h. Gapdh and actin were used as loading controls. Ac-tub - acetylated tubulin. F Apoptosis was analyzed in activated wild-type B-cells treated with 4 µM M-100, 0.5 µM BCL-2 inhibitor (BCL-2i) Venetoclax or both for 24 h. One-Way ANOVA (Tukey’s posthoc). G CH12F3 cells were analyzed regarding viability (Annexin V/PI staining) and cell cycle after treatment with 2 µM M-100 for 48 h. Activation was performed using 1 µg/ml CD40L, 5 ng/ml IL-4, and 1 ng/ml TGF-β and added 2 h after M-100 treatment. CH12F3 cells harbor no MYC translocation. Two-Way ANOVA (Sidak’s posthoc). Data in AG are representative of at least n = 3 independent experiments. Data represent mean + SEM, if applicable. *P < 0.05, ***P < 0.001, ns - not significant.
Fig. 3
Fig. 3. Different human B-cell lymphoma cell lines respond to HDAC6 inhibition by initiating apoptosis and cell cycle arrest.
A Cell viability of human B-cell lymphoma cells after treatment with increasing concentrations of M-100 for 48 h using MTT assay. Non-linear regression (inhibitor vs. normalized response) was inserted. B Amount of Annexin V+ cells after treatment with 4 µM M-100 for 48 h. Unpaired Welch’s t-test, two-tailed. C Cell cycle analysis of cells treated with 4 µM M-100 for 48 h. Two-Way ANOVA (Sidak’s posthoc). D Different concentrations of M-100 were tested for inducing ac-H3 signals by Western blot. Vinculin was used as a loading control. E Ramos HDAC6 (HD6) knock-out (KO) cells were generated and compared to HDAC6 wild-type (WT) cells. Western Blot analysis shows absence of HDAC6. Actin serves as a loading control. F Proliferation was measured of Ramos HDAC6 WT and HDAC6 KO cells by cell counting, and normalized to WT cells at t = 72 h. Two-Way ANOVA (Sidak’s posthoc). G Dose-response curves were determined for Ramos HDAC6 WT and KO cells treated for 48 h with increasing concentrations of M-100 or ACY-1215 by MTT assay. Non-linear regression (inhibitor vs. normalized response) was inserted. Data in AG are representative of at least n = 3 independent experiments. Data represent mean + SEM, if applicable. *P < 0.05, **P < 0.01, ***P < 0.001, ns not significant.
Fig. 4
Fig. 4. HDAC6 inhibition results in rapid MYC degradation.
A Western Blot analysis of Ramos cells treated for the indicated time with different concentrations of M-100. Levels of MYC were quantified to untreated conditions. Tubulin was used as a loading control. Cl. - cleaved. B Western Blot analysis of Ramos cells treated with 10 µM MG132 to block proteasomal degradation and/or 4 µM M-100 for the indicated time. Levels of MYC were quantified to untreated conditions. GAPDH was used as a loading control. C Ubiquitination of proteins was analyzed in Ramos cells treated for 3 h with 10 µM MG132, 4 µM M-100 or left untreated by Western blot. 50 µg protein was loaded for input. Endogenous MYC was immunoprecipitated from these cell lysates. Unspecific IgG was used for control IPs. Ub - Ubiquitin. D Western Blot analysis of B-cell lymphoma cell lines treated for 6 h and 24 h with 4 µM M-100. Vinculin was used as a loading control. Ac-tub - acetylated tubulin. Data in AD are representative of n = 3 independent experiments.
Fig. 5
Fig. 5. Cytoplasmic MYC degradation is associated with changes in the interactome of hyperacetylated tubulin.
A Interaction of MYC and HDAC6 detected by IP. Ramos cells were treated for 24 h with 4 µM M-100 or left untreated. IPs with unspecific IgG were used as control. B Cytoplasmic and nuclear fractions were prepared from Ramos cells. HDAC1 was used as a nuclear marker and tubulin as a cytoplasmic marker. C NIH-3T3 cells overexpressing MYC-GFP were challenged for 1 h with inhibitors of nuclear import (Importazole, IMP; 40 µM), nuclear export (Leptomycin B, LMB; 20 ng/ml), or solvent. Next, cells were treated for 90 min with CHX (50 µg/ml) before flow cytometry. Living cells were gated using FSC/SSC and normalized median fluorescence intensity (MFI) of MYC-GFP was calculated. Data represent mean + SEM. Unpaired Student’s t-test, two-tailed. D PLA was performed to detect endogenous co-localization of MYC and acetylated tubulin (ac-tub) in Ramos cells. Cells were treated with 4 µM M-100 for 24 h. Staining with unspecific IgG was used as a control. DAPI was used to stain nuclei. Scale bars indicate 20 µm, magnification 60x. PLA foci were counted and compared. Boxplots depict medium and min to max. One-Way ANOVA (Tukey’s posthoc). E Global interactome analysis was carried out of immunoprecipitated ac-tub via mass spectrometry. MV4-11 cells were treated for 24 h with 0.5 µM M-100. Shown are counts of proteins with new or increased (>2-fold) binding to ac-tub, or loss of binding after treatment compared to control and IgG binding. Uniprot (UP) keyword annotation was performed with DAVID using all proteins that bound to ac-tub after M-100 treatment. Adjusted (adj.) P-values are given. Ubl - Ubiquitin-like. F All proteins belonging to the keyword “chaperone” are depicted with their corresponding log2 fold change (FC). DNAJ proteins are marked in green. Data in A and C are representative of n = 3 independent experiments. Data in B and D are representative of n = 2 independent experiments.
Fig. 6
Fig. 6. The heat-shock protein DNAJA3 is recruited to hyperacetylated tubulin and induces MYC degradation.
A Interaction of acetylated tubulin (ac-tub) and DNAJA3. 293T cells were transfected with plasmids encoding DNAJA3-Flag and treated with 1 µM M-100 for 24 h. Cells were lysed in stringent lysis buffer containing M-100. Lysates were used for IP with α-Flag antibodies to precipitate DNAJA3-Flag. Overexpression of DNAJA3 generates unprocessed (up) precursor proteins. B Endogenous interaction of acetylated tubulin and DNAJA3 in Ramos cells. Cells were treated for 24 h with either 0.5 µM, 4 µM M-100, 5 µM MS-275, or left untreated. Lysates were used for IP with α-DNAJA3 antibodies and tested for interaction with ac-tub. IPs with unspecific IgG were used as control. C PLA was performed to detect endogenous co-localization of MYC and DNAJA3 in Ramos cells. Cells were treated with 4 µM M-100 for the indicated time points. Staining with unspecific IgG was used as a control. DAPI was used to stain nuclei. Scale bars indicate 20 µm, magnification 60x. PLA foci were counted and compared. Boxplots depict medium and min to max. One-Way ANOVA (Tukey’s posthoc). D Western Blot analysis of 293T cells overexpressing MYC and increasing amounts of small (S) or large (L) isoforms of DNAJA3. Vinculin was used as a loading control. Quantification of MYC was performed based on Vinculin. One-Way ANOVA (Dunnett’s posthoc). E Western Blot analysis of bone marrow lysates from Eµ-Myc mice after one i.p. injection with M-100 (30 mg/kg) or vehicle. Small and large isoforms of Dnaja3 can be noticed. Vinculin was used as a loading control. Each lane represents one individual mouse. Quantification of Dnaja3 protein levels is shown based on Vinculin. FC - fold change. F Scheme summarizing our findings. Hyperacetylation of tubulin by HDAC6 inhibition results in the recruitment of chaperone complexes including the HSP DNAJA3. High levels of DNAJA3 induce degradation of MYC preventing cancer-specific gene regulation. Data in A, B, and D are representative of n = 3 independent experiments, data in C are representative of n = 2 independent experiments. Data represent mean + SEM, if applicable.

References

    1. Basso K, Dalla-Favera R. Germinal centres and B cell lymphomagenesis. Nat Rev Immunol. 2015;15:172–84. doi: 10.1038/nri3814. - DOI - PubMed
    1. Swerdlow SH, Campo E, Pileri SA, Lee Harris N, Stein H, Siebert R, et al. The 2016 revision of the World Health Organization classification of lymphoid neoplasms. Blood. 2016;127:2375–90. doi: 10.1182/blood-2016-01-643569. - DOI - PMC - PubMed
    1. Gupta M, Maurer MJ, Wellik LE, Law ME, Han JJ, Ozsan N, et al. Expression of Myc, but not pSTAT3, is an adverse prognostic factor for diffuse large B-cell lymphoma treated with epratuzumab/R-CHOP. Blood. 2012;120:4400–6. doi: 10.1182/blood-2012-05-428466. - DOI - PMC - PubMed
    1. Aukema SM, Kreuz M, Kohler CW, Rosolowski M, Hasenclever D, Hummel M, et al. Biological characterization of adult MYC-translocation-positive mature B-cell lymphomas other than molecular Burkitt lymphoma. Haematologica. 2014;99:726–35. doi: 10.3324/haematol.2013.091827. - DOI - PMC - PubMed
    1. Lorenzin F, Benary U, Baluapuri A, Walz S, Jung LA, von Eyss B, et al. Different promoter affinities account for specificity in MYC-dependent gene regulation. Elife. 2016;5:1–35. doi: 10.7554/eLife.15161. - DOI - PMC - PubMed

Publication types