

Genetic Ancestry Inference for Pharmacogenomics
- PMID: 36068478
- PMCID: PMC9486757
- DOI: 10.1007/978-1-0716-2573-6_21
Genetic Ancestry Inference for Pharmacogenomics
Erratum in
-
Correction to: Genetic Ancestry Inference for Pharmacogenomics.Methods Mol Biol. 2022;2547:C1. doi: 10.1007/978-1-0716-2573-6_22. Methods Mol Biol. 2022. PMID: 37794232 No abstract available.
Abstract
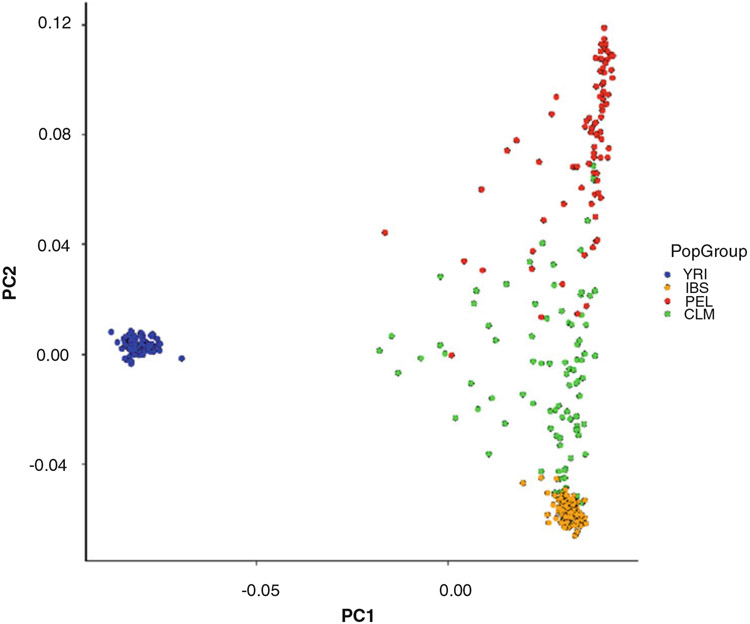
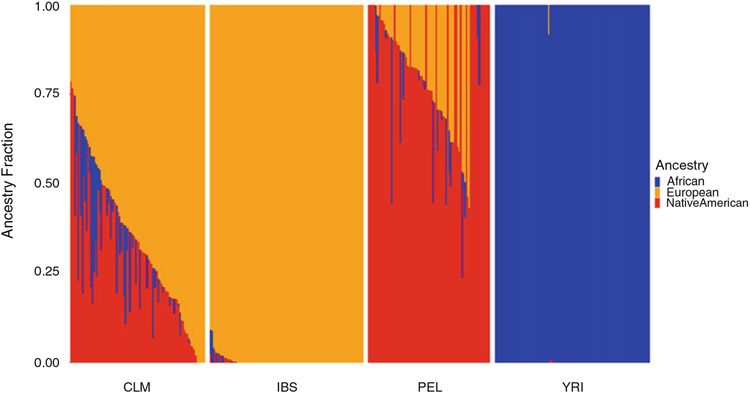
Genetic ancestry inference can be used to stratify patient cohorts and to model pharmacogenomic variation within and between populations. We provide a detailed guide to genetic ancestry inference using genome-wide genetic variant datasets, with an emphasis on two widely used techniques: principal components analysis (PCA) and ADMIXTURE analysis. PCA can be used for patient stratification and categorical ancestry inference, whereas ADMIXTURE is used to characterize genetic ancestry as a continuous variable. Visualization methods are critical for the interpretation of genetic ancestry inference methods, and we provide instructions for how the results of PCA and ADMIXTURE can be effectively visualized.
Keywords: Admixture; Genetic ancestry inference; Genetic variants; Health disparities; Pharmacogenomics; Population-specific drug efficacy.
© 2022. The Author(s), under exclusive license to Springer Science+Business Media, LLC, part of Springer Nature.
Figures
References
-
- Bachtiar M, Lee CG (2013) Genetics of population differences in drug response. Curr Genet MedRep 1:162–170
-
- Bjornsson TD, Wagner JA, Donahue SR et al. (2003) A review and assessment of potential sources of ethnic differences in drug responsiveness. J Clin Pharmacol 43:943–967 - PubMed
-
- Chen ML (2006) Ethnic or racial differences revisited: impact of dosage regimen and dosage form on pharmacokinetics and pharmacodynamics. Clin Pharmacokinet 45:957–964 - PubMed
Publication types
MeSH terms
Grants and funding
LinkOut - more resources
Full Text Sources
