. 2023 Aug;10(4):2039-2053.
doi: 10.1007/s40615-022-01384-6. Epub 2022 Sep 6.

The Opioid Epidemic: a Crisis Disproportionately Impacting Black Americans and Urban Communities

Affiliations

The Opioid Epidemic: a Crisis Disproportionately Impacting Black Americans and Urban Communities

Marjorie C Gondré-Lewis et al. J Racial Ethn Health Disparities. 2023 Aug.

Abstract

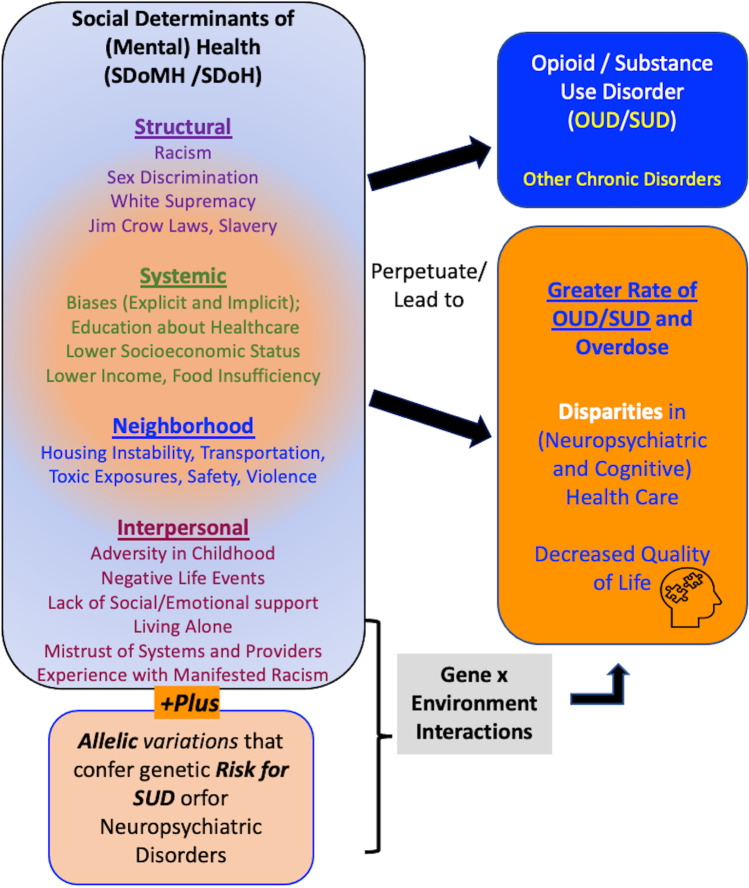
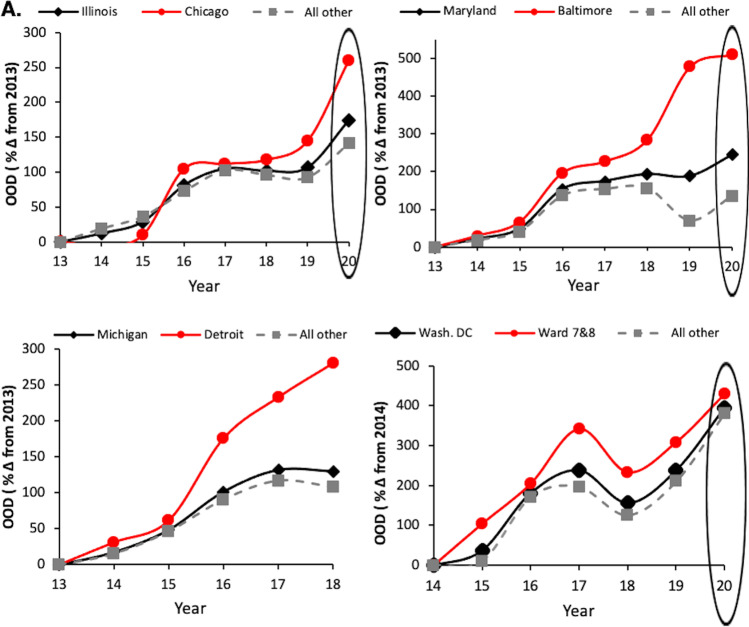
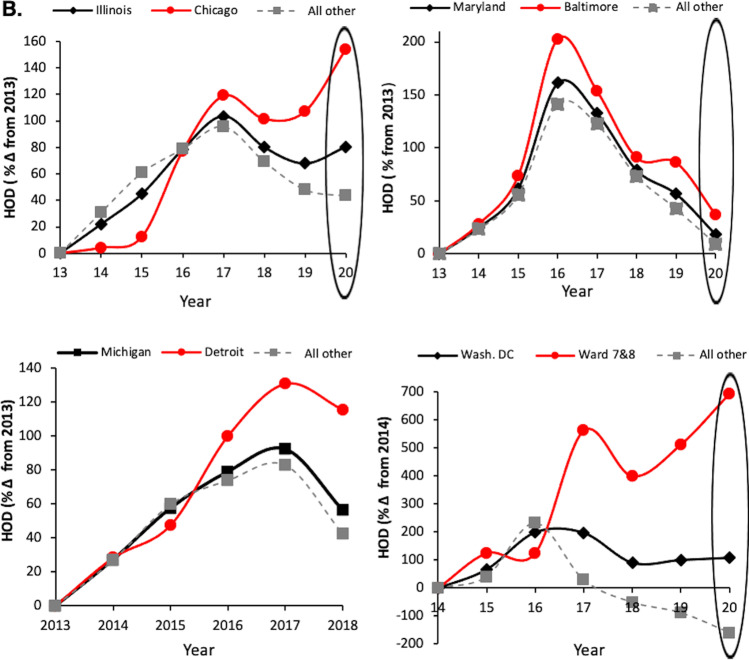
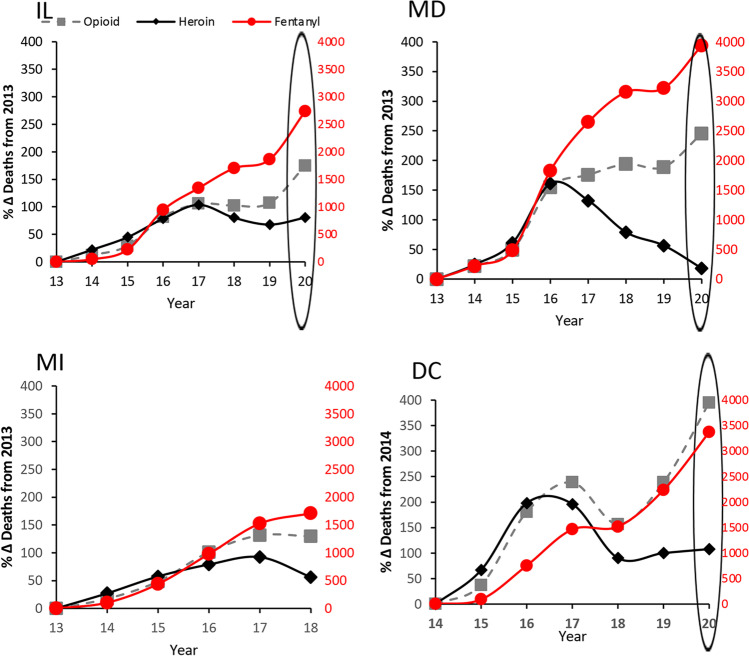
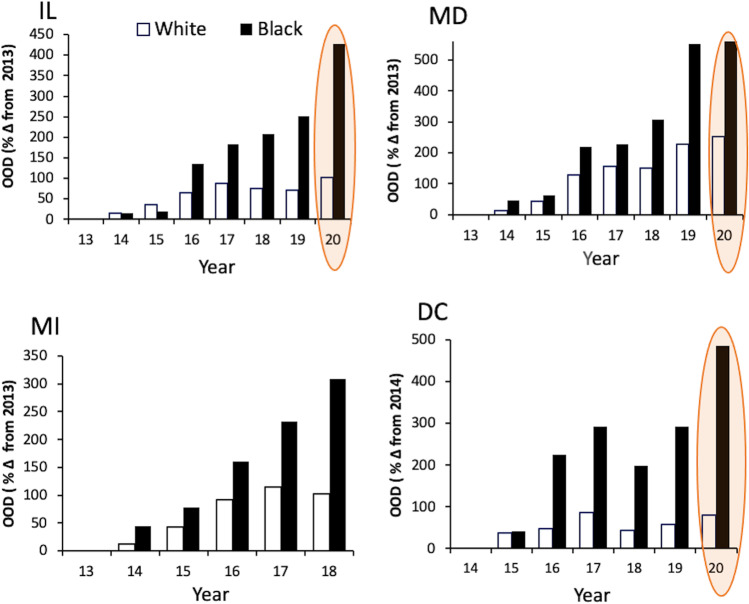
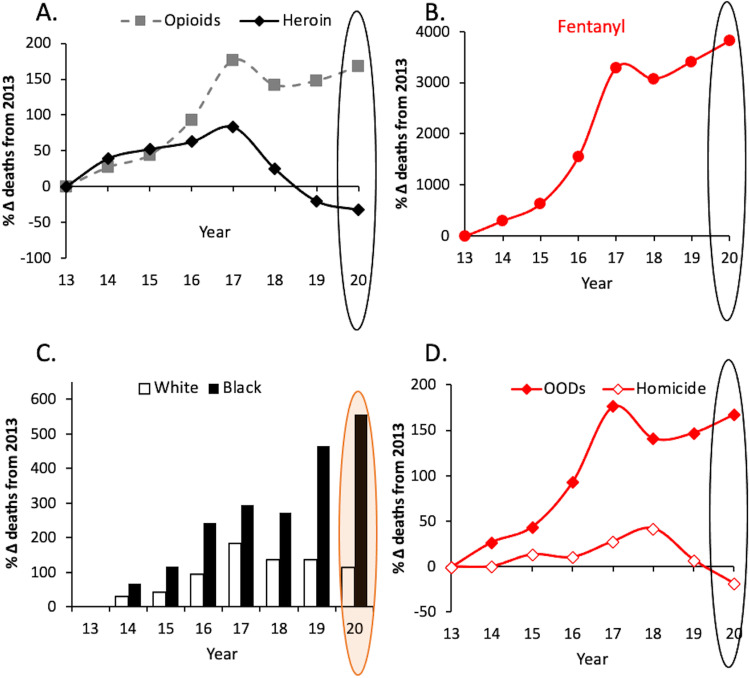
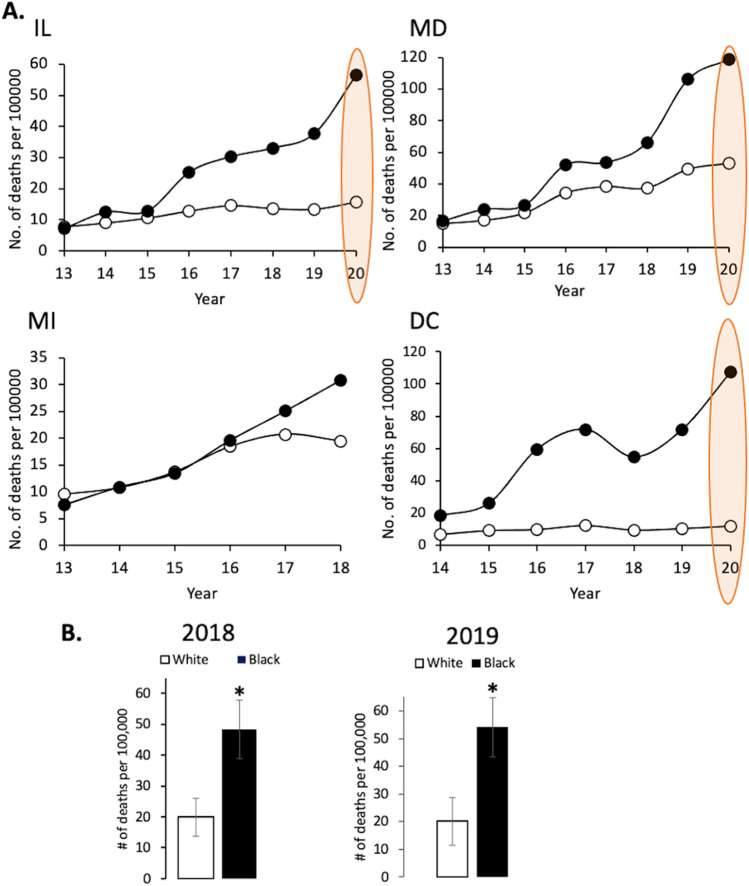
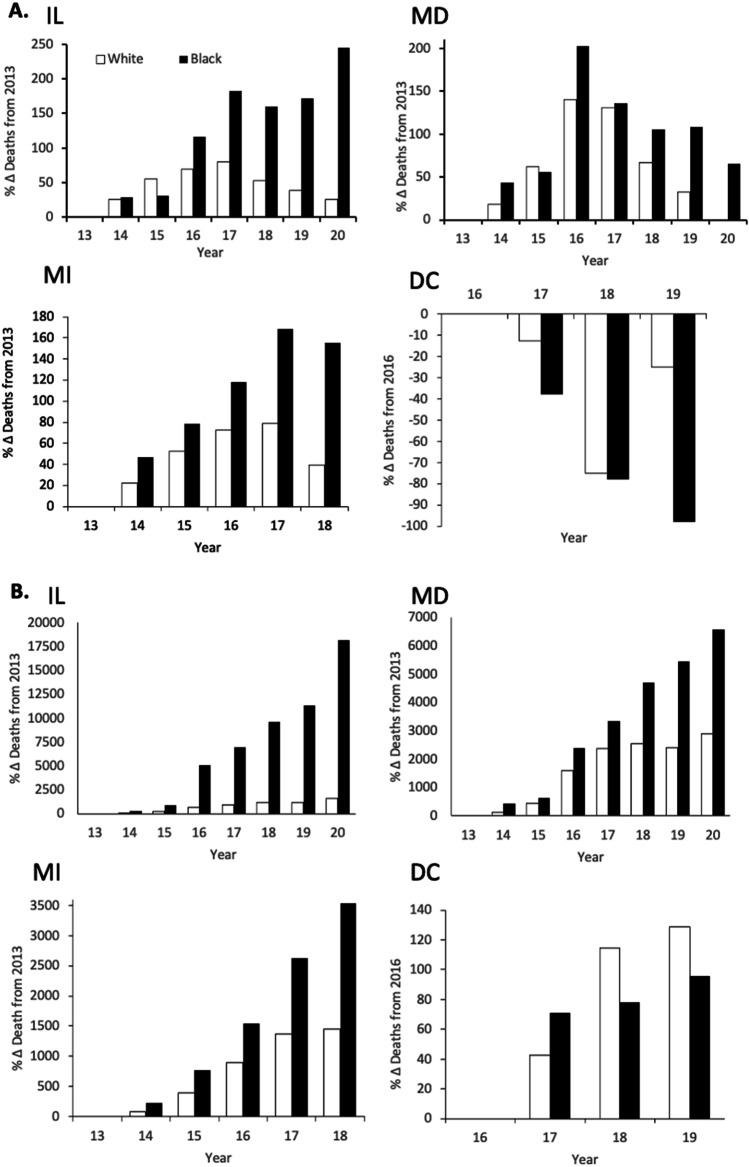
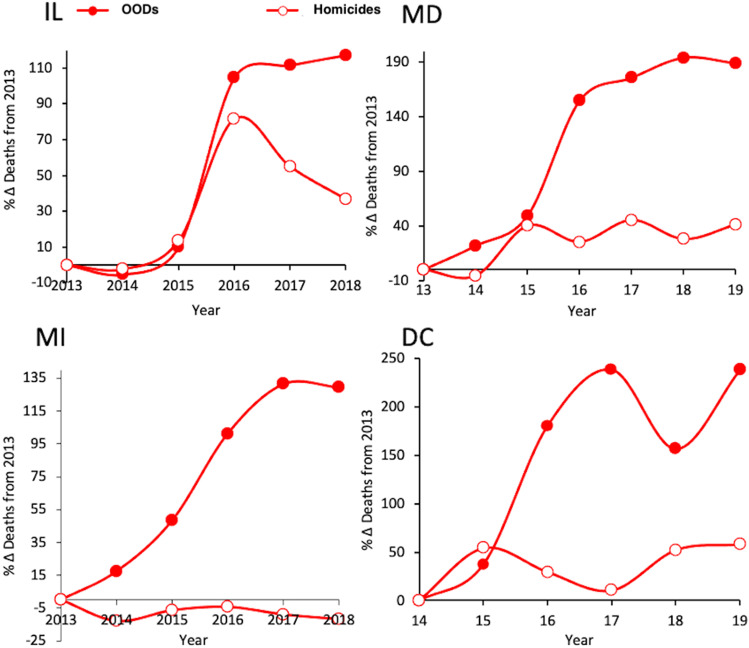
The heroin epidemic has existed for decades, but a sharp rise in opioid overdose deaths (OODs) jolted the nation in the mid-twenty-teens and continues as a major health crisis to this day. Although the new wave of OODs was initially approached as a rural problem impacting a White/Caucasian demographic, surveillance records suggest severe impacts on African Americans and urban-dwelling individuals, which have been largely underreported. The focus of this report is on specific trends in OOD rates in Black and White residents in states with a significant Black urban population and declared as hotspots for OOD: (Maryland (MD), Illinois (IL), Michigan (MI), and Pennsylvania (PA)), and Washington District of Columbia (DC). We compare OODs by type of opioid, across ethnicities, across city/rural demographics, and to homicide rates using 2013-2020 data acquired from official Chief Medical Examiners' or Departments of Health (DOH) reports. With 2013 or 2014 as baseline, the OOD rate in major cities (Baltimore, Chicago, Detroit, Philadelphia) were elevated two-fold over all other regions of their respective state. In DC, Wards 7 and 8 OODs were consistently greater than other jurisdictions, until 2020 when the rate of change of OODs increased for the entire city. Ethnicity-wise, Black OOD rates exceeded White rates by four- to six-fold, with fentanyl and heroin having a disproportionate impact on Black opioid deaths. This disparity was aggravated by its intersection with the COVID-19 pandemic in 2020. African Americans and America's urban dwellers are vulnerable populations in need of social and political resources to address the ongoing opioid epidemic in under-resourced communities.

Keywords: African American; Black; Caucasian; European American; Fentanyl; Health disparity; Heroin; Homicides; Opiates; Opioid; Opioid overdose; Social Determinants of Health; Social Determinants of Mental Health.


Conflict of interest statement

The authors declare no competing interests.

Figures

Fig. 1
Fig. 1
Factors contributing to disparities in neuropsychiatric and cognitive health care. Social determinants of mental health (SDoMH) are derived from structural and systemic biases, local disparities in neighborhood environment and public resources, and interpersonal experiences of abuse, violence and racism. These SDoMH combine with existing chronic disorders including SUD and genetic risk to create an amplified gene × environment interaction to lead to or perpetuate 1) a greater rate of SUD and overdose, 2) disparities in neuropsychiatric and cognitive health care, 3) and a resultant decreased quality of life
Fig. 2
Fig. 2
Opioid overdose deaths (all opioids) and heroin overdose deaths in Illinois, Maryland, Michigan and Washington DC—Comparison of Urban Capitals and Rural. A All deaths due to any opioids were analyzed for Chicago, Illinois, and non-Chicago regions (top left); Baltimore, Maryland, and non-Baltimore city regions of MD (top right); Detroit, Michigan, and non-Detroit regions of MI (bottom left); Wards 7 and 8, all of Washington DC, and non-Wards 7 and 8 parts of DC (bottom right). Note that Ward 5 is also considered a hotspot for OODs but not calculated with wards 7 and 8, thus may reduce the extent of disparities for Washington DC’s Black neighborhoods. B Deaths where heroin was implicated (heroin overdose deaths (HOD). Red circles (cities or Wards 7 and 8); black diamonds (overall state or Washington DC data); gray squares (overall state—city = ‘all other’ regions of that state). Data expressed as percent change over 2013, or 2014 for DC. The large oval highlights data influenced by the COVID-19 pandemic in 2020
Fig. 2
Fig. 2
Opioid overdose deaths (all opioids) and heroin overdose deaths in Illinois, Maryland, Michigan and Washington DC—Comparison of Urban Capitals and Rural. A All deaths due to any opioids were analyzed for Chicago, Illinois, and non-Chicago regions (top left); Baltimore, Maryland, and non-Baltimore city regions of MD (top right); Detroit, Michigan, and non-Detroit regions of MI (bottom left); Wards 7 and 8, all of Washington DC, and non-Wards 7 and 8 parts of DC (bottom right). Note that Ward 5 is also considered a hotspot for OODs but not calculated with wards 7 and 8, thus may reduce the extent of disparities for Washington DC’s Black neighborhoods. B Deaths where heroin was implicated (heroin overdose deaths (HOD). Red circles (cities or Wards 7 and 8); black diamonds (overall state or Washington DC data); gray squares (overall state—city = ‘all other’ regions of that state). Data expressed as percent change over 2013, or 2014 for DC. The large oval highlights data influenced by the COVID-19 pandemic in 2020
Fig. 3
Fig. 3
Rate of fentanyl overdose deaths compared to heroin and overall opioid deaths. Red circles (fentanyl); black diamonds (heroin); gray squares (overall OODs). Dual y-axis (right, red) corresponds to fentanyl deaths, which was an order of magnitude greater than OODs or HOD. The large oval highlights data influenced by the COVID-19 pandemic in 2020
Fig. 4
Fig. 4
Racial disparity of the Opioid Epidemic. Illinois (top left), Maryland (top right), Michigan (bottom left), and Washington DC (bottom right). Black bars, individual deaths recorded as Black, African American, African ancestry; white bars, deaths recorded as White, Caucasian, or European heritage. The large oval highlights data influenced by the COVID-19 pandemic in 2020
Fig. 5
Fig. 5
Opioid-related deaths in Philadelphia, PA. A Comparison of OODs and heroin deaths from 2013 to 2020. B Deaths where fentanyl was implicated. C Racial disparity of the opioid epidemic; black bars, individual deaths recorded as Black, African American, or of African ancestry; white bars, deaths recorded as White, Caucasian, or European heritage. D Comparison of OODs to homicides from 2013 to 2020. The large ovals highlight data influenced by the COVID-19 pandemic in 2020
Fig. 6
Fig. 6
Opioid-related deaths by race, per capita. A Deaths were expressed per 100,000 Black or White people based on census data for each state. In Illinois (top left), Maryland (top right), Michigan (bottom right), and Washington DC (bottom left). B Average of the 2018 or 2019 per capita deaths for all regions; Black solid graphs are deaths recorded as being Black, African American, or of African ancestry; white/clear open graphs are deaths recorded as White, Caucasian, or of European heritage
Fig. 7
Fig. 7
Heroin and fentanyl-related deaths by race. A Heroin and B fentanyl deaths in Black (black bars) and White (white bars) individuals in Illinois (top left), Maryland (top right), Michigan (bottom left), and Washington DC (bottom left)
Fig. 8
Fig. 8
Comparison of opioid-related deaths and homicides. Illinois (top left), Maryland (top right), Michigan (bottom left), and Washington DC (bottom right). Solid red circles are OODs for each region, and open circles, homicides

References

    1. Vital statistics rapid release: provisional drug overdose death counts [Internet]. Center for Disease Control and Prevention. 2021. Available from: https://www.cdc.gov/nchs/nvss/vsrr/drug-overdose-data.htm#selection_spec....
    1. Vo AT, Patton T, Peacock A, Larney S, Borquez A. Illicit substance use and the COVID-19 pandemic in the United States: a scoping review and characterization of research evidence in unprecedented times. Int J Environ Res Publ Health. 2022;19:14. doi: 10.3390/ijerph19148883. - DOI - PMC - PubMed
    1. Mericle AA, Sheridan D, Howell J, Braucht GS, Karriker-Jaffe K, Polcin DL. Sheltering in place and social distancing when the services provided are housing and social support: the COVID-19 health crisis and recovery housing. J Subst Abuse Treat. 2020;119:108094. doi: 10.1016/j.jsat.2020.108094. - DOI - PMC - PubMed
    1. Avena NM, Simkus J, Lewandowski A, Gold MS, Potenza MN. Substance use disorders and behavioral addictions during the COVID-19 pandemic and COVID-19-related restrictions. Front Psychiatry. 2021;12:653674. doi: 10.3389/fpsyt.2021.653674. - DOI - PMC - PubMed
    1. Hall AJ, Logan JE, Toblin RL, Kaplan JA, Kraner JC, Bixler D, et al. Patterns of abuse among unintentional pharmaceutical overdose fatalities. JAMA. 2008;300(22):2613–2620. doi: 10.1001/jama.2008.802. - DOI - PubMed

Publication types

MeSH terms

LinkOut - more resources