

Pulmonary function and chest computed tomography abnormalities 6-12 months after recovery from COVID-19: a systematic review and meta-analysis
- PMID: 36068582
- PMCID: PMC9446643
- DOI: 10.1186/s12931-022-02163-x
Pulmonary function and chest computed tomography abnormalities 6-12 months after recovery from COVID-19: a systematic review and meta-analysis
Abstract
Background: Some coronavirus disease 2019 (COVID-19) survivors experience prolonged and varying symptoms, a condition termed post-acute COVID-19 syndrome (PACS). However, the prevalence of chronic pulmonary sequelae of PACS during long-term follow-up remains unclear. Several studies have examined this issue and reported heterogeneous results.
Methods: We conducted a systematic review and meta-analysis using a random-effects model to estimate the pooled prevalence of the pulmonary sequelae of COVID-19, as demonstrated by pulmonary function testing (PFT) and chest computed tomography (CT) performed at least 6 months after initial infection. PubMed, Embase, and Cochrane Library databases were searched from January 1, 2020 to December 31, 2021 to identify related studies. We investigated whether the prevalence of pulmonary sequelae decreased over time and attempted to identify the factors associated with their development by performing multiple subgroup and meta-regression analyses.
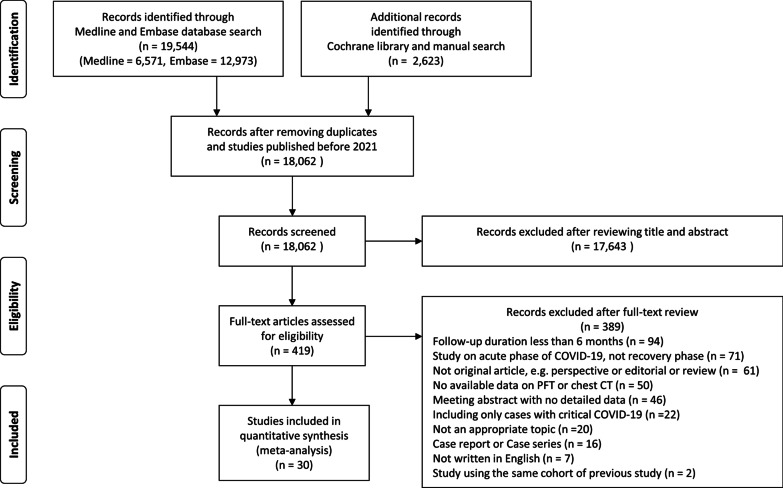
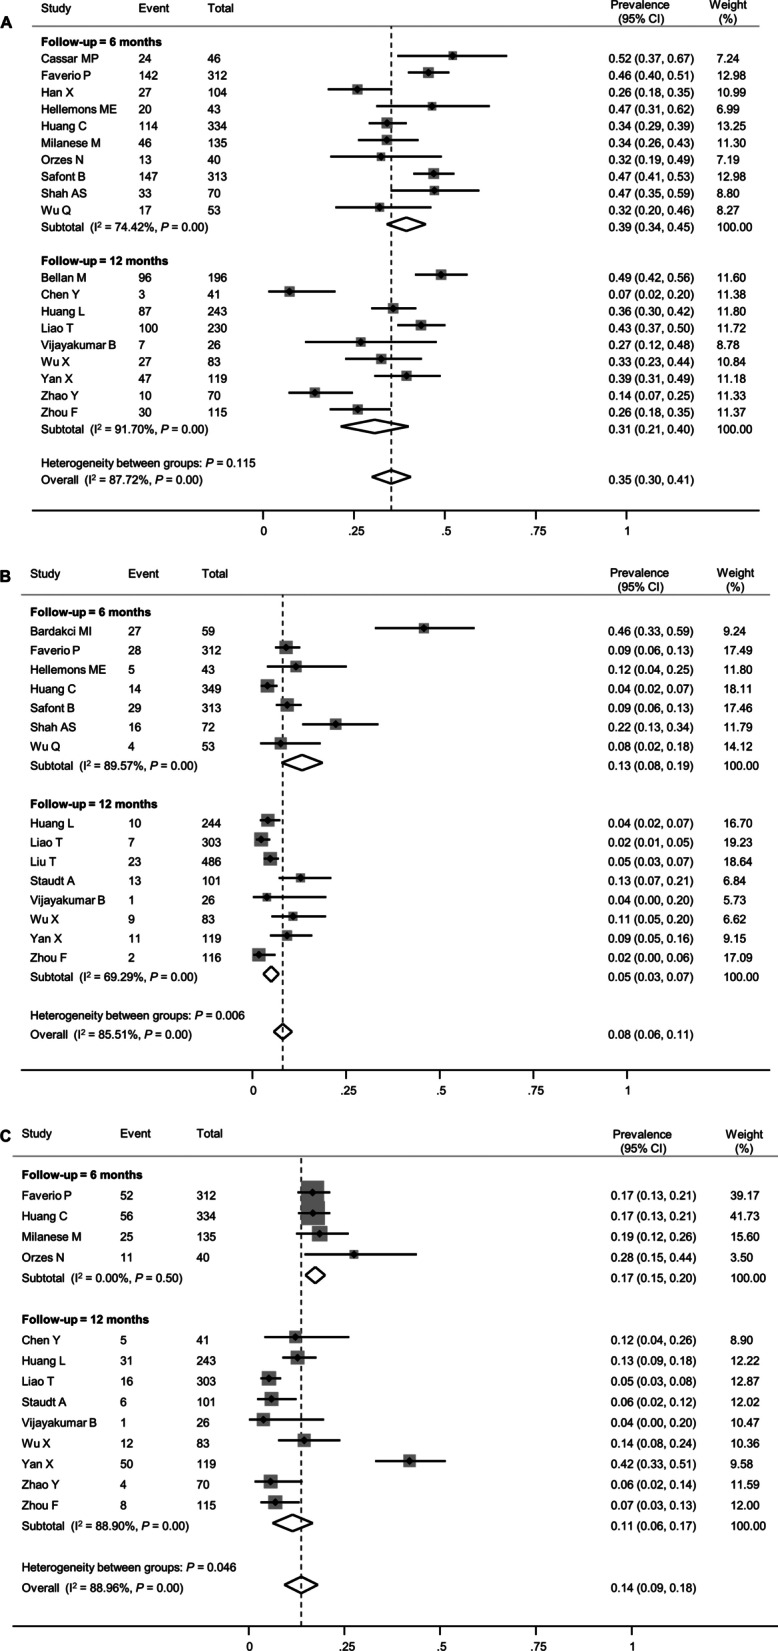
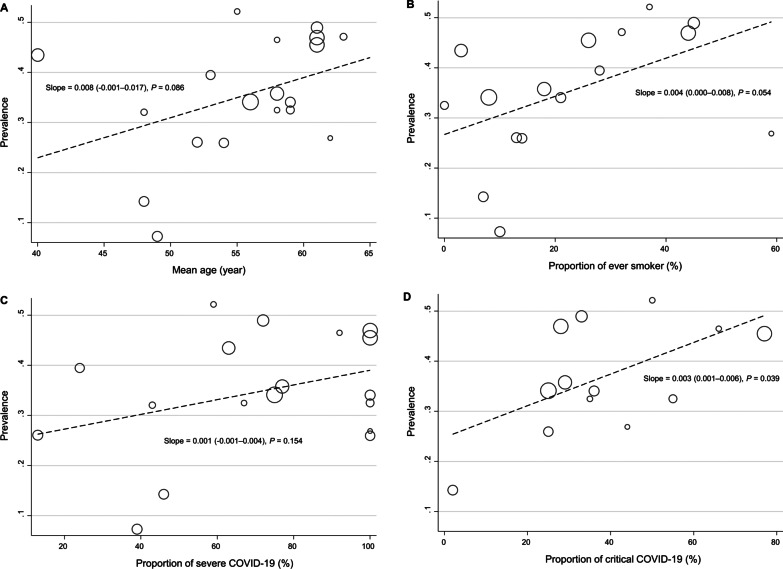
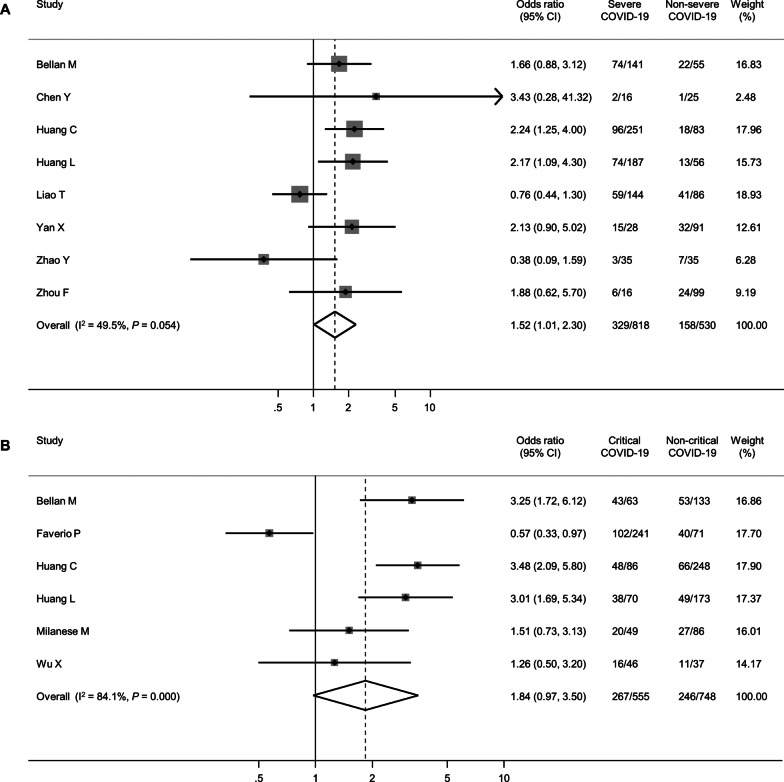
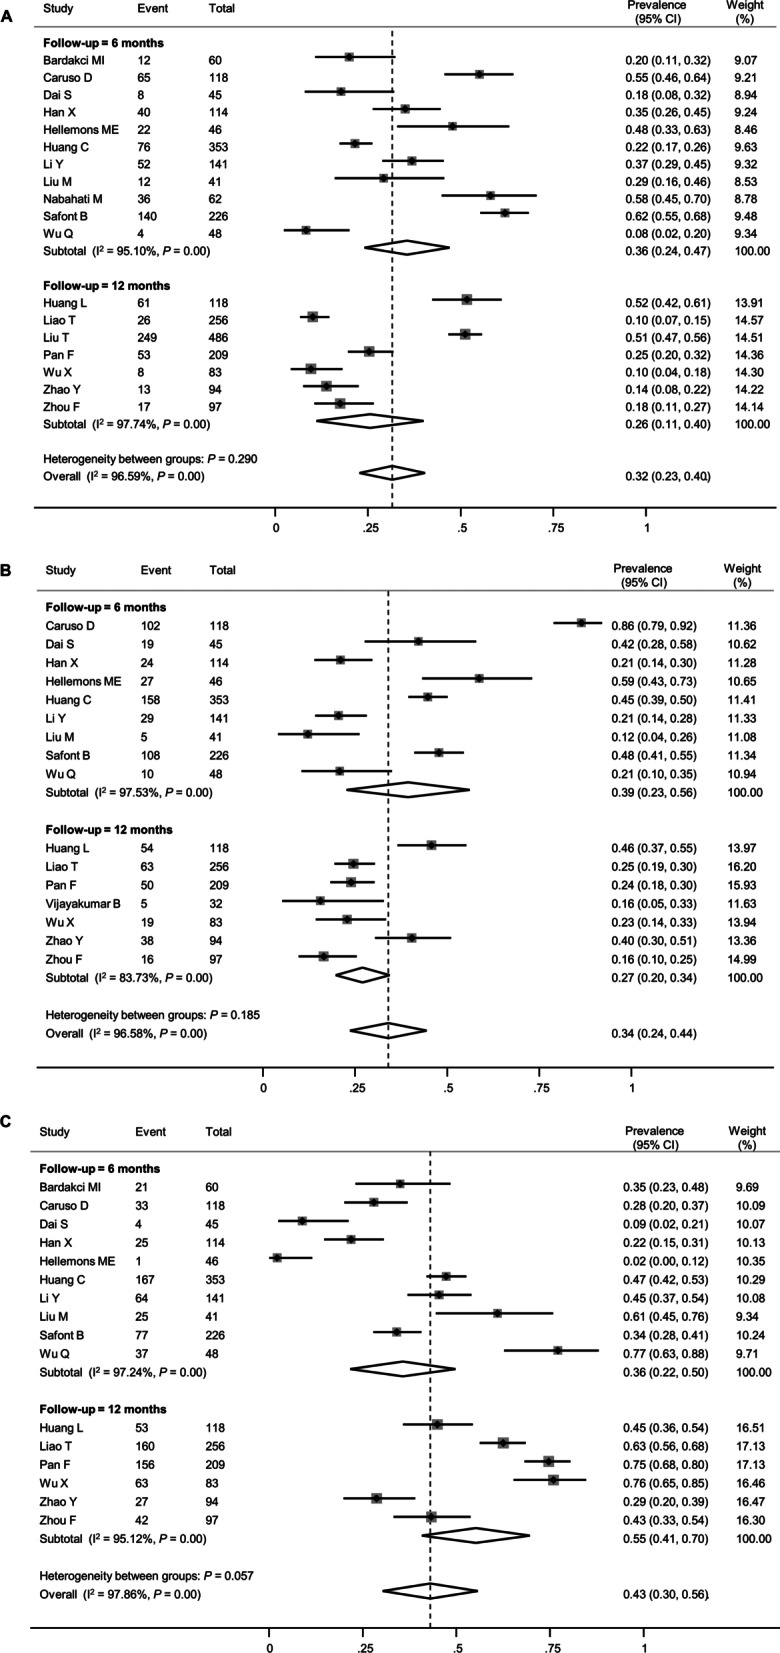
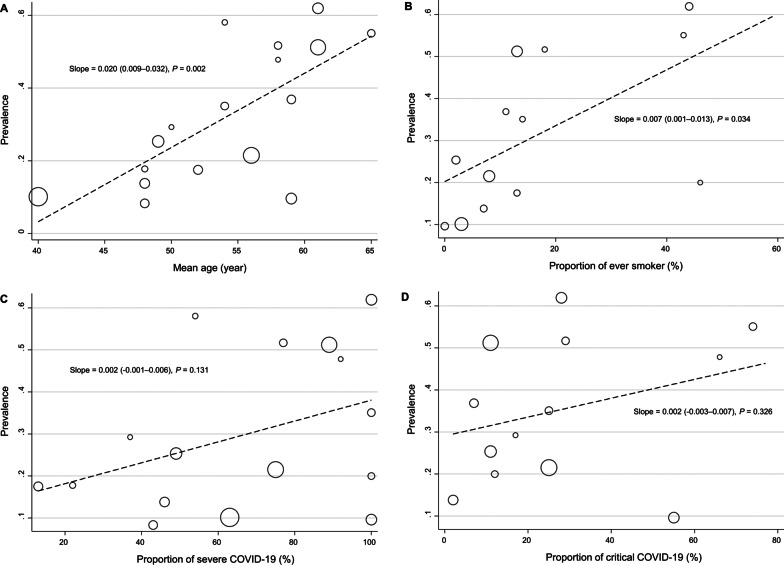
Results: Of the 18,062 studies identified, 30 met our eligibility criteria. Among these studies, 25 and 22 had follow-up PFT and chest CT data, respectively. The follow-up durations were approximately 6 and 12 months in 18 and 12 studies, respectively. Impaired diffusion capacity was the most common abnormality on PFT (pooled prevalence 35%, 95% confidence interval [CI] 30-41%) with a prevalence of 39% (95% CI 34-45%) and 31% (95% CI 21-40%) in the 6-month and 12-month follow-up studies, respectively (P = 0.115). Restrictive pulmonary dysfunction evident as reduced forced vital capacity was less frequent (pooled prevalence 8%, 95% CI 6-11%); however, its prevalence was lower in the 12-month follow-up studies than in the 6-month follow-up studies (5% [95% CI 3-7%] vs. 13% [95% CI 8-19%], P = 0.006). On follow-up chest CT, the pooled prevalence of persistent ground-glass opacities and pulmonary fibrosis was 34% (95% CI 24-44%) and 32% (95% CI 23-40%), respectively, and the prevalence did not decrease over time. As every meta-analysis showed significant between-study heterogeneity, subgroup and meta-regression analyses were performed to identify potential effect modifiers; the severity of index infection was associated with the prevalence of impaired diffusion capacity and pulmonary fibrosis.
Conclusions: A substantial number of COVID-19 survivors displayed pulmonary sequelae as part of PACS. Except for restrictive pulmonary dysfunction, the prevalence of these sequelae did not decrease until 1 year after initial infection. Considering the association between the severity of acute COVID-19 and risk of pulmonary sequelae, patients who recover from severe COVID-19 require close respiratory follow-up. Systematic review registration number PROSPERO CRD42021234357.
Keywords: COVID-19; Complications; Computed tomography; Meta-analysis; Respiratory Function Tests.
© 2022. The Author(s).
Conflict of interest statement
The authors declare that they have no competing interests.
Figures
References
-
- World Health Organization. WHO coronavirus (COVID-19) dashboard. https://covid19.who.int/.
-
- World Health Organization . Severity of disease associated with Omicron variant as compared with Delta variant in hospitalized patients with suspected or confirmed SARS-CoV-2 infection. Geneva: World Health Organization; 2022.
Publication types
MeSH terms
LinkOut - more resources
Full Text Sources
Medical
Research Materials
Miscellaneous
