

A catalog of numerical centrosome defects in epithelial ovarian cancers
- PMID: 36069081
- PMCID: PMC9449595
- DOI: 10.15252/emmm.202215670
A catalog of numerical centrosome defects in epithelial ovarian cancers
Abstract
Centrosome amplification, the presence of more than two centrosomes in a cell is a common feature of most human cancer cell lines. However, little is known about centrosome numbers in human cancers and whether amplification or other numerical aberrations are frequently present. To address this question, we have analyzed a large cohort of primary human epithelial ovarian cancers (EOCs) from 100 patients. We found that rigorous quantitation of centrosome number in tumor samples was extremely challenging due to tumor heterogeneity and extensive tissue disorganization. Interestingly, even if centrosome clusters could be identified, the incidence of centrosome amplification was not comparable to what has been described in cultured cancer cells. Surprisingly, centrosome loss events where a few or many nuclei were not associated with centrosomes were clearly noticed and overall more frequent than centrosome amplification. Our findings highlight the difficulty of characterizing centrosome numbers in human tumors, while revealing a novel paradigm of centrosome number defects in EOCs.
Keywords: centrosome number alterations; centrosomes; ovarian cancers.
© 2022 The Authors. Published under the terms of the CC BY 4.0 license.
Figures
- A
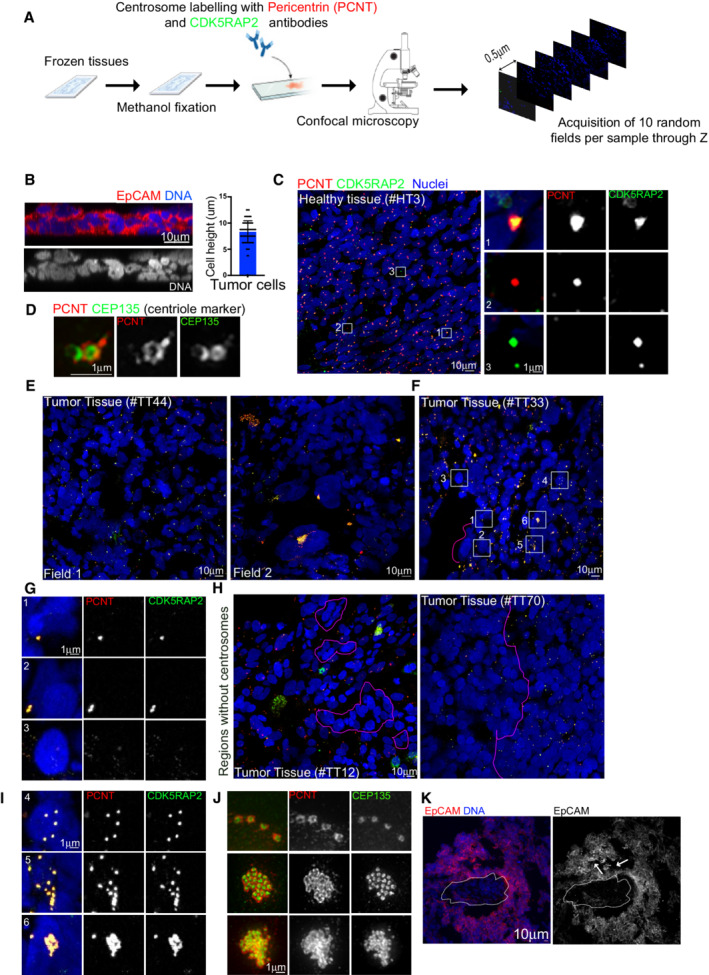
Schematic diagram of the workflow used to analyze ovarian tissue sections.
- B
Left, orthogonal view of a 20 μm tumor section labeled with antibodies against EpCAM (in red) and DNA in blue. Right, dot plot bar representing cell heights in cells from tumor sections, n = 60 cells from 1 tumor. Mean ± SD.
- C
On the left, images of low magnification views of healthy tissues labeled with antibodies against pericentrin (PCNT) and CDK5RAP2, shown in red and green, respectively. DNA in blue. The white dashed squares represent the regions shown in higher magnifications on the right. One centrosome was considered as such when PCNT and CDK5RAP2 signals co‐localized (Inset 1). Lack of co‐localization (Insets 2 and 3) was noticed and discarded during quantification.
- D
Super‐resolution microscopy of healthy tissues labeled for the centriole marker CEP135 (in green) and PCNT (in red).
- E, F
Representative images of two different fields of the same tumor (E) and of a tumor section to highlight different centrosome phenotypes, labeled as described in (C). The pink dashed line highlights an area of cells without centrosomes. The white‐dashed squares represent the regions shown in higher magnifications in insets in (G and I) and the pink dashed line surrounds nuclei without centrosomes.
- G
Insets from (F).
- H
Examples of tumor sections showing small (left) and large (right) regions with nuclei without centrosomes.
- I
Insets from (F) showing different types of centrosome amplification events.
- J
Super‐resolution microscopy of tumor tissues labeled as in (C).
- K
Maximum Z‐projection of a tumor section labeled with EpCAM antibodies (Red) and DNA in blue. The dashed line shows the absence of EpCAM staining, arrows show a disorganized region.
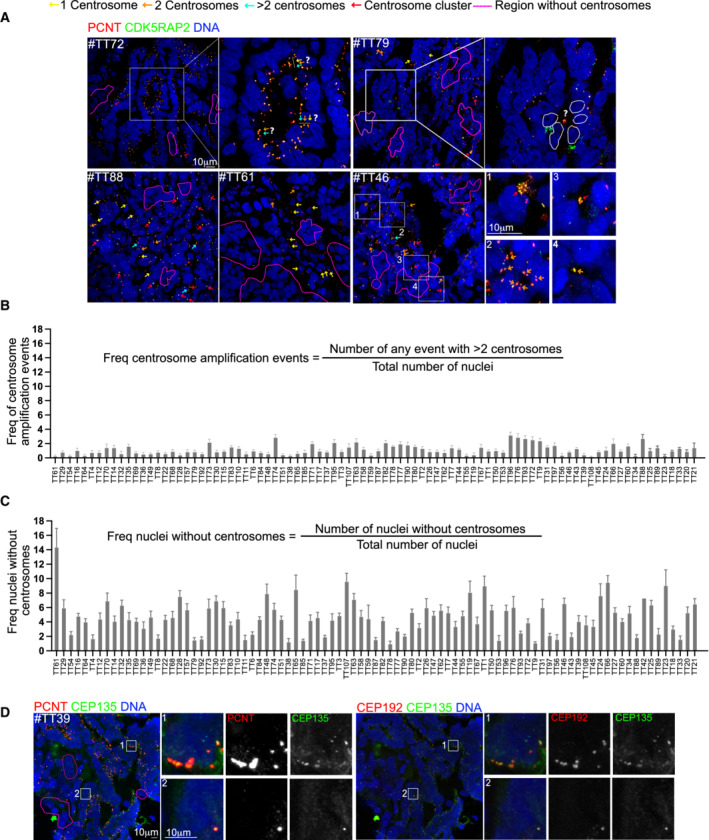
- A
Images of EOC tumors labeled with antibodies against PCNT (red) and CDKRAP2 (green). Nuclei are shown in blue. The colored arrows reflect different centrosome number. The list of centrosome behaviors annotated it is not exhaustive to allow comprehension of the events. #TT72 shows a cyst‐like arrangement of EOC nuclei where it is impossible to correspond centrosomes to individual nuclei. The white bars with arrows of different colors highlight possible interpretations of the same condition. In #TT79, regions without centrosomes can be identified. In the inset, a single centrosome localized in the lumen can be identified and it is not possible to know to which nucleus (white dashed lines) it corresponds to. #TT88 presents only very small clusters of centrosomes, few nuclei without centrosomes and many conditions with two centrosomes. In #TT61, regions without centrosomes can be distinguished, in addition to nuclei associated with single centrosomes. In #TT46, clusters containing large (inset 1) or small clusters (inset 3) can be identified. In cyst‐like arrangements several centrosomes can be identified (inset 2), suggesting that all cells have at least one centrosome or, in contrast just one centrosome (inset 4), illustrating lack of centrosomes.
- B, C
Plots showing the frequency of centrosome amplification events (B) and the frequency of nuclei without centrosomes (C) in tumor tissues. Note that in B and C, the order of the tumors is conserved between the two plots to allow for comparison. For each tumor, 10 random fields were chosen and analyzed, with an average of 5,248 nuclei counted per tumor. Bars represent the mean ± SD.
- D
Tumor sections labeled with CEP135 (green) and PCNT (red) on the left and CEP135 (green) and CEP192 (red) on the right. The white squares represent the regions shown in higher magnifications on the right.
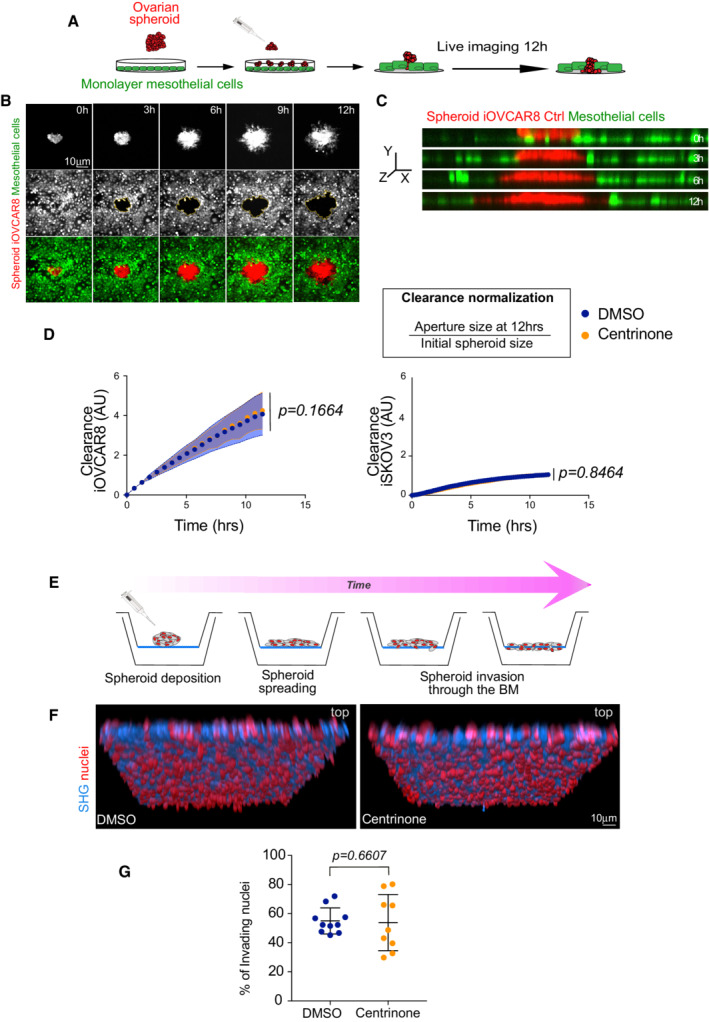
- A
Schematic diagram of the experimental setup used in mesothelial cell clearance assays.
- B
Stills of a time‐lapse movie of Ctrl spheroids. Time is shown in hours (h).
- C
z‐ view of Ctrl cells as shown in (B). Note the red‐colored cancer cells at the beginning of the movie on top of the mesothelial layer (green) while at later time points, they have cleared through the mesothelial cells.
- D
Graph bars of the normalized clearance in A.U. of iOVCAR8 (left) and iSKOV3 (right) spheroids after the indicated treatments. The two cell lines show different clearance capacity. For each cell line, three independent experiments were performed. For iOVCAR8, we analyzed 47 spheroids in DMSO and 56 spheroids in centrinone. For iSKOV3 we analyzed 56 spheroids in DMSO and 48 spheroids in centrinone. Dots represent the mean and the shadow ± SEM. Statistical significance was assessed with an ANCOVA test. Dots represent the mean and the shadow ± SEM. Statistical significance was assessed with an ANOVA test.
- E
Schematic diagram of the experimental setup used in BM invasion assays.
- F
Representative images of DMSO (left) and centrinone (right) spheroids. Mean ± SD. Red nuclei represent false colored invading nuclei.
- G
Dot plot showing the quantification of the number of nuclei detected on the bottom side of the BM. Three or four positions from three BM inserts were analyzed in each condition. Mean ± SD. Statistical significance was assessed with the Mann–Whitney test. For all the experiments, the centrosome number was verified in parallel to confirm the decreased centrosome conditions compared to DMSO.
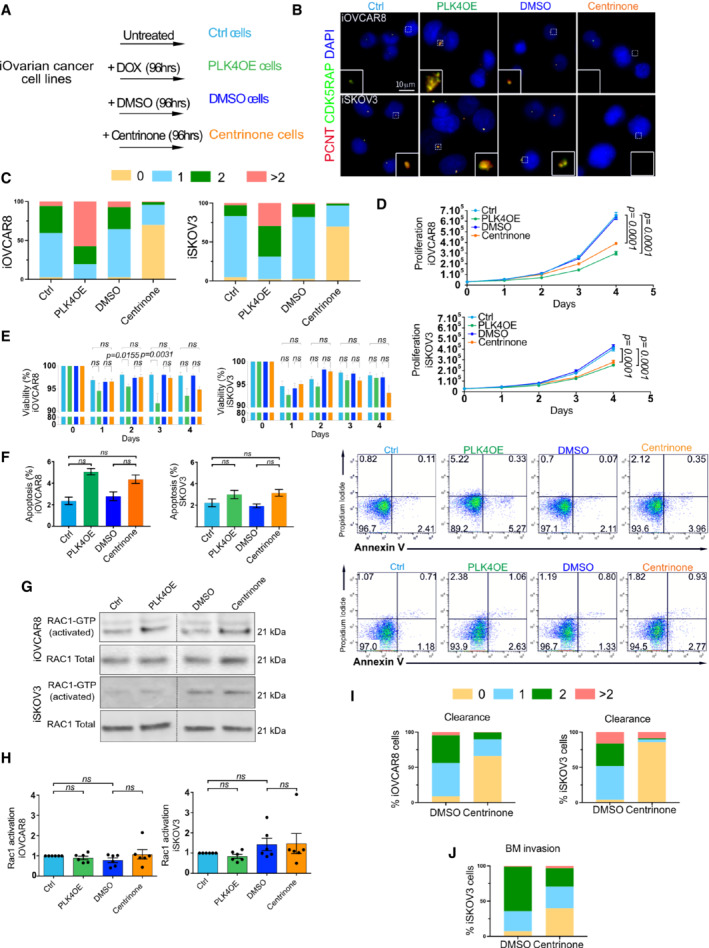
- A
Scheme of the different experimental conditions and nomenclature used.
- B
Representative images of iOVCAR8 (top) and iSKOV3 (bottom) after the indicated treatments labeled with antibodies against PCNT and CDK5RAP2 (red and green respectively, DNA in blue). The white dashed squares represent the regions shown in higher magnification on the bottom.
- C
Graph bars representing the percentage of cells according to centrosome number after the different treatments of iOVCAR8 (left) and iSKOV3 (right), at least 80 cells analyzed by condition.
- D
Graphs representing the proliferation of iOVCAR8 and iSKOV3 cells after each treatment for 4 days. From three replicates in three independent experiments, statistical significances assessed with two‐way ANOVA, n = 6 independent experiments. Mean ± SD.
- E
Graph bars representing the viability of iOVCAR8 and iSKOV3 cells after the designated treatment according to indicated timing in days. From three replicates in three independent experiments, statistical significance was assessed with one‐way ANOVA, n = 6 independent experiments. Mean ± SD.
- F
On the left, graph bars represent the percentage of apoptotic cells iOVCAR8 and iSKOV3 after each indicated treatment. Statistical significances were assessed with the Wilcoxon test, n = 6 independent experiments (H). Mean ± SD. On the right, representative FACS plots showing Annexin V+ (x‐axis) and PI+ (y‐axis) cells, for iOVCAR8 (top) and iSKOV3 (bottom) cells after the indicated treatments. For all experiments, n = 3 independent experiments.
- G, H
Western blot and graphs bars representing the quantifications of active RAC‐1 in iOVCAR8 and iSKOV3 cell lines after the indicated treatments. Statistical significances were assessed with one‐way ANOVA, n = 6 independent experiments. Mean ± SD.
- I, J
Dot plot graphs showing the percentage of cells in each category according to centrosome number corresponding to the experiments of mesothelial cell clearance (I) and BM invasion assays (J). At least 80 cells were analyzed per condition.
References
Publication types
MeSH terms
LinkOut - more resources
Full Text Sources
Medical
