. 2022 Sep 7:11:e73754.
doi: 10.7554/eLife.73754.

Epigenetic remodeling by vitamin C potentiates plasma cell differentiation

Affiliations

Epigenetic remodeling by vitamin C potentiates plasma cell differentiation

Heng-Yi Chen et al. Elife. .

Abstract

Ascorbate (vitamin C) is an essential micronutrient in humans. The severe chronic deficiency of ascorbate, termed scurvy, has long been associated with increased susceptibility to infections. How ascorbate affects the immune system at the cellular and molecular levels remained unclear. From a micronutrient analysis, we identified ascorbate as a potent enhancer for antibody response by facilitating the IL-21/STAT3-dependent plasma cell differentiation in mouse and human B cells. The effect of ascorbate is unique as other antioxidants failed to promote plasma cell differentiation. Ascorbate is especially critical during early B cell activation by poising the cells to plasma cell lineage without affecting the proximal IL-21/STAT3 signaling and the overall transcriptome. As a cofactor for epigenetic enzymes, ascorbate facilitates TET2/3-mediated DNA modification and demethylation of multiple elements at the Prdm1 locus. DNA demethylation augments STAT3 association at the Prdm1 promoter and a downstream enhancer, thus ensuring efficient gene expression and plasma cell differentiation. The results suggest that an adequate level of ascorbate is required for antibody response and highlight how micronutrients may regulate the activity of epigenetic enzymes to regulate gene expression. Our findings imply that epigenetic enzymes can function as sensors to gauge the availability of metabolites and influence cell fate decisions.

Keywords: B cells; TET; epigenetics; human; immunology; inflammation; micronutrients; mouse; plasma cells; vitamin C.


Conflict of interest statement

HC, AA, FL, MH, EJ, EG, JY, RB, QM, HG, DW, FH, CL No competing interests declared

Figures

Figure 1.
Figure 1.. Vitamin C (VC) augments mouse and human plasma cell differentiation.
(A) Schematic depiction of the two-step 40LB cell culture system. Splenic naïve B cells were isolated and cultured with IL-4 and irradiated 40LB cells, which express CD40L and BAFF. Four days after culture, cells were subcultured to new layer of 40LB cells. IL-21 was used to induce plasma cell differentiation. (B) Fluorescence-activated cell sorting (FACS) analysis of plasma cells generated after each step during the two-step culture. The plasma cell marker CD138 was analyzed on days 4 and 7 (n = 6). (C, D) Micronutrient analysis for plasma cell differentiation. B cells were cultured with supplements as indicated and were analyzed by FACS on day 7 (n = 6). (E) Low basal oxidative states in cultured B cells. B cells were cultured for 4 days with or without VC and the reactive oxygen species were monitored using a FACS-based fluorescent assay (CellROX). The antioxidant N-acetylcysteine (NAC) and oxidant tert-butyl hydroperoxide (TBHP) were added 30 and 15 min, respectively, prior to the assay as controls (n = 3). (F, G) VC enhances the differentiation of human plasma cells. Naïve B cells were isolated from human peripheral blood mononuclear cells (PBMCs) and stimulated for 6 days as indicated to induce plasma cell differentiation in the presence or absence of VC. Data are from 5 to 6 independent experiments with 5–6 donors. All data are from at least two independent experiments. Mean ± SEM is shown for bar charts. Statistical significance was determined by unpaired (B, E) or paired (F, G) Student’s t-test and one-way ANOVA with Dunnett’s post hoc test (D). ***p<0.001. ns, not significant.
Figure 1—figure supplement 1.
Figure 1—figure supplement 1.. Minimal effect of vitamin C (VC) on B cell survival.
(A) Culture supplements had no significant effect on B cell numbers. B cells were cultured as in Figure 1C and D and the cells were enumerated on day 7 using Vi-CELL BLU cell viability analyzer (n = 3). (B, C) VC had no major effect on cell death. B cells were cultured with or without VC, and the percentage of apoptotic cells was analyzed by fluorescence-activated cell sorting (FACS) using 7AAD and Annexin V (n = 6). (B) Representative FACS plots. (C) Quantification. Statistical significance was determined by one-way ANOVA with Dunnett’s post hoc test (A) or unpaired Student’s t-test (C). ns, not significant (p>0.05).
Figure 1—figure supplement 2.
Figure 1—figure supplement 2.. Vitamin C (VC) stereoisomer and derivative could promote plasma cell differentiation.
B cells were cultured as in Figure 1. VC (L-ascorbic acid [L-AA]), VC derivative L-ascorbic acid 2-phosphate (P-AA), and VC stereoisomer erythorbic acid (EA) were added throughout the culture, and the percentage of CD138+ cells was analyzed by fluorescence-activated cell sorting (FACS) on day 7 (n = 6). A representative experiment is shown from two independent experiments. Mean ± SEM is shown for each concentration, with most error bars not visible due to low variability.
Figure 1—figure supplement 3.
Figure 1—figure supplement 3.. Ascorbate oxidase (AAO) inhibits vitamin C (VC)-mediated plasma cell differentiation.
L-ascorbic acid (L-AA) or L-ascorbic acid 2-phosphate (P-AA) were treated with AAO for 1 hr and added to 40LB-B cell co-culture at the beginning of the first step. Cells were analyzed the percentage of CD138+ (% PC) by fluorescence-activated cell sorting (FACS) on day 7 (n = 3). Mean ± SEM is shown for bar charts. Statistical significance was determined by two-way ANOVA.
Figure 1—figure supplement 4.
Figure 1—figure supplement 4.. Vitamin C (VC) enhances plasma cell differentiation and antibody secretions from lipopolysaccharide (LPS)-stimulated B cells.
(A) VC increased plasma cell differentiation from LPS-stimulated B cells. Mock or VC-treated B cells were cultured with LPS or combined cytokines (IL-4 or IFN-γ) for 4 days. Cells were analyzed by the expression of CD138 by fluorescence-activated cell sorting (FACS) (n = 6). (B) VC increased antibody secretion from LPS-stimulated B cells. The culture supernatant was collected and the secreted antibody was analyzed by ELISA (n = 6). All data are from at least two independent experiments. Mean ± SEM is shown for bar charts. Statistical significance was determined by unpaired Student’s t-test. ***p<0.001, **p<0.01, *p<0.005.
Figure 1—figure supplement 5.
Figure 1—figure supplement 5.. Vitamin C (VC) increases the differentiation of antibody-secreting cells (ASC) from human B cells.
(A) Analysis of purified naïve B cells. Human naïve B cells were isolated from peripheral blood mononuclear cell (PBMC) using magnetic human naïve B cell isolation kit. Isolated cells were analyzed by fluorescence-activated cell sorting (FACS) to examine purity. Typical purity is above 95%. (B, C) VC enhances the differentiation of human plasma cells. Naïve B cells were isolated from human PBMCs and stimulated using a two-step culture in the presence or absence of VC as stated. The percentages of (B) ASC (IgDlo CD38hi) and (C) early plasma cells (PB, CD27hi CD38hi) were analyzed by FACS on day 7. Pooled data from three independent experiments using cells from three donors are shown (mock, n = 16; VC, n = 14). Mean ± SEM is shown for bar charts. Statistical significance was determined by unpaired Student’s t-test. ***p<0.001.
Figure 2.
Figure 2.. Vitamin C (VC) promotes the generation of bona fide plasma cells.
(A, B) Expression analysis of lineage transcription factors (TFs). B cells were cultured as indicated for 7 days, and the expression of transcription factors was analyzed by intracellular staining and fluorescence-activated cell sorting (FACS) (n = 6). Representative FACS plots (A) and summaries (B) are shown. Note that BLIMP1 and IRF4 are important TF plasma cell differentiation. (C) Antibody secretion by VC-induced plasma cells. Culture supernatants were collected after day 7, and the secreted antibodies with indicated isotypes (IgM, IgG1, IgE) were analyzed by ELISA (n = 6). All data are from at least two independent experiments. Mean ± SEM is shown for bar charts, and the statistical significance was determined by unpaired Student’s t-test. ***p<0.001.
Figure 2—figure supplement 1.
Figure 2—figure supplement 1.. Vitamin C (VC) similarly promotes plasma cell differentiation from polyclonal and monoclonal naïve B cells.
B cells were isolated from B6 WT mice or IghCGG mice and stimulated as in Figure 1. Percentage of CD138 was analyzed by fluorescence-activated cell sorting (FACS) on day 7 (n = 3). Representative data is shown from two independent experiments. Mean ± SEM is shown for bar charts, and the statistical significance was determined by unpaired Student’s t-test. ***p<0.001. ns, not significant (p>0.05).
Figure 2—figure supplement 2.
Figure 2—figure supplement 2.. Minimal antibody secretion and differentiation of plasma cells at early stage.
(A) Low level of antibody secretion on day 4. Mock or vitamin C (VC)-treated B cells were cultured with 40LB and IL-4 for 4 days (first step; Figure 1A), and the antibody secretion was analyzed by ELISA (n = 6). Note that the scales of IgG1 and IgE in Figure 2C are at least 50–200× higher. (B) Low percentage of plasma cells on day 4. Transcription factors (TFs) were analyzed as in Figure 2A and B. There are statistically significant but minor changes (compared Figure 2B) in PAX5+ and BLIMP1+ cells between mock and VC groups (n = 6). All data are from at least two independent experiments. Mean ± SEM is shown for bar charts, and the statistical significance was determined by unpaired Student’s t-test. ***p<0.001, **p<0.01.
Figure 2—figure supplement 3.
Figure 2—figure supplement 3.. Vitamin C (VC) increases plasma cells with a mature phenotype in an extended culture.
(A) Schematic depiction of the three-step 40LB cell culture system. Splenic naïve B cells were cultured with 40LB as in Figure 1 with an additional 4-day culture with IL-21 and 40LB. (B, C) Mock or VC-treated B cells were analyzed by fluorescence-activated cell sorting (FACS) for (B) percentage of CD138+ cells and (C) their CD19 expression level on day 11 (n = 3). Representative data is shown from two independent experiments. Mean ± SEM is shown for bar charts, and the statistical significance was determined by unpaired Student’s t-test. ***p<0.001.
Figure 3.
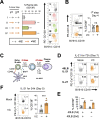
Figure 3.. Vitamin C (VC) potentiates the IL-21-dependent differentiation of plasma cell during the initial activation phase.
(A) VC is required during activation phase. B cells were treated with or without VC as indicated for the first- and second-step culture. Dotted arrow represents control and solid orange arrow indicates VC. Plasma cell differentiation (%CD138+) was analyzed on day 7 by fluorescence-activated cell sorting (FACS). Representative FACS plots are shown on right and summarized data are shown on left. Roman numbers are used for correlation between panels. (B) VC has no significant effect on the percentage of plasma cells after first-step culture. Representative FACS plots for plasma cell marker CD138 of B cells on day 4 (left), and the summarized data (right) are shown (n = 6). (C–E) IL-21 alone is sufficient to induce plasma cell differentiation during the second step. (C) Schematic representation of the B cell culture used in the next panels. B cells were cultured with IL-21 for indicated time without the 40LB stromal cells. (D, E) Cells were either cultured with or without 40LB in the presence of IL-21 during the second step. Percentage of plasma cells (%CD138+) was analyzed by FACS on day 7 (n = 6). The representative FACS plots (D) and summarized data (E) are shown. (F) IL-21 stimulation induced plasma cell differentiation after 24 hr. B cells were cultured in the absence (mock) or presence (VC) of VC during the first step with IL-4 and 40LB. Cells were stimulated with IL-21 alone for 24 hr and the percentage of CD138+ cells was analyzed by FACS (n = 9). All data are from at least two independent experiments. Mean ± SEM is shown for bar charts, and the statistical significance was determined by one-way ANOVA with Dunnett’s post hoc test (A) and unpaired Student’s t-test (B, E, F). ***p<0.001. ns, not significant.
Figure 3—figure supplement 1.
Figure 3—figure supplement 1.. IL-21 alone during later phase is sufficient for plasma cell differentiation.
B cells were cultured with IL-21 alone with or without 40LB during the second step as in Figure 3D. (A) Antibody secretion was analyzed by ELISA, and (B) the expression of transcription factors (TFs) was analyzed by fluorescence-activated cell sorting (FACS) on day 7 (n = 6). All data are from at least two independent experiments. Mean ± SEM is shown for bar charts, and the statistical significance was determined by unpaired Student’s t-test. ***p<0.001. ns, not significant.
Figure 4.
Figure 4.. Vitamin C (VC) did not promote the proximal IL-21 signaling.
(A) VC has no effect on IL-21 receptor expression. Mock or VC-treated B cells were cultured for 4 days, and the expression of IL-21R was analyzed by fluorescence-activated cell sorting (FACS) (n = 6). (B) VC does not alter the IL-21-induced STAT3 phosphorylation. B cells from day 4 culture were stimulated with IL-21 for 30 min, and the level of STAT3 phosphorylation (pSTAT3) was analyzed by FACS (n = 6). Representative histograms are shown on left and summarized data on right. All data are from at least two independent experiments. Mean ± SEM is shown for bar charts, and the statistical significance was determined by unpaired Student’s t-test. ns, not significant.
Figure 5.
Figure 5.. Limited effect of vitamin C (VC) on the transcriptome in activated B cells.
The mRNA was isolated from naïve and indicated day 4 activated B cells, and the transcriptomes were analyzed by RNA-seq (see ‘Materials and methods’). Comparisons shown are between (A) naïve vs. mock, (B) naïve vs. VC, and (C) mock vs. VC. Three independent biological replicates were used for each group. Red dots indicate differentially expressed genes with an adjusted p-value≤0.01 and log2 fold change ≥ 1. Numbers indicate the numbers of differentially expressed genes. Gene names for all differentially expressed genes are shown in (C).
Figure 6.
Figure 6.. TET2 or TET3 is required for vitamin C (VC)-mediated enhancement of plasma cell differentiation.
(A–D)Tet2 or Tet3 is sufficient for VC-mediated increase in plasma cells. (A, B) B cells from WT (Cd19Cre/+) or Tet2 conditional-deficient (Cd19Cre/+ Tet2fl/fl; Tet2-KO) mice isolated and cultured as in Figure 1A with or without VC. Percentage of CD138+ cells was analyzed by fluorescence-activated cell sorting (FACS) on day 7 (n = 3). (C, D) B cells were isolated from either WT (Cd19Cre/+) or Tet3 conditional KO (Cd19Cre/+ Tet3fl/fl; Tet3-KO) and cultured as in (A; n = 3). Representative FACS plots (A, C) and summarized data (B, D) are shown. (E–H) Tet2 or Tet3 are required for the effect of VC. Control (CreERT2) or Tet2/Tet3 conditional-deficient (CreERT2 Tet2fl/flTet3fl/fl) mice were injected with tamoxifen for five consecutive days and B cells were isolated by cell sorting on day 8. The expression of Rosa26-YFP was used as a surrogate marker for Cre activity. B cells were cultured as in (A) or (C), and the percentage of CD138 (E) and intracellular staining of transcription factors (TFs) (F) were analyzed by FACS on day 7. Summarized data are shown in (G) and (H). All data are from at least two independent experiments. Mean ± SEM is shown for bar charts, and the statistical significance was determined by unpaired Student’s t-test. ***p<0.001, *p<0.05. ns, not significant.
Figure 7.
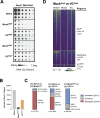
Figure 7.. Vitamin C (VC) induced a global increase in 5hmC modification.
(A) VC increased total 5hmC in B cells. DNA from indicated B cells were isolated and the total 5hmC levels were analyzed using cytosine 5-methylenesulfonate (CMS) dot blot (‘Materials and methods’). Note that CMS is the immunogenic product of 5hmC after bisulfite treatment. DNA was serially twofold diluted starting from 250 ng to ~7.8 ng. Three biological replicates were blotted for each group. (B–D) The genome-wide 5hmC enrichment was analyzed using a CLICK-chemistry-based pull-down method (HMCP). Two biological replicates were used for each condition (naïve, MockDay4, VCDay4; see ‘Materials and methods’ for details). (B) VC treatment increased the numbers of 5hmC-enriched region. The number of 5hmC-enriched (5hmC+) regions was called using HOMER, and the numbers of consensus regions between replicates are plotted. (C) VC maintains pre-existing and induces de novo 5hmC-enriched regions. Pairwise comparisons between the three groups are shown. Numbers and percentages of regions are shown for each comparison. Colors indicate the 5hmC status of the regions. Number of 5hmC+ region in naïve B cells and B cells with or without VC treatment. (D) Visualization of 5hmC at differential regions between B cells from MockDay4 and VCDay4 groups. The 5hmC enrichment is plotted as heatmaps around (±3 kb) the differential and common regions between MockDay4 and VCDay4 (right panel of C). Normalized 5hmC counts are plotted as color scale, and each row represents a region.
Figure 7—figure supplement 1.
Figure 7—figure supplement 1.. Maintenance DNA methylation and 5hmC-mediated passive DNA demethylation.
(A) TET proteins oxidize 5mC into 5hmC, a stable epigenetic mark and an intermediate for DNA demethylation. (B) Maintenance DNA methylation. At a methylated CpG site, an unmodified cytosine was incorporated into the CpG motif on the complementary strand (middle). The hemi-methylated CpG motif is then recognized and the unmethylated cytosine is methylated by the maintenance methyltransferase I (DNMT1) and UHRF1 (right). (C) TET-mediated passive DNA demethylation. Unlike hemi-methylated CpG, the CpG with 5hmC is not recognized by DNMT1/UHRF1. As a result, the cytosine on the newly synthesized will not be methylated and thus resulting in the cell-division-dependent passive DNA demethylation (right). Note that, different from 5mC, 5hmC is not replicated onto the newly synthesized DNA and thus the percentage of 5hmC among all cytosine will decrease after cell division (e.g., Figure 7A, compare naïve vs. MockDay4). To generate new 5hmC, TET proteins are usually recruited by transcription factors (TFs) to specific elements/loci and oxidize the existing 5mC. In the absence of vitamin C (VC), the enzymatic activity of TET is restricted and thus results in diminished 5hmC generation (Figure 7A, compare MockDay4 vs. VCDay4).
Figure 7—figure supplement 2.
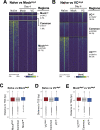
Figure 7—figure supplement 2.. Analyses of 5hmC-enriched regions.
(A, B) Heatmaps showing 5hmC enrichment at the differential and common regions between (A) naïve and MockDay4; (B) naïve and VCDay4. Data are plotted as described in Figure 7D. (C–E) Majority of 5hmC-enriched regions are distal elements. The distance between the indicated 5hmC regions and the closest transcriptional start sites (TSSs) is plotted. Note that the majority of the regions are at least 10 kb away from TSSs.
Figure 7—figure supplement 3.
Figure 7—figure supplement 3.. Enrichment of transcription factor (TF) motifs at differential 5hmC regions.
The enrichment of motifs was analyzed for the differential regions between MockDay4 and VCDay4 using HOMER. Common regions between the two groups are used as backgrounds for motif analysis. Motif enrichment for regions with (A) increased in 5hmC (VCUP) and (B) decreased in 5hmC (VCDown) in the presence of vitamin C (VC). Y-axis indicates the relative number (fold) of TF motifs in the differential regions compared to background regions. The size of the bubble indicates the percentage of all regions with the indicated TF motif (bottom). The bubble color indicates the statistical significance. Note that the scales are different for (A) and (B). Fold background at ×1.5 is marked by red dotted lines for comparison.
Figure 8.
Figure 8.. Vitamin C (VC) induced 5hmC modification and enhanced STAT3 binding at the Prdm1 locus.
(A) Genome browser tracks of the 5hmC enrichment at the Prdm1 locus (mm10 chr10:44,390,000–44,464,000). Data shown are the average of two biological replicates. The locations of E27 and E58 are shown above. (B) Differential 5hmC-enriched regions (DhmRs) between the indicated group as in Figure 7C. Colors indicate the differential status of the regions as depicted in the legend. (C) DNA methylation in naïve and 48 hr-activated B cells from previous publication (Lio et al., 2019; Kieffer-Kwon et al., 2013). The height of the black bars indicates the percentage of CpG methylation, and the red track (CpG) indicates the CpGs that were covered in the analysis. (D) VC enhanced STAT3 association at E27. B cells were cultured with or without VC for 4 days as in Figure 4 and treated with or without rmIL-21 (10 ng/mL) for 6 hr. STAT3 binding was analyzed by ChIP-seq. The signals on the genome browser tracks are the average from two biological replicates.
Figure 8—figure supplement 1.
Figure 8—figure supplement 1.. IL-21 induces STAT3 binding at E58 in T cells.
(A) Genome browser tracks showing the 5hmC enrichment at the Prdm1 locus (same data from Figure 8A) to show the peak locations. (B) Previous published STAT3 ChIP-seq tracks from CD4 T cells stimulated with or without IL-21 are shown (Kwon et al., 2009). The locations of E27 and E58 are depicted on top. Note that STAT3 binds to E58 in T cells but not in B cells from this study (Figure 8D).
Figure 9.
Figure 9.. Vitamin C (VC)-facilitated DNA demethylation at E27 is required for efficient STAT3 recruitment.
DNA methylation at E27 was analyzed using bisulfite amplicon sequencing with a Nanopore sequencer. Note that bisulfite sequencing is not able to distinguish 5mC and 5hmC, which usually represents a relatively minor fraction. (A) Differential DNA methylation region (DMR) at E27. The DNA methylation (5mC + 5hmC) levels were compared between control (MockDay4) and VC-treated B cells (VCDay4). The average DNA methylation ratio at each CpG from three samples is plotted as blue bars (left Y-axis), and the coverage depth from sequencing is plotted as a gray line (right Y-axis). The differential DMR is highlighted with red and CpGs are indicated as red dots. Previously identified STAT3 binding site is highlighted in green. n = 3 for each group. (B) VC induces TET-mediated DNA demethylation at E27 DMR. DNA methylation ratios at E27 DMR from indicated groups are shown. Statistical significance was analyzed using a Bayesian hierarchical model with Wald test (Park and Wu, 2016). WT, n = 3; Tet2/3-DKO, n = 2. (C) TET2 and TET3 are required for the VC-facilitated STAT3 binding to E27. STAT3 binding to E27 was analyzed using ChIP-qPCR. Specific signal from E27 was normalized to the input and then with a background region (‘Materials and methods’). Representative data from one of two experiments are shown (three technical replicates for each group). Statistical significance was calculated using two-way ANOVA, and the relevant comparisons are shown. ***p<0.001, **p<0.01. ns, not significant.
Figure 9—figure supplement 1.
Figure 9—figure supplement 1.. DNA methylation levels at the Prdm1 locus.
(A–C) DNA methylation ratios at (A) E27 non-DMR (5′), (B) E58, and (C) promoter are shown as in Figure 9B. WT, n = 3; Tet2/3-DKO, n = 2.
Figure 9—figure supplement 2.
Figure 9—figure supplement 2.. DNA sequence analysis of E27 differentially methylated region (DMR).
(A) DNA sequence of mouse Prdm1 E27 DMR. CpGs are labeled in blue. STAT3 binding site and the conserved CpGs between mouse and human are highlighted in gray. (B) An element at the 3′ of human PRDM1 with similarity to mouse Prdm1 E27. Note that the sequence shown is from the complementary strand of the reference genome. CpGs are labeled in red. The putative STAT3 binding site and the conserved CpGs are highlighted in gray. (C) Sequence alignment between the elements from mouse Prdm1 and human PRDM1. The sequences from (A) and (B) are aligned with BLAST. Bars indicate identical nucleotides. STAT3 motifs and conserved CpGs are highlighted.
Figure 10.
Figure 10.. Model for vitamin C (VC)-enhanced plasma cell differentiation.
During plasma cell differentiation, TET2 and/or TET3 is recruited to the enhancers of Prdm1. In the presence of sufficient VC, TET proteins have a higher enzymatic activity and efficiently oxidize 5mC into 5hmC at certain cis elements, which we termed ‘ascorbate-responsive element’ or EAR. The oxidation and demethylation of 5mC at some EAR may increase the association of transcription factors (TFs), such as STAT3 to E27. However, when VC is limited, the decreased TET activity resulted in an inefficient oxidation of 5mC, which may preclude the binding of TF and/or the maintenance of the association between DNA and nucleosome (not depicted). Therefore, the activity of epigenetic enzyme may reflect the availability of micronutrients or metabolites and may influence gene expression and cell fate decisions.
Author response image 1.
Author response image 1.. The responses of human B cells to VC vary among individuals.
(A) Stimulated with CpG (ODN) anti-CD40 and IL-21; (B) Stimulated with SAC and IL-21. (Corresponding to Figure 1F and 1G).
Author response image 2.
Author response image 2.. VC mediated 5hmC-modification at Xbp1 and Irf4 loci.
Genome browser tracks of the 5hmC enrichment at Xbp1 and Irf4 loci (mm10). Top panels: VC enhanced STAT3 association at Xbp1 and Irf4. B cells were cultured with or without VC for 4 days as in Figure 4 and treated with or without rmIL-21 (10 ng/mL) for 6h. STAT3 binding was analyzed by ChIPseq. The signals on the genome browser tracks are the average from two biological replicates. Data shown are the average of two biological replicates. Middle panels: 5hmC distribution in naïve B cells (Naïve), day 4 activated control B cells (MockDay4), and VCtreated B cells (VCDay4). Data shown are the average of two biological replicates.Bottom panel: Differential 5hmC-enriched regions (DhmRs) between the indicated group as in Figure 7C. Colors indicate the differential status of the regions as depicted in the legend.

References

    1. Allan GM, Arroll B. Prevention and treatment of the common cold: making sense of the evidence. CMAJ. 2014;186:190–199. doi: 10.1503/cmaj.121442. - DOI - PMC - PubMed
    1. Anderson R, Oosthuizen R, Maritz R, Theron A, Van Rensburg AJ. The effects of increasing weekly doses of ascorbate on certain cellular and humoral immune functions in normal volunteers. The American Journal of Clinical Nutrition. 1980;33:71–76. doi: 10.1093/ajcn/33.1.71. - DOI - PubMed
    1. Baron JH. Sailors’ scurvy before and after james lind--a reassessment. Nutrition Reviews. 2009;67:315–332. doi: 10.1111/j.1753-4887.2009.00205.x. - DOI - PubMed
    1. Barwick BG, Scharer CD, Bally APR, Boss JM. Plasma cell differentiation is coupled to division-dependent DNA hypomethylation and gene regulation. Nature Immunology. 2016;17:1216–1225. doi: 10.1038/ni.3519. - DOI - PMC - PubMed
    1. Blaschke K, Ebata KT, Karimi MM, Zepeda-Martínez JA, Goyal P, Mahapatra S, Tam A, Laird DJ, Hirst M, Rao A, Lorincz MC, Ramalho-Santos M. Vitamin C induces tet-dependent DNA demethylation and a blastocyst-like state in ES cells. Nature. 2013;500:222–226. doi: 10.1038/nature12362. - DOI - PMC - PubMed

Publication types

Associated data