. 2022 Nov 7;219(11):e20220504.
doi: 10.1084/jem.20220504. Epub 2022 Sep 7.

GPX4 regulates cellular necrosis and host resistance in Mycobacterium tuberculosis infection

Affiliations

GPX4 regulates cellular necrosis and host resistance in Mycobacterium tuberculosis infection

Eduardo P Amaral et al. J Exp Med. .

Abstract

Cellular necrosis during Mycobacterium tuberculosis (Mtb) infection promotes both immunopathology and bacterial dissemination. Glutathione peroxidase-4 (Gpx4) is an enzyme that plays a critical role in preventing iron-dependent lipid peroxidation-mediated cell death (ferroptosis), a process previously implicated in the necrotic pathology seen in Mtb-infected mice. Here, we document altered GPX4 expression, glutathione levels, and lipid peroxidation in patients with active tuberculosis and assess the role of this pathway in mice genetically deficient in or overexpressing Gpx4. We found that Gpx4-deficient mice infected with Mtb display substantially increased lung necrosis and bacterial burdens, while transgenic mice overexpressing the enzyme show decreased bacterial loads and necrosis. Moreover, Gpx4-deficient macrophages exhibited enhanced necrosis upon Mtb infection in vitro, an outcome suppressed by the lipid peroxidation inhibitor, ferrostatin-1. These findings provide support for the role of ferroptosis in Mtb-induced necrosis and implicate the Gpx4/GSH axis as a target for host-directed therapy of tuberculosis.


Conflict of interest statement

Disclosures: The authors declare no competing interests exist.

Figures

None
Graphical abstract
Figure S1.
Figure S1.
Evaluation of lipid peroxidation in samples obtained from pulmonary TB patients (South African cohort) and in vitro levels of lipid peroxidation and glutathione in cultures of human monocyte-derived macrophages following Mtb infection. (A) Lipid peroxidation as measured by MDA levels was assessed in plasma from HC (QuantiFERON-TB [QFT] negative; n = 19) and PTB (QFT positive; n = 32) HIV negative patients. (B) LAA staining in total peripheral blood monocytes (Live/DUMP-/HLADR+) from LTBI and PTB patients. Each symbol represents an individual patient. (A and B) Data represent median values and interquartile ranges. The Mann-Whitney U test was used to compare the significance of the HC versus PTB values or LTBI versus PTB as indicated. (C and D) Primary human monocyte-derived macrophages were infected with H37Rv (MOI of 5) or exposed to irradiated Mtb (100 μg/ml). Intracellular GSH (C) and MDA (D) levels were assessed at indicated time-points p.i. as described in the Materials and methods. The data represent means ± SEM of triplicate samples and are representative of three independent experiments. Statistical significance was assessed by one-way ANOVA. Significant differences are indicated with asterisks (**, P < 0.01; ***, P < 0.001; ****, P < 0.0001).
Figure 1.
Figure 1.
Dysregulated GSH/GPX4 response and lipid peroxidation in patients with pulmonary TB. (A–G) Cryopreserved heparinized plasma samples collected from PTB (n = 30) and HCs (n = 20) from Salvador, Brazil were used in this study. Plasma levels of GSH (A) and lipid peroxidation (MDA; B) were measured using the enzyme-based assays described in the Materials and methods. Data represent median values and interquartile ranges. The Mann–Whitney U test was used to compare the significance of the HC versus PTB values. Each symbol represents an individual subject within the group. (C) Correlation between plasma levels of GSH and MDA in HC and PTB for the samples shown in A and B (Spearman correlation test). (D and E) GSH and MDA levels in plasma from PTB patients displaying severe (n = 12) versus non-severe disease (n = 18) as defined in the Materials and methods (D) as well as in subjects with unilateral (n = 15) versus bilateral (n = 15) lung pathology (E). (F and G) Principal component analysis demonstrating three-way association between GSH and MDA levels measured in PTB patients on the basis of disease severity (F) or lung pathology (G). (H) GPX4 mRNA expression in CD14+ monocytes isolated from PTB patients and stratified based on lung disease extension, presence of cavitation or AFB smear grade. Data represent median values and interquartile ranges. The Mann–Whitney U test was used to compare values between patient groups. Each symbol represents an individual subject within the group. (I) Immunohistochemical staining for CD68 (upper panel) and GPX4 (lower panel) of a post-mortem lung tissue section from a Brazilian PTB patient. The black dashed lines in the image delineate the area surrounding the necrotic core of a granuloma, with the red arrow indicating stronger staining for Gpx4 (scale bars, 100 μm). Statistical significance was assessed by the Mann–Whitney test (for two groups) or Kruskal–Wallis with Dunn’s multiple comparisons or linear trend post-hoc tests (for more than two groups). Significant differences are indicated with asterisks (*, P < 0.05; **, P < 0.01; ***, P < 0.001; ****, P < 0.0001).
Figure 2.
Figure 2.
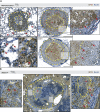
Spatial distribution of Gpx4 expression in granulomatous lung tissue from Mtb-infected rhesus macaques and B6.Sst1s mice. (A) Representative pulmonary tissue sections from two rhesus macaques (ID# DG4H and DGRI) infected with H37Rv-mCherry (∼50 CFU) for 16 wk obtained from a previous study (Kauffman et al., 2021) and stained for GPX4. The upper left panel shows a cellular granuloma (delineated by a yellow dashed line), with the myeloid cell enriched center of the granuloma indicated by a yellow asterisk. Red arrows on the upper and lower left panels point out the stronger staining for GPX4 in cells resembling alveolar macrophages compared to other cells. The right panels (upper and bottom) show necrotic granulomas (delineated by a yellow dashed line) from independent animals with the necrotic core outlined by a yellow dashed line and highlighted by a red asterisk (scale bars, 500 μm). Inserts display areas with strong GPX4 staining in live cells as indicated by red arrows. (B) Representative lung tissue sections from a B6.Sst1S mouse aerosol infected with H37Rv Mtb strain (∼100 CFU) and euthanized 35 d later. The sections were stained for Gpx4. Yellow dashed lines delineate the granuloma in the middle image, and the red asterisk indicates the necrotic area within the lesion. As shown, strong staining for Gpx4 was observed in cells located at the periphery of the granuloma as well as those situated in the tissue space surrounding this structure. In the right insert, red arrows point out the stronger staining for Gpx4 in live cells that it is absent in areas displaying necrotic cell debris demarcated by a yellow dashed line. The images shown are representative of those observed in five individual animals from two experiments performed (scale bars, 500 μm).
Figure S2.
Figure S2.
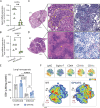
Gpx4 expression in lungs of C3HeB/FeJ mice, enhanced necrotic cell death in lungs of Mtb-infected cre-ERT2+Gpx4fl/fl, and tSNE analysis of the myeloid compartment as well as glutathione levels in the lungs of GPX4TG mice infected with Mtb. (A and B) RNAseq data from an available data set previously published by Moreira-Teixeira et al. (2021) were re-analyzed to assess Gpx4 mRNA levels in different experimental settings. In that study, C3HeB/FeJ mice were aerosol infected with a virulent H37Rv Mtb (A) or a hypervirulent clinical isolate HN878 Mtb strain at low dose (∼100 CFU; B) and RNAseq analysis performed in lung homogenates at 42 and 35 d p.i., respectively. Each symbol represents an individual animal within the group. (C and D) H&E and ZN staining of lung sections from the two outlier cre-ERT2+Gpx4fl/fl mice #1 and #2 shown in the graph on Fig. 3, E and F (scale bars [lower magnification], 500 μm). Lungs from animal #1 in A displayed reduced areas of cellular infiltration compared with mouse #2 in D. Necrotic cell death area is delineated by a yellow dashed line (C) and indicated with yellow asterisks. Numerous AFB (red) are evident in the lungs of both animals (scale bars [higher magnification], 20 μm). (E and F) WT and GPX4TG mice were infected as described in the legend of Fig. 3. (E) Glutathione levels in lung homogenates from WT and GPX4TG mice at 28 d p.i. were measured. Each symbol represents an individual animal. (F) tSNE analysis of the FACS-stained myeloid cells in the lungs of Mtb infected mice. Proportional events from each animal were concatenated (n = 5 each group). AMs (red gate) and IMs (black gate) are indicated. Data shown are representative of one of three separate experiments performed. Statistical significance was assessed by the Mann–Whitney test. Significant differences are indicated with asterisks (*, P < 0.05; **, P < 0.01; ****, P < 0.0001).
Figure 3.
Figure 3.
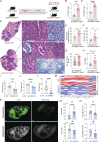
Alterations in global expression of Gpx4 regulate host resistance to Mtb infection. (A–H) Gpx4fl/fl (used as control animals) and cre-ERT2+Gpx4fl/fl mice treated with tamoxifen were infected by aerosol inoculation with ∼100 bacilli of Mtb (H37Rv). Results are representative of two separate experiments performed for each analysis. (A) Scheme of tamoxifen administration. Tamoxifen (2 mg/animal) was given to mice daily via i.p. injections for 5 d. Animals were then rested for 7 d before Mtb infection. (B–H) At 28 d p.i., mice were euthanized and lungs and spleens were harvested. Pulmonary (B) and splenic (C) bacterial loads in Mtb-infected mice. (D) Representative H&E and ZN images of lungs isolated from Gpx4fl/fl (upper panel) and cre-ERT2+Gpx4fl/fl mice (lower panel; scale bars [lower magnification], 500 μm). Each image is representative of tissue sections from five individual mice per experiment. Extensive necrotic lesions (dashed line and asterisk) with intrabronchial accumulation of necrotic cellular material along with elevated numbers of AFB were present in the lungs of cre-ERT2+Gpx4fl/fl mice. On the lower ZN panel, wide-spread necrosis with numerous Mtb was evident in the lungs of cre-ERT2+Gpx4fl/fl mice (scale bars, 20 μm). (E and F) Parenchymal enlargement (E) and TB lesion (F) areas as measured in the lung sections. (G) Number of AFB per cell in lung sections assessed by microscopy. (H) Lipid peroxidation in live CD11b+ cell subset in the lungs analyzed by flow cytometry. (I–O) C57BL/6 (WT) and Gpx4-overexpressing (GPX4TG) mice were infected by intrapharyngeal inoculation with ∼1,000–1,500 bacilli of Mtb (H37Rv) as a model of severe TB and the animals sacrificed at 28 d p.i. (I and J) Bacterial burdens in the lungs (I) and spleens (J). Data shown are representative of one of five separate experiments performed. (K) Lung necrosis evaluated by SytoxGreen DNA staining. (L) Mean fluorescence intensity (MFI) of SytoxGreen staining per area of whole lung samples (n = 8–10). Data are representative of one of three separate experiments performed (scale bars, 800 μm). (M) Heatmap visualization of 10 cytokines measured by multiplex in lung homogenates from WT and GPX4TG mice. Data shown are pooled from three independent experiments. (N and O) Cell numbers (N) and lipid peroxidation levels (LAA; O) in AMs (CD45+/DUMP/Ly6G/CD24/low/IA-IE+/CD45ivneg/CD64+/CD11b−/low/CD11c+/Siglec-F+) and IMs (CD45+/DUMP/Ly6G/CD24−/low/IA-IE+/CD45ivneg/CD64+/CD11bhi/CD11c−/low/Siglec-F) analyzed by flow cytometry. The data shown are pooled results from two independent experiments. The data shown in A–O represent the means ± SEM of samples. (B, C, E–J, and L–O) Statistical significance was assessed by the Mann–Whitney test and significant differences are indicated with asterisks (*, P < 0.05; **, P < 0.01; ***, P < 0.001; ****, P < 0.0001).
Figure 4.
Figure 4.
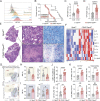
Deficiency of Gpx4 expression in the hematopoietic compartment enhances host susceptibility to Mtb infection. (A) Gpx4 expression in different hematopoietic cell types was analyzed by flow cytometry in the lungs of uninfected WT mice. (B–K) Gpx4fl/fl and CD45creGpx4fl/fl mice were infected via aerosol with ∼100–200 bacilli of virulent Mtb H37Rv strain. (C–K) Mice were euthanized at 50–55 d p.i. and lungs and spleens were harvested and analyzed. (B) Survival curves of Mtb-infected Gpx4fl/fl and CD45creGpx4fl/fl mice. Statistical significance was assessed by Mantel–Cox test. (C and D) Bacterial loads in the lungs (C) and spleens (D) were determined. (E) Representative H&E (left panel) and ZN (right panel) images of lungs from Gpx4fl/fl (upper panel) and CD45creGpx4fl/fl mice (bottom panel; scale bars [lower magnification], 500 μm). Each image is a composite of sections from four to five individual mice in each group per experiment (three independent experiments; scale bars [higher magnification), 20 μm; 50 μm [bottom left panel]). Massive necrotic tissue damage (asterisk) was observed in the lungs of CD45creGpx4fl/fl mice together with the presence of higher numbers of Mtb (red). Fewer and more isolated AFB (red arrow) were found in the lungs of Mtb-infected Gpx4fl/fl animals. (F) Heatmap visualization of 10 cytokines measured in lung homogenates from Gpx4fl/fl and CD45creGpx4fl/fl mice. Data shown are pooled from four independent experiments (each column represents an individual animal). (G–K) Flow cytometric analysis was performed on single-cell suspension from lungs of Mtb-infected Gpx4fl/fl and CD45creGpx4fl/fl mice. (G) Sample FACS plot of parenchymal macrophages. (H and I) Summary data of frequency and cell numbers of AM (H) and IM (I). (J) Frequency and numbers of Ly6G+ cells in the lung. (K) Lipid peroxidation (LAA staining) in different myeloid cells in the lungs. Pooled results of three independent experiments are shown (n = 12 each group). The data shown in A–O represent the means ± SEM of samples. (B–D and F–K) Statistical significance was assessed by the Mann–Whitney test and significant differences are indicated with asterisks (*, P < 0.05; **, P < 0.01; ***, P < 0.001; ****, P < 0.0001).
Figure S3.
Figure S3.
Gpx4 deficiency does not affect numbers of myeloid cells in the lungs of CD45creGpx4fl/fl, LysMcreGpx4fl/fl, and Gpx4fl/fl mice at baseline. (A and B) Total numbers of AMs (Live+CD45+DUMPLy6GIA-IE+CD24−/lowCD45ivnegCD64+CD11c+SiglecF+), IMs (Live+CD45+DUMPLy6GIA-IE+CD24−/lowCD45ivnegCD64+CD11b+SiglecF), and neutrophils (Live+CD45+DUMPCD11b+Ly6G+) in the lungs of uninfected Gpx4fl/fl (A and B), CD45creGpx4fl/fl (A), and LysMcreGpx4fl/fl (B) mice as measured by flow cytometry. Results are pooled from of two independent experiments performed (n = 6 each group). Statistical significance was assessed by the Mann-Whitney test.
Figure S4.
Figure S4.
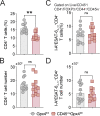
Gpx4-deficiency does not affect frequency or number of ESAT-6specific CD4+ T cells. (A–D) Gpx4fl/fl and CD45creGpx4fl/fl mice were infected via aerosol with ∼100 bacilli of virulent Mtb H37Rv strain and parenchymal CD4+ T cells were analyzed at 50–55 d p.i. (A and B) Total CD4+ T cell frequency (A) and numbers (B) were determined. (C and D) I-AbESAT-64-17+CD4+ T cell frequency (C) and numbers (D) were analyzed. Results are pooled from of three independent experiments performed (n = 12 each group). Significant differences are indicated with asterisks and statistical significance was assessed by the Mann–Whitney test (**, P < 0.01).
Figure 5.
Figure 5.
Gpx4 expression is important for macrophage resistance to Mtb infection in vivo. (A–M) Gpx4fl/fl, LysMcreGpx4fl/fl, and Mrp8creGpx4fl/fl mice were infected via aerosol with ∼100 CFU of virulent Mtb H37Rv. (B–K) Mice were euthanized at 120 d p.i. and lungs and spleens were harvested for analysis. (A) Survival curves of Mtb-infected Gpx4fl/fl (n = 44) and LysMcreGpx4fl/fl mice (n = 44). Data were pooled from five experiments. Statistical significance was assessed by Mantel–Cox test. (B) CFUs determined at day 120 p.i. by plating lung and spleen homogenates onto 7H11 agar plates. Results are pooled from two separate experiments performed. (C) Representative ZN images of lungs from Gpx4fl/fl (left panel) and LysMcreGpx4fl/fl mice (right panel; scale bars, 20 μm). Each image is representative of sections from four to five individual mice per group (two independent experiments). AFB inside macrophages are indicated with red arrows. (D–H) Flow cytometric analysis performed on single-cell suspension from lungs of Mtb-infected Gpx4fl/fl and LysMcreGpx4fl/fl mice. (D) Sample FACS plot of parenchymal macrophages gated on Live+CD45+DUMPLy6GIA-IE+CD24−/lowCD45ivnegCD64+ events. (E and F) Summary data of frequency and cell numbers of AM (E) and IM (F). (G) Lipid peroxidation (LAA staining) of the live IM population. (H) Numbers of dead IMs. (I) Frequency and numbers of Ly6G+ cells (neutrophils) in the lung. (J) LAA staining of live Ly6G+ cells. (K) Numbers of dead neutrophils. (D–H) Pooled data from two independent experiments were performed (n = 9–11 each group). (L) Survival curves of Mtb-infected Gpx4fl/fl (n = 13) and Mrp8creGpx4fl/fl mice (n = 12). Statistical significance was assessed by Mantel–Cox test. (M) Bacterial loads in the lungs and spleens at 30 d p.i. Pooled data from two independent experiments performed (n = 14–15). The results shown in A–M are the means ± SEM of data from individual mice within each group. (B, E–K, and M) Statistical significance was assessed by the Mann–Whitney test. Significant differences are indicated with asterisks (*, P < 0.05; **, P < 0.01; ***, P < 0.001; ****, P < 0.0001).
Figure 6.
Figure 6.
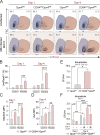
Gpx4 deficiency Gpx4 triggers lipid peroxidation–dependent necrosis and loss of bacterial control in Mtb-infected macrophages in vitro. (A–I) Gpx4fl/fl, LysMcreGpx4fl/fl, and (G–I) CD64creGpx4fl/fl BMDMs were infected with H37Rv Mtb at different MOIs as indicated. (A) Sample FACS plots demonstrating Mtb-induced macrophage necrosis in vitro as measured by Live/Dead staining on the x axis at day 1 versus 4 p.i. (B) Summary graph of data shown in A presenting the means ± SEM of triplicate samples analyzed. (C) Mitochondrial superoxide was evaluated by MitoSOX staining and analyzed by flow cytometry at 24 h p.i. Results are representative of three separate experiments performed. (D) Lipid peroxidation levels in live CD11b+ cells were assessed by LAA staining and analyzed by flow cytometry. Representative data from one of at least three independent experiments are shown. (E) Extracellular CFU as a readout of bacterial spread was quantified in supernatants from macrophage cultures exposed to Mtb at an MOI of 5. (F) Mycobacterial burden evaluated by counting intracellular CFU in macrophage cultures infected at an MOI of 1 on day 0 and 4 p.i. treated or not with Fer-1 (10 μM). Representative data from one of three independent experiments are shown. (G–I) Gpx4fl/fl, LysMcreGpx4fl/fl, and CD64creGpx4fl/fl BMDMs were infected with H37Rv Mtb at an MOI of 5 and treated or not with the lipid peroxidation inhibitor Fer-1. Necrotic cell death was assessed on day 4 p.i. Results are representative of at least two independent experiments. (G) Representative image of Mtb-infected macrophage cultures untreated (left) or treated (right) with Fer-1 (10 μM) on day 4 p.i. (20× magnification; scale bars, 50 μm). Black arrows point out examples of dead cells in the cultures of macrophages treated of not with Fer-1. (H) FACS plots of macrophage cultures evaluating cellular necrosis in vitro as measured by Live/Dead staining at day 4 p.i. and analyzed by flow cytometry. (I) Summary graph of results shown in H. The data shown in A–I represent the means ± SEM of triplicate samples. Statistical significance was assessed by one-way ANOVA or the Mann–Whitney t test analysis for the indicated experimental conditions. Asterisks indicate the statistical differences observed (*, P < 0.05; **, P < 0.01; ***, P < 0.001; ****, P < 0.0001).
Figure S5.
Figure S5.
Ablation of Gpx4 expression in CD64-expressing macrophages increases host cell susceptibility to Mtb infection in vitro. (A–F) Gpx4fl/fl and CD64creGpx4fl/fl BMDMs were infected with H37Rv-RFP Mtb at different MOIs as indicated. (A) FACS plots demonstrating Mtb-induced macrophages undergoing necrosis in vitro as measured by Live/Dead staining at day 1 versus 4 p.i. (B) Summary graph of data shown in A presenting the means ± SEM of triplicate samples analyzed. (C and D) Mitochondrial superoxide at 24 h p.i. (C) and lipid peroxidation at 4 d p.i. (D) were evaluated by flow cytometry. (E) Extracellular numbers of live Mtb were quantified in supernatants of macrophages infected with H37Rv Mtb at an MOI of 5 on day 4 p.i. (F) Intracellular bacterial growth was determined by counting CFU in macrophages infected with H37Rv Mtb at an MOI of 1 on day 0 and 4 p.i. treated or not with Fer-1 (10 μM). The data represent the means ± SEM of samples in triplicate. Statistical significance was assessed by one-way ANOVA or the Mann–Whitney t test analysis for the indicated experimental conditions. Results are representative of at least two independent experiments. Asterisks indicate the statistical differences observed (*, P < 0.05; **, P < 0.01; ***, P < 0.001; ****, P < 0.0001).

References

    1. Amaral, E.P., Conceicao E.L., Costa D.L., Rocha M.S., Marinho J.M., Cordeiro-Santos M., D’Imperio-Lima M.R., Barbosa T., Sher A., and Andrade B.B.. 2016. N-acetyl-cysteine exhibits potent anti-mycobacterial activity in addition to its known anti-oxidative functions. BMC Microbiol. 16:251. 10.1186/s12866-016-0872-7 - DOI - PMC - PubMed
    1. Amaral, E.P., Costa D.L., Namasivayam S., Riteau N., Kamenyeva O., Mittereder L., Mayer-Barber K.D., Andrade B.B., and Sher A.. 2019. A major role for ferroptosis in Mycobacterium tuberculosis-induced cell death and tissue necrosis. J. Exp. Med. 216:556–570. 10.1084/jem.20181776 - DOI - PMC - PubMed
    1. Amaral, E.P., and Namasivayam S.. 2021. Emerging role for ferroptosis in infectious diseases. Adv. Exp. Med. Biol. 1301:59–79. 10.1007/978-3-030-62026-4_5 - DOI - PubMed
    1. Amaral, E.P., Vinhaes C.L., Oliveira-de-Souza D., Nogueira B., Akrami K.M., and Andrade B.B.. 2021. The interplay between systemic inflammation, oxidative stress, and tissue remodeling in tuberculosis. Antioxid. Redox Signal. 34:471–485. 10.1089/ars.2020.8124 - DOI - PMC - PubMed
    1. Andrade, B.B., Pavan Kumar N., Mayer-Barber K.D., Barber D.L., Sridhar R., Rekha V.V.B., Jawahar M.S., Nutman T.B., Sher A., and Babu S.. 2013. Plasma heme oxygenase-1 levels distinguish latent or successfully treated human tuberculosis from active disease. PLoS One. 8:e62618. 10.1371/journal.pone.0062618 - DOI - PMC - PubMed

Publication types

Substances