. 2022 Oct 3;154(10):e202213084.
doi: 10.1085/jgp.202213084. Epub 2022 Sep 7.

Piezo1 regulates cholesterol biosynthesis to influence neural stem cell fate during brain development

Affiliations

Piezo1 regulates cholesterol biosynthesis to influence neural stem cell fate during brain development

Jamison L Nourse et al. J Gen Physiol. .

Abstract

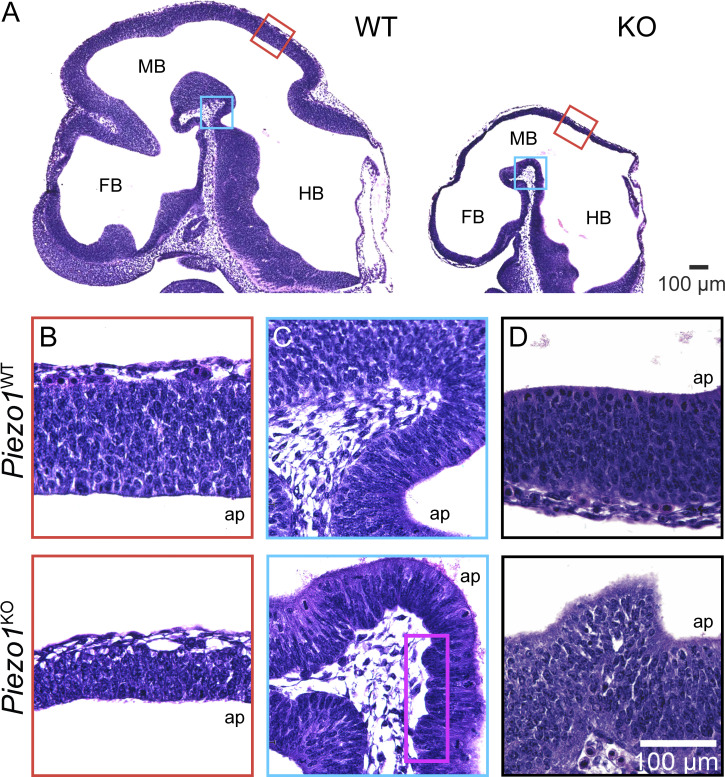
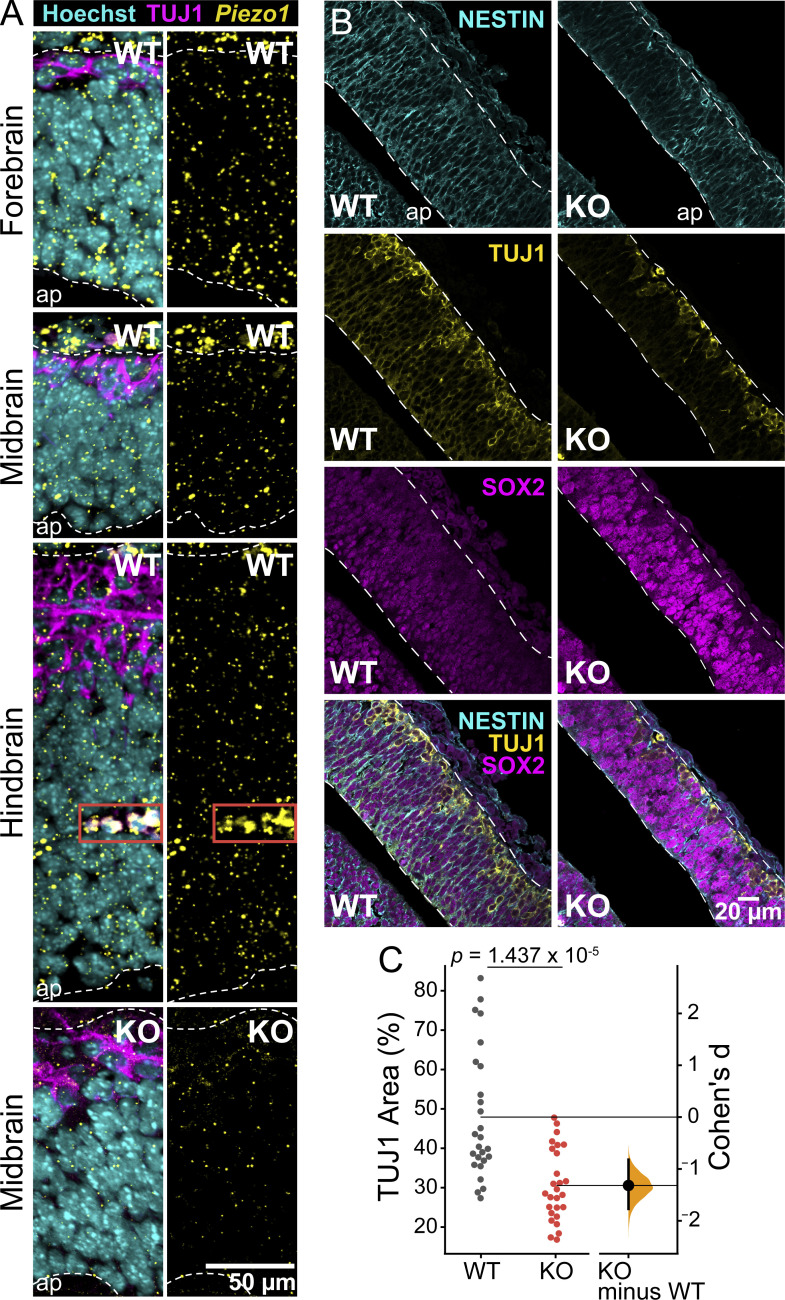
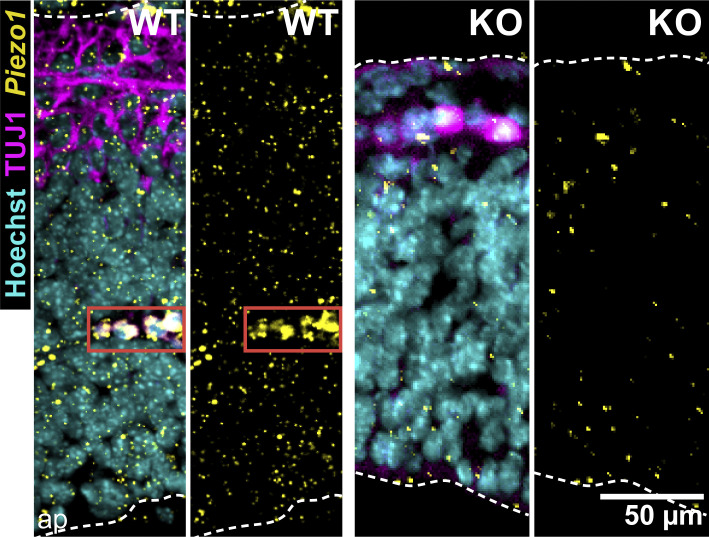
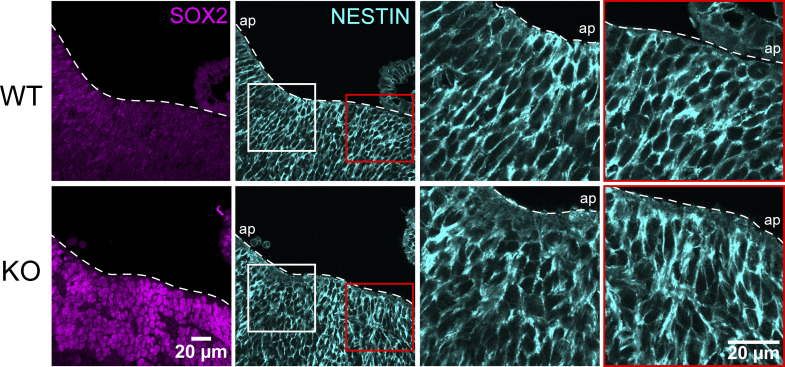
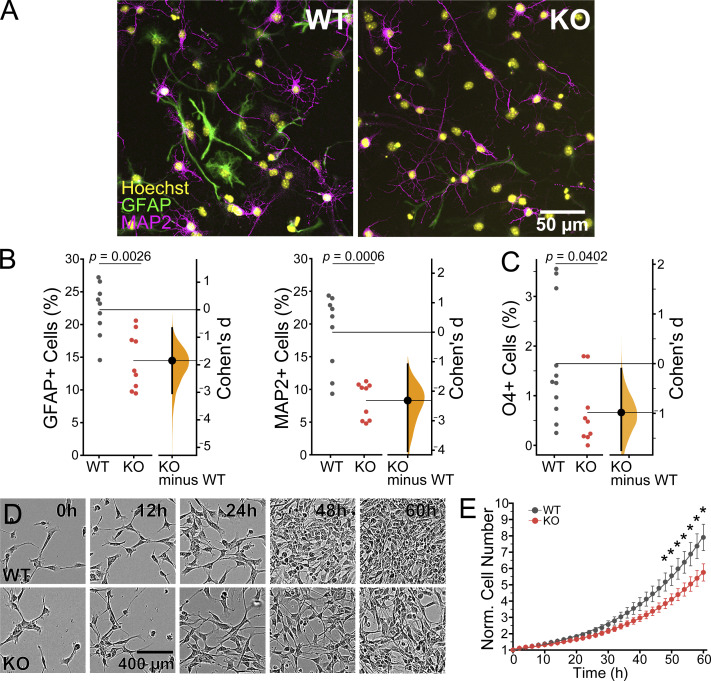
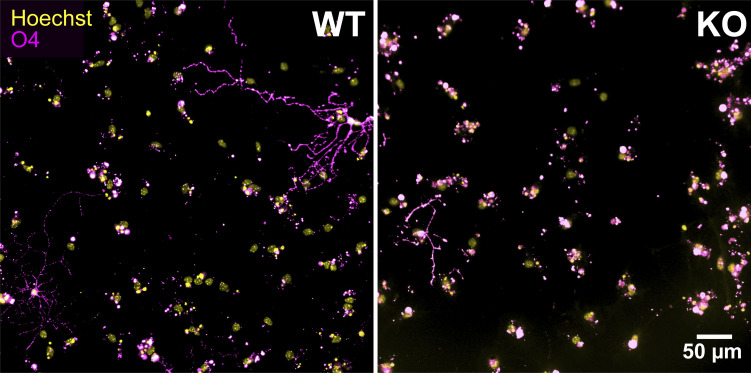
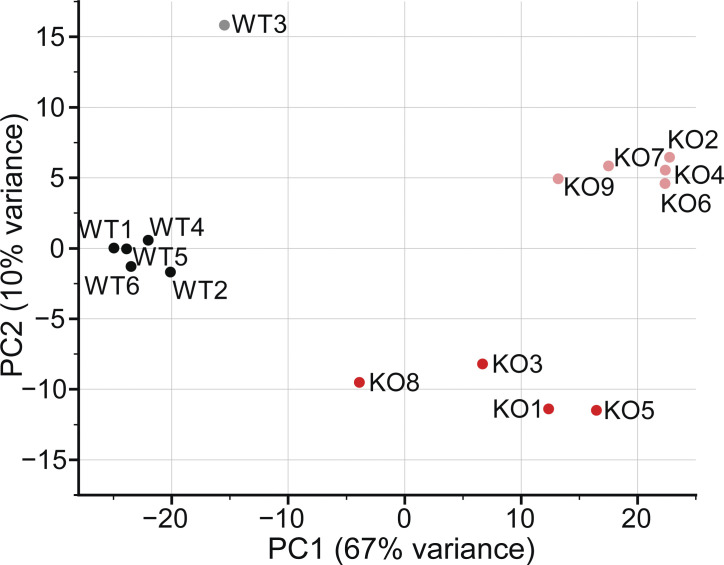
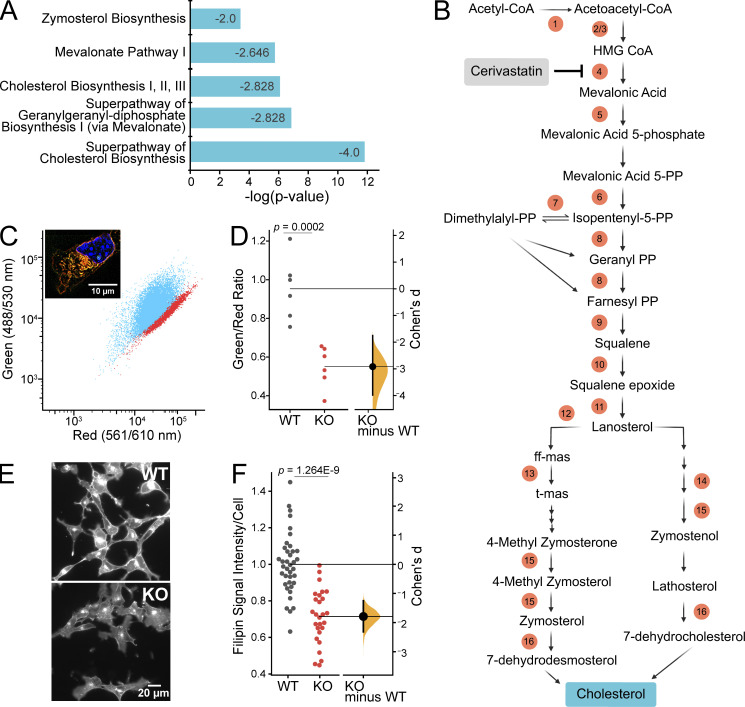
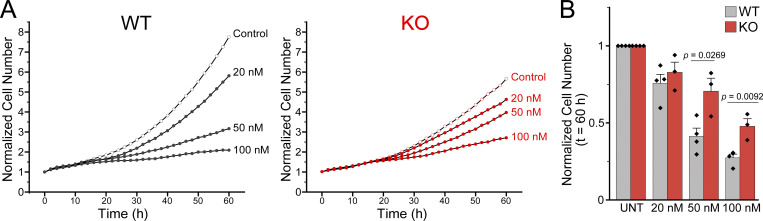
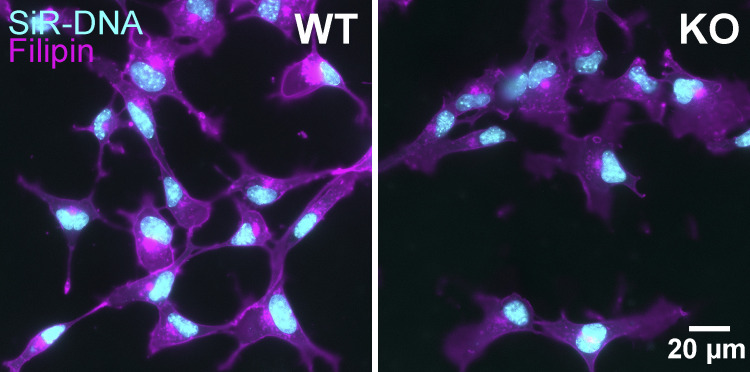
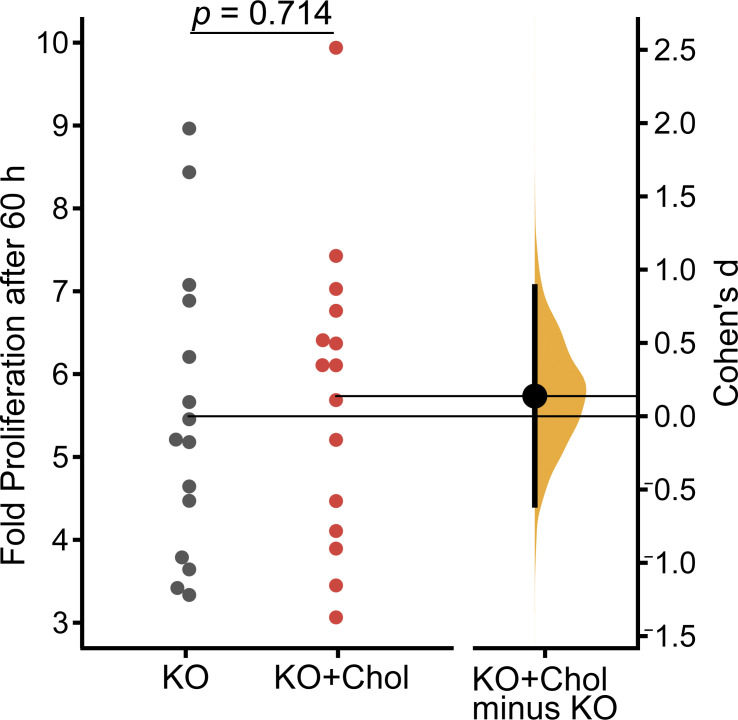
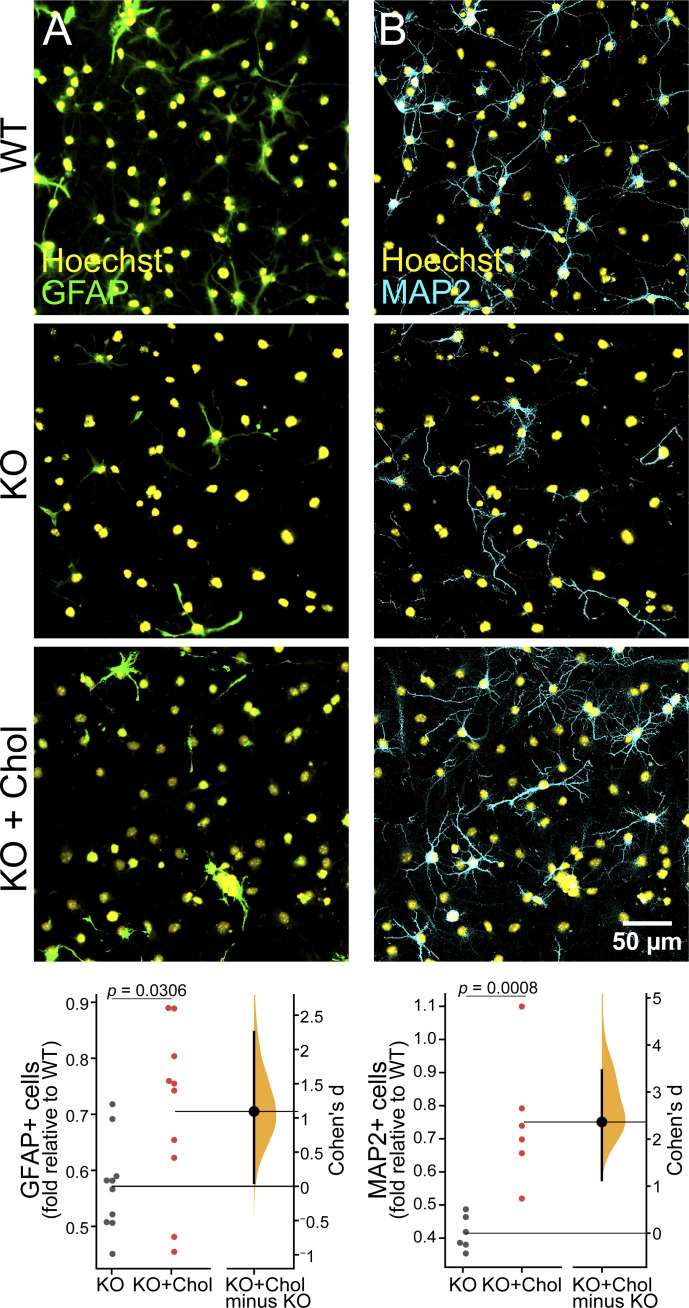
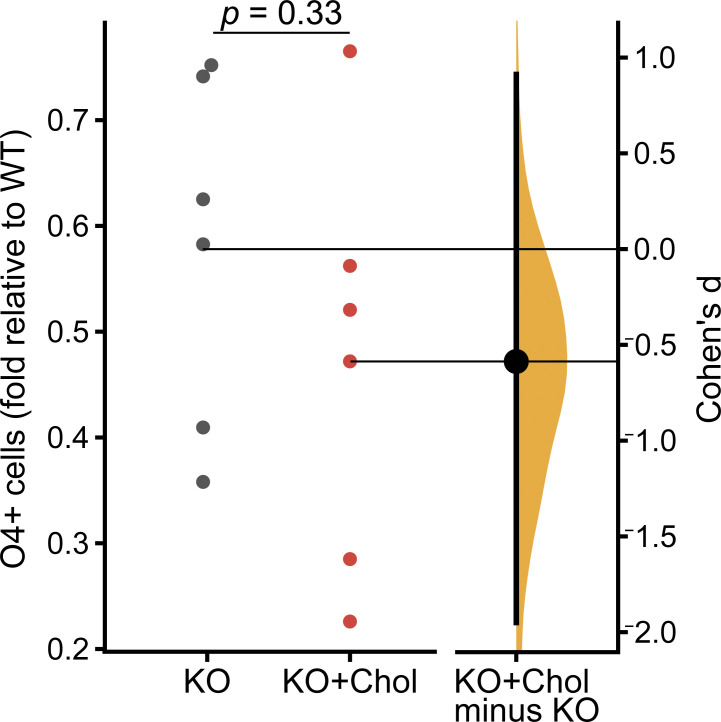
Mechanical forces and tissue mechanics influence the morphology of the developing brain, but the underlying molecular mechanisms have been elusive. Here, we examine the role of mechanotransduction in brain development by focusing on Piezo1, a mechanically activated ion channel. We find that Piezo1 deletion results in a thinner neuroepithelial layer, disrupts pseudostratification, and reduces neurogenesis in E10.5 mouse embryos. Proliferation and differentiation of Piezo1 knockout (KO) mouse neural stem cells (NSCs) isolated from E10.5 embryos are reduced in vitro compared to littermate WT NSCs. Transcriptome analysis of E10.5 Piezo1 KO brains reveals downregulation of the cholesterol biosynthesis superpathway, in which 16 genes, including Hmgcr, the gene encoding the rate-limiting enzyme of the cholesterol biosynthesis pathway, are downregulated by 1.5-fold or more. Consistent with this finding, membrane lipid composition is altered, and the cholesterol levels are reduced in Piezo1 KO NSCs. Cholesterol supplementation of Piezo1 KO NSCs partially rescues the phenotype in vitro. These findings demonstrate a role for Piezo1 in the neurodevelopmental process that modulates the quantity, quality, and organization of cells by influencing cellular cholesterol metabolism. Our study establishes a direct link in NSCs between PIEZO1, intracellular cholesterol levels, and neural development.


Figures

Figure 1.
Figure 1.
Histological analysis reveals abnormalities in the developing brain of Piezo1 KO mutant mice. (A) Representative H&E stains of E10.5 WT (left) and Piezo1 KO (right) littermate embryo sections. FB, forebrain; MB, midbrain; HB, hindbrain. Regions marked by red and blue boxes are shown at higher magnification in B and C. (B–D) Representative images highlighting differences in neuroepithelial thickness (B), inner/apical and outer/basal border morphology (C and D), and pseudostratified layering (D) between E10.5 WT (top row) and Piezo1 KO (bottom row) littermates. Purple box in C highlights the abnormal undulations at the basal border in the mutant. Images in A–D are representative of n = 7 embryos for WT and for Piezo1 KO. Scale bar in D also applies to B and C.
Figure 2.
Figure 2.
Lack of Piezo1 expression reduces differentiation in vivo. (A) Fluorescent ISH of Piezo1 mRNA in the E10.5 mouse brain. Representative ISH images of WT embryo sections for the forebrain, midbrain, and hindbrain regions shown in top three panels, and Piezo1 KO mutant (midbrain) shown in the bottom panel. Piezo1 mRNA signal shown in yellow, TUJ1 antibody staining of neurons shown in magenta, and Hoechst-stained nuclei in cyan. The white dashed lines demarcate the neuroepithelium, and the red solid box highlights a blood vessel; ap, apical/ventricular border. Images are representative of n = 3 embryos for WT and n = 2 embryos for Piezo1 KO. (B) Representative WT and Piezo1 KO midbrain regions from embryo sections immunostained with NESTIN (cyan), TUJ1 (yellow), and SOX2 (magenta). The white dashed lines demarcate the neuroepithelial borders. (C) Gardner-Altman estimation plots of the area of TUJ1+ regions normalized to the total area of the neuroepithelium for WT and Piezo1 KO embryos from images as in B. Data are from n = 6 embryos (26 unique fields of view) for WT and n = 5 embryos (27 unique fields of view) for Piezo1 KO from five independent experiments (P value calculated by two-sample t-test, Cohen’s d = −1.32). See also Video 1 and Fig. S2.
Figure S1.
Figure S1.
Fluorescent ISH of Piezo1 mRNA in the E10.5 mouse hindbrain. Representative ISH images of the hindbrain region of WT and Piezo1 KO mutant embryo sections. Piezo1 mRNA shown in yellow, TUJ1 antibody staining of neurons shown in magenta, and Hoechst-stained nuclei in cyan. The white dashed lines demarcate the neuroepithelium, and the red solid box highlights a blood vessel; ap, apical/ventricular border. Images are representative of n = 3 embryos for WT and n = 2 embryos for KO. WT panels are duplicated from Fig. 2 A for reference. Related to Fig. 2 A.
Figure S2.
Figure S2.
Piezo1 KO results in a disorganized neuroepithelium in vivo. Representative WT and Piezo1 KO images of the hindbrain region from embryo sections immunostained with SOX2 (magenta) and NESTIN (cyan). The white dashed lines demarcate the neuroepithelial borders; ap, apical/ventricular border. White and red boxed regions in the NESTIN panel are shown at higher magnification on the right. Note the pseudostratified organization of cells along the apical–basal axis in the WT sample, which is disrupted in the Piezo1 KO. Data are representative from n = 3 embryos for WT and n = 3 embryos for Piezo1 KO from two independent experiments. Related to Fig. 2 B.
Figure 3.
Figure 3.
Piezo1 KO reduces differentiation and proliferation in vitro. (A) Representative fluorescence images of cultured E10.5 WT and Piezo1 KO NSCs differentiated for 4 d in vitro and immunostained for astrocytic marker GFAP (green), neuronal marker MAP2 (magenta), and counterstained nuclei with Hoechst (yellow). (B) Gardner-Altman estimation plot of the percentage of GFAP+ (Cohen’s d = −1.85) and MAP2+ (Cohen’s d = −2.32) differentiated cells. n = 9 samples from 4 embryos for each of WT and for Piezo1 KO from three independent experiments. 7,461 cells from 14 unique fields of view quantified for WT and 5,957 cells from 18 unique fields of view quantified for Piezo1 KO. (C) Gardner-Altman estimation plots of the percentage of cells immunostained for the oligodendrocyte marker O4+ after 10 d of differentiation. See also Fig. S3. Data are from n = 11 samples from 6 embryos, 4,489 cells from 51 unique fields of view quantified for WT and n = 9 samples from 4 embryos, 3,941 cells from 54 unique fields of view quantified for Piezo1 KO from two independent experiments (Cohen’s d = −0.984). (D) Representative live-cell phase-contrast images from proliferating WT and Piezo1 KO NSCs imaged over 60 h. See also Video 2. (E) Quantitation of proliferation from live-cell imaging of NSC proliferation as shown in Video 2. Data are from four images per three wells for each of n = 4 embryos for WT and n = 4 embryos for Piezo1 KO, P < 0.05 for all points after 48 h (from left to right: P value = 0.04847 at 48 h, 0.047 at 50 h, 0.04246 at 52 h, 0.04451 at 54 h, 0.04067 at 56 h, 0.03997 at 58 h, 0.03733 at 60 h as determined by two-sample t-test).
Figure S3.
Figure S3.
Oligodendrocyte differentiation is reduced in Piezo1 KO NSCs. Representative fluorescence images of E10.5 WT and Piezo1 KO NSCs differentiated for 10 d in vitro and immunostained for the Oligodendrocyte marker, O4 (magenta) and counterstained nuclei with Hoechst (yellow). n = 6 embryos for WT and n = 4 embryos for Piezo1 KO from two experiments. Related to Fig. 3 C.
Figure S4.
Figure S4.
PCA plot of 15 WT and Piezo1 KO RNA-seq samples. Numbers indicate embryo name; black circles, WT female embryos; gray circles, WT male embryos; red circles, Piezo1 KO females; light red circles, Piezo1 KO males. Related to Fig. 4 A and Table S1.
Figure 4.
Figure 4.
Piezo1 KO results in downregulation of cholesterol biosynthesis. (A) Downregulation of cholesterol biosynthesis, the most predominant effect of Piezo1 KO identified by Ingenuity Pathway Analysis of differential gene expression data of WT and Piezo1 KO E10.5 brains. See also Table S2. Z-score is indicated inside the bar for each pathway. (B) Schematic of the cholesterol biosynthesis pathway. Circled numbers indicate the 16 enzyme genes within the pathway downregulated by 1.5-fold or more in Piezo1 KO brains relative to WT. ff-mas, 14-demethyl-14-dehydrolanosterol; t-mas, 14-demethyl-lanosterol. Numbers correspond to the following list: (enzyme, gene name, Log2Ratio) 1, acetyl-CoA acetyltransferase 2, Acat2, −1.00; 2, HMG-CoA synthase 1, Hmgcs1, −1.24; 3, HMG-CoA synthase 2, Hmgcs2, −1.67; 4, HMG-CoA reductase, Hmgcr, −0.74; 5, Mevalonate kinase, Mvk, −0.72; 6, Mevalonate-5-pyrophosphate decarboxylase, Mvd, −0.95; 7, Isopentenyl-5-isomerase, Idi1, −1.45; 8, Farnesyl diphosphate synthase, Fdps, −1.64; 9, Squalene synthase, Fdft1, −0.98; 10, Squalene epoxidase, Sqle, −0.61; 11, Lanosterol synthase, Lss, −0.82; 12, Cytochrome P450 subfamily member A1, Cyp51 −0.84; 13, Transmembrane 7 superfamily, Tm7sf2, −0.98; 14, Methosterol monooxygenase, Msmo, −1.25; 15, Hydroxysteroid 17 beta-dehydrogenase, Hsd17b7, −0.81; 16, Sterol C-5 desaturase, Sc5d, −0.78. Cerivastatin (gray box) is an inhibitor of HMG-CoA reductase, the rate-limiting enzyme of the cholesterol biosynthesis pathway. (C) Representative scatter plot of flow cytometry analysis of Nile Red stained WT and Piezo1 KO NSCs. WT (blue), Piezo1 KO (red). Inset: Representative overlay image of both green and red channels of Nile Red stained images of WT NSCs grown in proliferative conditions. Nuclei are counterstained with Hoechst (blue). (D) Gardner-Altman estimation plot of data as in C of Nile Red staining of NSCs plotting the ratio of the geometric mean fluorescence obtained from the green and red channels of WT and Piezo1 KO NSCs (Cohen’s d = −2.92). Data are from n = 6 samples from 3 embryos for WT and for Piezo1 KO and are representative of two experimental replicates. (E) Representative images of WT and Piezo1 KO NSCs grown in proliferative conditions and stained with Filipin III (see also Fig. S6). (F) Gardner-Altman estimation plot of data as in E of Filipin III staining of NSCs plotting the fluorescence intensity per cell in images of WT and Piezo1 KO NSCs (Cohen’s d = −1.79). Data from n = 4 embryos, 899 cells from 38 unique fields of view for WT and n = 4 embryos, 729 cells from 27 unique fields of view quantified for Piezo1 KO from three experimental replicates.
Figure S5.
Figure S5.
Cerivastatin inhibits NSC proliferation in vitro in a dose dependent manner. (A) Quantification of proliferation from live cell imaging of NSC proliferation as in Fig. 3 E, but with Cerivastatin added at timepoint 0. Data are from four images per each of three wells for each of n = 4 embryos for WT and n = 3 embryos for Piezo1 KO. (B) Quantification of live-cell proliferation in the presence of cerivastatin after 60 h and normalized to untreated NSCs reveals that cerivastatin reduces proliferation of NSCs in a dose-dependent manner. Piezo1 KO NSCs are less sensitive to drug treatment. P values determined by a two-sample t-test.
Figure S6.
Figure S6.
Cholesterol is lower in Piezo1 KO NSCs. Images from Fig. 4 E of cultured E10.5 WT and Piezo1 KO NSCs with Filipin III, shown here with nuclei counterstained with siR-DNA. n = 4 embryos for WT and n = 4 embryos for Piezo1 KO from three independent experiments. Related to Fig. 4, E and F.
Figure S7.
Figure S7.
Cholesterol supplementation does not rescue Piezo1 KO NSC proliferation. Quantitation of live-cell imaging of NSC proliferation. Gardner-Altman estimation plot of the fold proliferation after 60 h for Piezo1 KO NSCs with and without cholesterol-MBCD treatment. Data are from four images per three wells for each of n = 15 samples from 7 embryos for WT and n = 15 samples from 7 embryos for Piezo1 KO from eight independent experiments (Cohen’s d = 0.138).
Figure 5.
Figure 5.
Piezo1 KO NSC differentiation is partially rescued by exogenous cholesterol. (A) Representative fluorescence images of WT and Piezo1 KO NSCs differentiated for 4 d and immunostained for GFAP (green) and nuclei stained with Hoechst (yellow). Cells were either maintained in standard differentiation media (top panels) or media supplemented with 10 µg/ml cholesterol-MBCD (bottom panel). Bottom row shows a Gardner-Altman estimation plot of images as in A shows increased astrocyte differentiation with cholesterol-MBCD supplementation of Piezo1 KO NSCs. Data are normalized to untreated WT samples. n = 7 embryos, 9,797 cells from 24 unique fields of view quantified for WT, and n = 7 embryos, 12,020 cells from 39 unique fields of view quantified for Piezo1 KO and 11,761 cells from 37 unique fields of view quantified for Piezo1 KO + cholesterol from four independent experiments (Cohen’s d = 1.09). (B) Representative fluorescence images of WT and Piezo1 KO NSCs differentiated for 4 d and immunostained for MAP2 (cyan) and nuclei-stained with Hoechst (yellow). Cells were either maintained in standard differentiation media (top panels) or media supplemented with 10 µg/ml cholesterol-MBCD (bottom panel). Gardner-Altman estimation plot of images as in B shows increased neuronal differentiation with cholesterol supplementation of Piezo1 KO NSCs. Data are normalized to untreated WT samples. For GFAP, n = 14 samples from 7 embryos, 9,797 cells from 24 fields of view; for WT, n = 10 samples from 7 embryos, 12,020 cells from 39 fields of view; for Piezo1 KO, n = 10 from 7 embryos, 11,761 cells from 37 fields of view for Piezo1 KO + cholesterol from four independent experiments (Cohen’s d = 1.09). For Map2, n = 6 samples from 4 embryos, 7,461 cells from 14 unique fields of view quantified for WT and n = 6 samples from 4 embryos, 5,987 cells from 18 unique fields of view quantified for Piezo1 KO and 5,414 cells from 16 unique fields of view for Piezo1 KO + cholesterol from two independent experiments (Cohen’s d = 2.36).
Figure S8.
Figure S8.
Cholesterol supplementation does not rescue Piezo1 KO NSC oligodendrocyte differentiation. Gardner-Altman estimation plot of O4+ oligodendrocytes formed in Piezo1 KO mNSCs with and without cholesterol-MBCD treatment. Data are normalized to untreated WT samples. n = 6 samples from 5 embryos, 25,704 cells quantified from 80 unique fields of view for WT, and n = 6 samples from 4 embryos, 30,301 cells quantified from 76 unique fields of view for Piezo1 KO and 33,355 cells quantified from 60 unique fields of view for Piezo1 KO + cholesterol from two independent experiments (Cohen’s d = −0.587). Related to Fig. 5.

References

    1. Abuwarda, H., and Pathak M.M.. 2020. Mechanobiology of neural development. Curr. Opin. Cell Biol. 66:104–111. 10.1016/j.ceb.2020.05.012 - DOI - PMC - PubMed
    1. Albarrán-Juárez, J., Iring A., Wang S., Joseph S., Grimm M., Strilic B., Wettschureck N., Althoff T.F., and Offermanns S.. 2018. Piezo1 and Gq/G11 promote endothelial inflammation depending on flow pattern and integrin activation. J. Exp. Med. 215:2655–2672. 10.1084/jem.20180483 - DOI - PMC - PubMed
    1. Atcha, H., Jairaman A., Holt J.R., Meli V.S., Nagalla R.R., Veerasubramanian P.K., Brumm K.T., Lim H.E., Othy S., Cahalan M.D., et al. . 2021a. Mechanically activated ion channel Piezo1 modulates macrophage polarization and stiffness sensing. Nat. Commun. 12:3256. 10.1038/s41467-021-23482-5 - DOI - PMC - PubMed
    1. Atcha, H., Meli V.S., Davis C.T., Brumm K.T., Anis S., Chin J., Jiang K., Pathak M.M., and Liu W.F.. 2021b. Crosstalk between CD11b and Piezo1 mediates macrophage responses to mechanical cues. Front. Immunol. 12:689397. 10.3389/fimmu.2021.689397 - DOI - PMC - PubMed
    1. Brown, W.J., Sullivan T.R., and Greenspan P.. 1992. Nile red staining of lysosomal phospholipid inclusions. Histochemistry. 97:349–354. 10.1007/BF00270037 - DOI - PubMed

Publication types