. 2022 Dec;20(12):2313-2331.
doi: 10.1111/pbi.13909. Epub 2022 Sep 7.

A spatiotemporal transcriptomic network dynamically modulates stalk development in maize

Affiliations

A spatiotemporal transcriptomic network dynamically modulates stalk development in maize

Liang Le et al. Plant Biotechnol J. 2022 Dec.

Abstract

Maize (Zea mays) is an important cereal crop with suitable stalk formation which is beneficial for acquiring an ideal agronomic trait to resist lodging and higher planting density. The elongation pattern of stalks arises from the variable growth of individual internodes driven by cell division and cell expansion comprising the maize stalk. However, the spatiotemporal dynamics and regulatory network of the maize stalk development and differentiation process remain unclear. Here, we report spatiotemporally resolved transcriptomes using all internodes of the whole stalks from developing maize at the elongation and maturation stages. We identified four distinct groups corresponding to four developmental zones and nine specific clusters with diverse spatiotemporal expression patterns among individual internodes of the stalk. Through weighted gene coexpression network analysis, we constructed transcriptional regulatory networks at a fine spatiotemporal resolution and uncovered key modules and candidate genes involved in internode maintenance, elongation, and division that determine stalk length and thickness in maize. Further CRISPR/Cas9-mediated knockout validated the function of a cytochrome P450 gene, ZmD1, in the regulation of stalk length and thickness as predicted by the WGCN. Collectively, these results provide insights into the high genetic complexity of stalk development and the potentially valuable resources with ideal stalk lengths and widths for genetic improvements in maize.

Keywords: ZmD1; maize; plant height; stalk; transcriptome.


Conflict of interest statement

The authors declare no conflicts of interest.

Figures
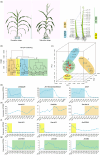
Figure 1
Figure 1
Transcriptomic analyses of internodes of the maize stalk at the elongation and maturation stages. (a) Morphological characterization (left panel) and growth pattern (right panel) of maize at the elongation stage (ES) and maturation stage (MS). UGN2_ES and UGN1_ES represent the second and last internodes underground at the elongation stage, respectively. N1_ES to N9_ES represent the first to ninth internodes of fast‐growing maize. MS represents mature maize. Cluster dendrogram (b) and PCA (c) of the transcriptomes of all 29 internode groups. (d–g) The selected marker genes were mainly expressed in the zones with gene expression patterns I (d), II (e), III (f), and IV (g). The time points belonging to the zone with gene expression patterns I, II, III, and IV are shown in light blue, yellow, deep yellow, and light green, respectively. BZ, base zone; DZ, division zone; EPCZ, elongation partially complete zone; MZ, mature zone.
Figure 2
Figure 2
Spatiotemporal gene expression pattern of maize stalk and functional enrichment analysis. (a) Fuzzy c‐means clustering shows the dynamic expression profile of individual internodes of maize stalks at the elongation and maturation stages. Nine clusters were identified along all internode and the two developmental stages from 13 964 genes with a high coefficient of variation. (b) Pie chart showing the proportion of nine clusters. (c–k) Functional category enrichment (modified from Mapan bins) of the nine fuzzy c‐means clusters, namely Cluster 1 (c), Cluster 2 (d), Cluster 3 (e), Cluster 4 (f), Cluster 5 (g), Cluster 6 (h), Cluster 7 (i), Cluster 8 (j), and Cluster 9 (k). C1–C9 represent Clusters 1–9.
Figure 3
Figure 3
Dynamic expression patterns of hormone‐related genes among individual internodes of the maize stalk at the elongation and maturation stages. Normalized expression levels of genes related to (a) abscisic acid (ABA), (b) gibberellic acid (GA), (c) brassinolide (BR), (d) auxin, (e) cytokinin (CK), (f) ethylene, (g) jasmonic acid (JA), and (h) salicylic acid (SA) are shown. For each hormone, its related genes are divided into three functional categories: (C1) synthesis‐degradation, (C2) signal transduction, and (C3) induced‐regulated‐responsive‐activated.
Figure 4
Figure 4
Dynamic inventories of differentially expressed genes (DEGs) orchestrate internode growth and development. (a) Representative internodes of four developmental zones. (b) The length of these representative internodes. (c) The number of DEGs among these representative internodes. (d) The Venn diagram shows the overlap of DEGs among these representative internodes. (e, f) Overview of DEGs (f) and transcription factors (TFs, f) in the division zones and elongation zones. Elongation represents the comparison between MS_N7 and ES_N7, and division represents the comparison between ES_Top and ES_N1. (g) Distribution of the representative TF families and other genes differentially expressed in the four zones.
Figure 5
Figure 5
Coexpression network analysis of RNA‐seq of the maize stalk at the elongation stage and identification of critical genes predicting internode development. (a) Scale independence and mean connectivity of the network at different soft‐threshold powers. The left panel displays the correlation of the soft threshold with the scale‐free fit index. The right panel displays the influence of soft‐threshold power on mean connectivity. (b) Hierarchical cluster tree showing coexpression modules identified by WGCNA. Each ‘leaf’ (short vertical line) corresponds to an individual gene. The major tree branches constitute 25 modules labelled with different colours. (c) Module‐phenotype association. Each row corresponds to a coloured module. The number of genes is indicated in the coloured box of each module. Each column corresponds to a phenotype. The correlation coefficient between the module and trait is indicated in red colour for positive correlations (ranging from 0 to 1) and in blue for negative correlations (ranging from 0 to −1), while the numbers within each coloured box give the P values for the statistical significance of each correlation. (d) Scatter plot showing the correlations between genes in the green module and phenotypes, including length, weight, diameter, and perimeter of every internode. (e) Heatmap showing the expression profile of all the coexpressed genes in the green module. The colour scale represents the Z score. Bar graphs show the consensus expression pattern of the coexpressed genes in this green module. (f) Functional category enrichment of the genes in the green module.
Figure 6
Figure 6
Expression pattern of the candidate gene Zm00001d039453 (ZmD1) in maize stalks. (a) The correlations of genes involved in the regulation of hormone levels and phenotypes (length, weight, diameter, and perimeter) are shown. (b) The expression pattern of ZmD1 in individual internodes of maize stalks at two stages. (c) Phylogenetic tree, gene structure, and protein domains of ZmD1 proteins among Arabidopsis, rice, and maize. The phylogenetic tree was constructed with MEGA7 using the full‐length amino acid sequences. The yellow exons code a P450 domain. (d) The expression level of ZmD1 in different maize tissues. (e) The nuclear‐location pattern of ZmD1 in maize protoplasts in the absence or presence of nuclear‐location signal (NLS) peptide. Scale bars = 10 μm.
Figure 7
Figure 7
Role of ZmD1 in regulating stalk development in maize. (a, b) Phenotype plant height (PH) and ear height (EH) of zmd1 mutant and wild type (WT) maize plants at the mature stage (N = 20). (c–f) The internode morphology and length of the zmd1 mutant and WT plants in the longitudinal section (c, d) and the cross‐section (e, f). (g, h) Cell phenotypes of mutant and WT stalks in longitudinal (g) and cross‐sections (h). Bar = 250 μm. (i–n). The number of vascular bundles (i), stalk cell number (j), length (k), width (l), length/width ratio (m), and area (n) in the cross and longitudinal section. *P < 0.05; **P < 0.01; ***P < 0.001 compared with WT.
Figure 8
Figure 8
Role of ZmD1 in regulating leaf, tassel, and seed development in maize. (a) Morphology of the ear leaves in mature maize. (b–e) Ear leaf number (b), angle (c), length (d), and width (e) in mature maize were statistically analysed. (f–i) Cell number (f), cell length (g), cell width (h), and length/width ratio of ear leaf (i). (j–l) Tassel phenotype (j), tassel length (k), and branch number (l) of normal compared with zmd1 mutants. (m) Variations in days to anthesis. (n–q) Kernel morphology (n), length (o), width (p), and grain weight of hundred kernels (q) between zmd1 and WT. *P < 0.05; **P < 0.01; ***P < 0.001 compared with WT.
Figure 9
Figure 9
Transcriptome analysis of ZmD1‐regulated differentially expressed genes (DEGs). (a) Pearson's correlation analysis of the gene expression between ZmD1 mutants and WT. WS: WT stalk; DS, ZmD1 stalk. (b) A total of 1034 DEGs of zmd1 mutant stalks compared with WT stalks. (c) Volcano plots showing the number of DEGs regulated by ZmD1. (d) Functional enrichment of zmd1/WT‐specific DEGs. (e–h) Heatmaps showing the genes involved in the regulation of plant hormone transduction (e) and cell size (g). Quantitative PCR results of selected genes involved in the regulation of plant hormone transduction (f) and cell size (h). (i) Venn diagram showing the distribution of unique and common DEGs among zmd1 vs. WT, ES_Top vs. ES_N1, and MS_N7 vs. ES_N7. (j) Heatmap showing the 24 common transcription factors regulated by ZmD1, cell division and elongation.

References

    1. Avila, L.M. , Cerrudo, D. , Swanton, C. and Lukens, L. (2016) Brevis plant1, a putative inositol polyphosphate 5‐phosphatase, is required for internode elongation in maize. J. Exp. Bot. 67, 1577–1588. - PMC - PubMed
    1. Bleecker, A.B. , Schuette, J.L. and Kende, H. (1986) Anatomical analysis of growth and developmental patterns in the internode of deepwater rice. Planta, 169, 490–497. - PubMed
    1. Brugiere, N. , Jiao, S. , Hantke, S. , Zinselmeier, C. , Roessler, J.A. , Niu, X. , Jones, R.J. et al. (2003) Cytokinin oxidase gene expression in maize is localized to the vasculature, and is induced by cytokinins, abscisic acid, and abiotic stress. Plant Physiol. 132, 1228–1240. - PMC - PubMed
    1. Cassani, E. , Bertolini, E. , Cerino Badone, F. , Landoni, M. , Gavina, D. , Sirizzotti, A. and Pilu, R. (2009) Characterization of the first dominant dwarf maize mutant carrying a single amino acid insertion in the VHYNP domain of the dwarf8 gene. Mol. Breed. 24, 375–385.
    1. Castorina, G. , Persico, M. , Zilio, M. , Sangiorgio, S. , Carabelli, L. and Consonni, G. (2018) The maize lilliputian1 (lil1) gene, encoding a brassinosteroid cytochrome P450 C‐6 oxidase, is involved in plant growth and drought response. Ann. Bot. 122, 227–238. - PMC - PubMed

Publication types

MeSH terms

LinkOut - more resources