. 2022 Nov;144(5):1027-1048.
doi: 10.1007/s00401-022-02489-2. Epub 2022 Sep 7.

Oncohistone interactome profiling uncovers contrasting oncogenic mechanisms and identifies potential therapeutic targets in high grade glioma

Affiliations

Oncohistone interactome profiling uncovers contrasting oncogenic mechanisms and identifies potential therapeutic targets in high grade glioma

Robert Siddaway et al. Acta Neuropathol. 2022 Nov.

Abstract

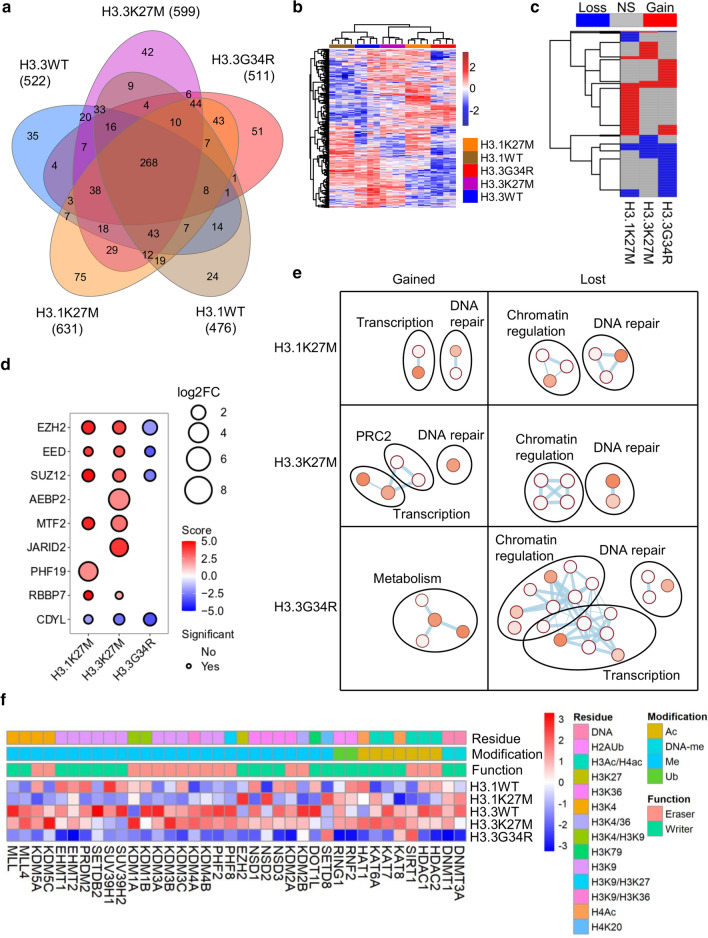
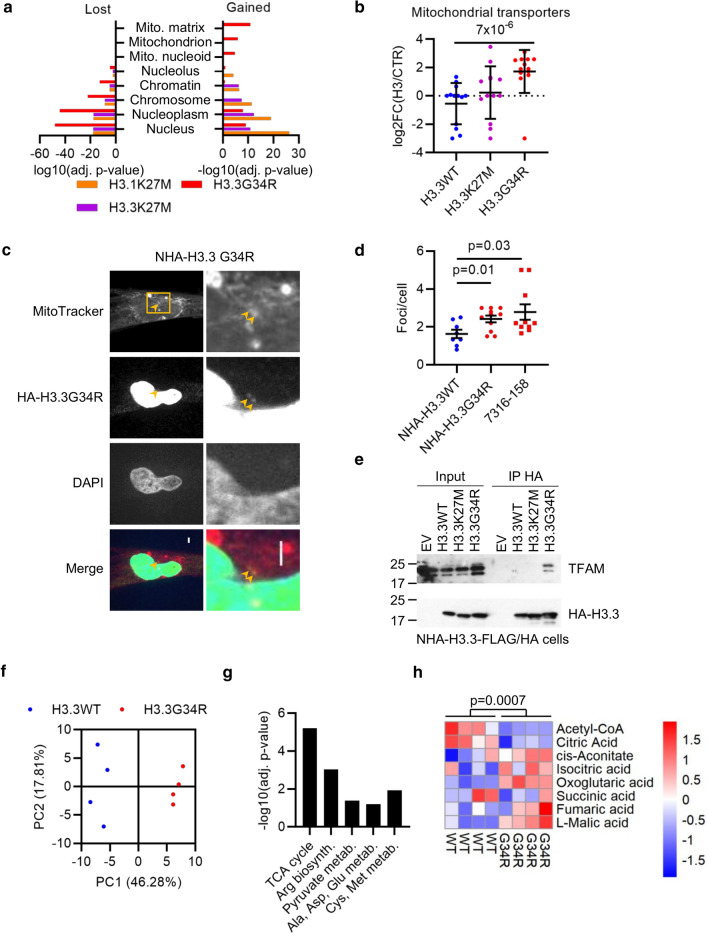
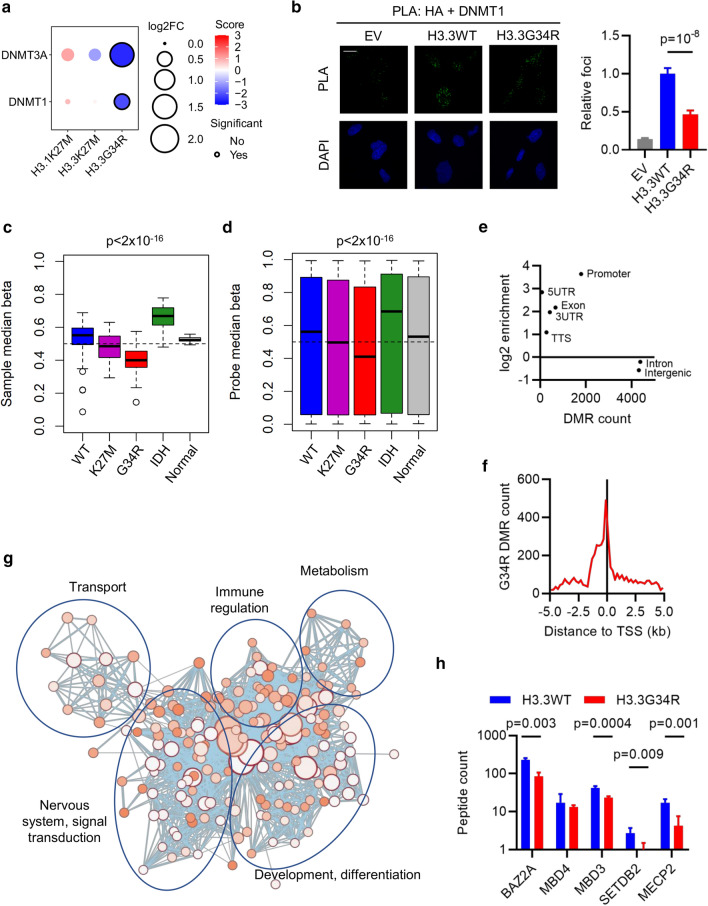
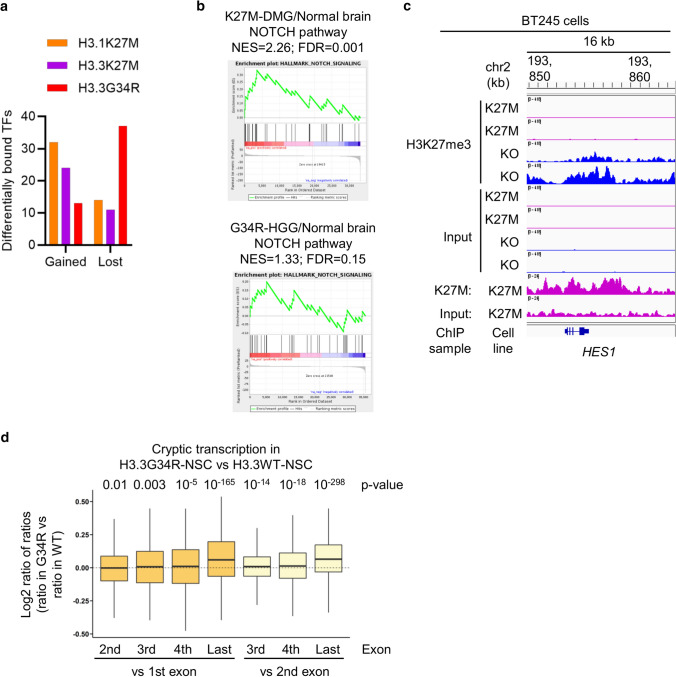
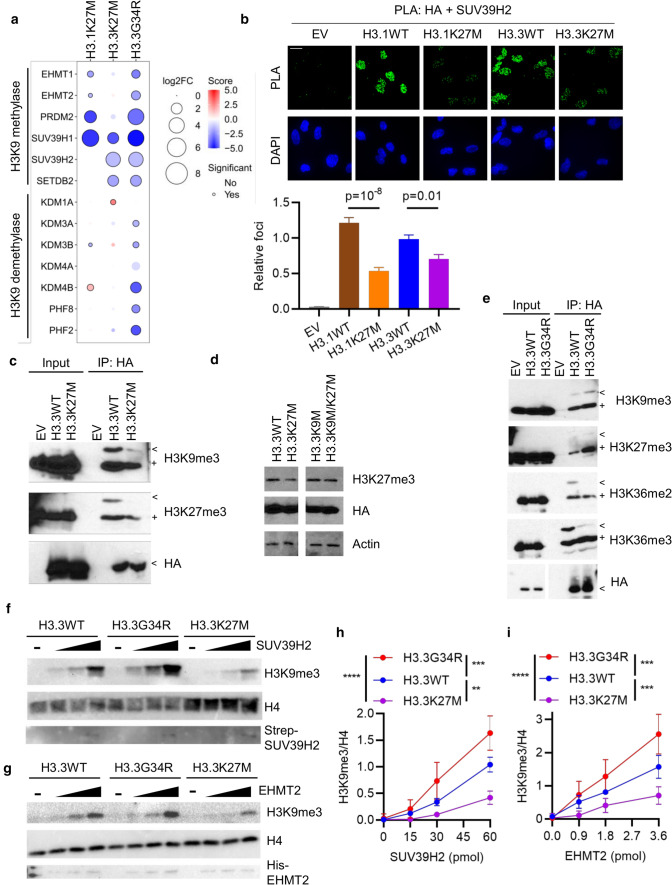
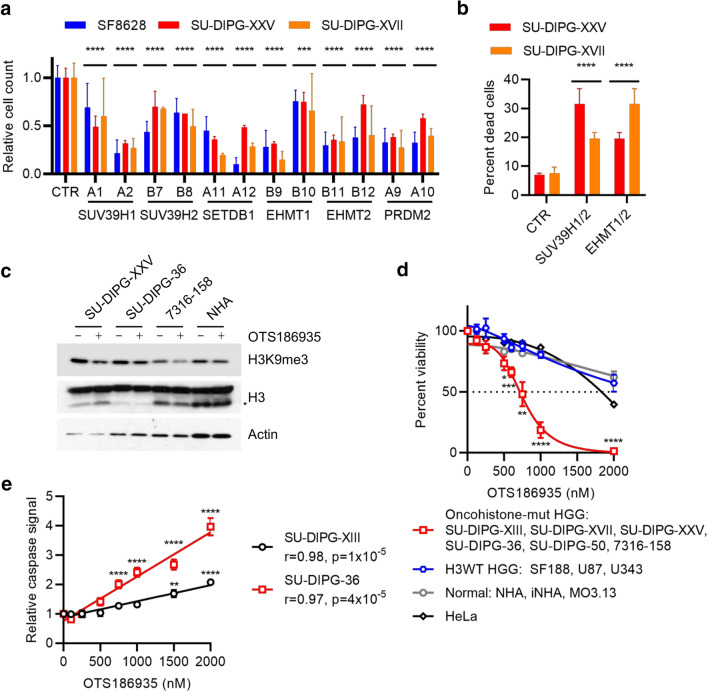
Histone H3 mutations at amino acids 27 (H3K27M) and 34 (H3G34R) are recurrent drivers of pediatric-type high-grade glioma (pHGG). H3K27M mutations lead to global disruption of H3K27me3 through dominant negative PRC2 inhibition, while H3G34R mutations lead to local losses of H3K36me3 through inhibition of SETD2. However, their broader oncogenic mechanisms remain unclear. We characterized the H3.1K27M, H3.3K27M and H3.3G34R interactomes, finding that H3K27M is associated with epigenetic and transcription factor changes; in contrast H3G34R removes a break on cryptic transcription, limits DNA methyltransferase access, and alters mitochondrial metabolism. All 3 mutants had altered interactions with DNA repair proteins and H3K9 methyltransferases. H3K9me3 was reduced in H3K27M-containing nucleosomes, and cis-H3K9 methylation was required for H3K27M to exert its effect on global H3K27me3. H3K9 methyltransferase inhibition was lethal to H3.1K27M, H3.3K27M and H3.3G34R pHGG cells, underscoring the importance of H3K9 methylation for oncohistone-mutant gliomas and suggesting it as an attractive therapeutic target.

Keywords: H3G34R; H3K27M; H3K9 methylation; pHGG.


Conflict of interest statement

The authors declare no potential conflicts of interest.

Figures

Fig. 1
Fig. 1
BioID interactome of wild-type and mutant H3. A Summary of high-confidence interactors detected with each histone. B Heatmap of all peptide counts of all high-confidence interactors identified in the experiment. C Heatmap depicting proteins differentially bound by any oncohistone relative to its WT control. D Bubble plot showing differential enrichment of PRC2 components with each oncohistone relative to its WT control. Size = log2(mutant/WT). Color represents significance. Statistically significant (p < 0.05) differential interactions have a black border. E Network of Reactome and KEGG pathways significantly enriched (p < 0.05) among differentially bound proteins by each oncohistone. Node size and color reflects significance and edge thickness reflects number of proteins shared between two nodes. F Heatmap of relative peptide counts of proteins with direct histone modifying activity identified by BioID. Average peptides per histone were Z-transformed
Fig. 2
Fig. 2
Mitochondrial localization of H3.3G34R. A Enrichment of subcellular localizations (Gene Ontology Cellular Compartments) among the proteins differentially bound by each oncohistone. B Relative enrichment [log2(H3/control)] of outer (TOMM) and inner (TIMM) mitochondrial transporter proteins associated with each histone. p: t test. C Confocal microscopy of NHA cells expressing H3.3G34R-FLAG/HA and stained with MitoTracker Red and HA. Box shows zoom area at right. Arrows mark co-localization of H3.3G34R with mitochondria. Scale bar: 3 μm. D Quantification of colocalization between MitoTracker Red and H3.3 in NHA cells expressing H3.3WT or H3.3G34R (antibody: HA tag) or 7316-158 cells (antibody: H3.3G34R). Bars show mean ± standard error of at least 7 fields of view. E Co-immunoprecipitation of H3-FLAG/HA and TFAM from NHA cells transduced with indicated constructs and subjected to HA IP. F Principal components analysis of normalized metabolite concentrations in NHAs expressing H3.3WT or H3.3G34R as determined by LC–MS (n = 4). G Enriched metabolic pathways in H3.3G34R vs H3.3WT NHAs. H Relative concentration of indicated TCA metabolites in H3-expressing NHA cell lines (n = 4). p: t test
Fig. 3
Fig. 3
Reduced interaction with DNA methyltransferases leads to global hypomethylation in H3.3G34R-mutant pHGG. A Bubble plot showing differential enrichment of DNMT1 and DNMT3A with each oncohistone relative to WT control. Size = log2(mutant/WT). Color is a function of -log10 p-value and direction of interaction change. Statistically significant (p < 0.05) differential interactions have a black border. B Proximity ligation assays in MO3.13 cells between HA-H3 and DNMT1. Scale bar: 20 μm. Results are representative of two biological replicates and show mean foci counts relative to H3.3WT ± standard error. n: EV = 52; H3.3WT = 73; H3.3G34R = 61. p: ANOVA. C Median methylation beta value per sample from pHGG categorized as WT (n = 98); mutant for K27M (n = 34), G34R (n = 24), or IDH (n = 25); or normal brain (n = 7). The box marks the interquartile range (IQR) and shows the median value. The whiskers extend to 1.5 × IQR. p: ANOVA. D Median methylation beta value per probe from pHGG categorized as WT (n = 98); mutant for K27M (n = 34), G34R (n = 24), or IDH (n = 25); or normal brain (n = 7). The box marks the interquartile range (IQR) and shows the median value. The whiskers extend to 1.5 × IQR. p: ANOVA. E Scatter plot of number of differentially methylated regions (DMR) detected in H3.3G34R-mutant (n = 24) vs WT (n = 98) tumors assigned to each genomic location category versus the log2-enrichment against an expected background. F Enrichment of DMRs detected in H3.3G34R-mutant (n = 24) vs WT (n = 98) tumors around transcription start sites (TSS). G Network of pathways (Reactome, KEGG, Gene Ontology Biological Processes) enriched in genes with DMRs ± 1 kb from the TSS. Node size and color reflects significance and edge thickness reflects number of genes shared between two nodes. H Peptide counts of methyl-binding domain (MBD) containing proteins identified by BioID with H3.3WT or H3.3G34R. p: t test
Fig. 4
Fig. 4
Oncohistones alter the transcription factor landscape. A Differentially bound TFs with each oncohistone relative to its WT control. B Gene set enrichment analysis (GSEA) of NOTCH pathway in H3K27M-mutant DMG (n = 38) compared with normal brain (n = 20), and H3.3G34R-mutant pHGG (n = 20) compared with normal brain (n = 5). NES normalized enrichment score. FDR false discovery rate. C H3K27me3 and K27M ChIP-Seq read density in a window centered on the HES1 gene in BT245 cells that are either parental or modified with CRISPR to remove the H3.3K27M mutation. D Cryptic transcription levels in H3.3G34R (n = 2) vs H3.3WT (n = 2) NSCs. Exon-level expression levels were calculated and the ratio against first or second exon expressions were compared between cell lines. p: Wilcoxon rank sum test
Fig. 5
Fig. 5
Oncohistones disrupt H3K9 methylation. A Bubble plot showing differential enrichment of indicated H3K9 methylases and demethylases with each oncohistone relative to WT control. Size = log2(mutant/WT). Color represents significance. Statistically significant (p < 0.05) differential interactions have a black border. B Proximity ligation assays in MO3.13 cells between HA-H3 and SUV39H2. Scale bar: 20 μm. Results are representative of two biological replicates and show mean foci counts relative to H3.3WT ± standard error. n: EV = 14; H3.1WT = 36; H3.1K27M = 67; H3.3WT = 60; H3.3K27M = 62. p: ANOVA. C Ectopic histone-containing nucleosomes were immunoprecipitated (IP) from H3-expressing NHA cells and ectopic and endogenous modifications were assessed by western blotting. < : Ectopic HA-tagged histone. + : endogenous histone. D NHA cells were transduced with indicated constructs and whole cell lysates analyzed by western blotting. E Ectopic histone-containing nucleosomes were immunoprecipitated (IP) from H3-expressing NHA cells and ectopic and endogenous modifications were assessed by western blotting. < : Ectopic HA-tagged histone. + : endogenous histone. F Representative gels from in vitro methylation assays carried out with nucleosomes assembled with H3.3WT, H3.3G34R or H3.3K27M and incubated with increasing amounts of SUV39H2. G Representative gels from in vitro methylation assays carried out with nucleosomes assembled with H3.3WT, H3.3G34R or H3.3K27M and incubated with increasing amounts of EHMT2. H Quantification of SUV39H2 methylation assays from F (n = 3). p (ANOVA): H3.3WT vs H3.3K27M, p = 0.003; H3.3WT vs H3.3G34R, p = 0.001; H3.3K27M vs H3.3G34R, p = 10–7. I Quantification of EHMT2 methylation assays from G (n = 3). p (ANOVA): H3.3WT vs H3.3K27M, p = 0.006; H3.3WT vs H3.3G34R, p = 0.009; H3.3K27M vs H3.3G34R, p = 10–6
Fig. 6
Fig. 6
Oncohistone-mutant pHGG cells are vulnerable to inhibition of H3K9 methylation. A Viable cell counts of H3.3K27M-mutant cell lines transduced with shRNA lentiviral constructs targeting H3K9 methylases, expressed relative to cells transduced with control shRNA. Two separate shRNA clones were used for each gene. Results show mean ± standard deviation of 2–5 biological replicates. p: ANOVA comparing each clone to control shRNA (CTR). ****p < 0.0001. B Percent cell death of H3.3K27M-mutant cell lines transduced with combinations of control shRNA targeting H3K9 methylases. Results show mean ± standard deviation of 3 biological replicates. p: ANOVA comparing each clone to control shRNA (CTR). ****p < 0.0001. C Cells treated with DMSO or OTS186935 (1,500 nM) for 4 days were analyzed by western blotting. *: clipped H3. D Relative viable cell counts of cell lines treated for 4 days with DMSO or increasing doses of OTS186935. Results show mean ± standard error for groups of cell lines. Each cell line was analyzed in six biological replicates. E Quantification of caspase activation assay in SU-DIPG-XIII and SU-DIPG-36 cells treated with DMSO or increasing doses of OTS186935 and measured after 24 h. Results show mean ± standard error of 6 biological replicates, with 2 fields of view measured per replicate. **p < 0.01; ****p < 0.0001; r: Pearson correlation. p values for overall correlation were determined with a t test and for comparisons to DMSO by ANOVA with Dunnett’s multiple comparisons test

References

    1. Alam MS. Proximity ligation assay (PLA) Curr Protoc Immunol. 2018;123:e58. doi: 10.1002/cpim.58. - DOI - PMC - PubMed
    1. Anders S, Huber W. Differential expression analysis for sequence count data. Genome Biol. 2010;11:R106. doi: 10.1186/gb-2010-11-10-r106. - DOI - PMC - PubMed
    1. Anders S, Pyl PT, Huber W. HTSeq–a Python framework to work with high-throughput sequencing data. Bioinformatics. 2015;31:166–169. doi: 10.1093/bioinformatics/btu638. - DOI - PMC - PubMed
    1. Aryee MJ, Jaffe AE, Corrada-Bravo H, Ladd-Acosta C, Feinberg AP, Hansen KD, Irizarry RA. Minfi: a flexible and comprehensive Bioconductor package for the analysis of Infinium DNA methylation microarrays. Bioinformatics. 2014;30:1363–1369. doi: 10.1093/bioinformatics/btu049. - DOI - PMC - PubMed
    1. Atak ZK, Gianfelici V, Hulselmans G, De Keersmaecker K, Devasia AG, Geerdens E, Mentens N, Chiaretti S, Durinck K, Uyttebroeck A, et al. Comprehensive analysis of transcriptome variation uncovers known and novel driver events in T-cell acute lymphoblastic leukemia. PLoS Genet. 2013;9:e1003997. doi: 10.1371/journal.pgen.1003997. - DOI - PMC - PubMed

Publication types