. 2022 Sep 13;119(37):e2201645119.
doi: 10.1073/pnas.2201645119. Epub 2022 Sep 7.

Monocytes maintain central nervous system homeostasis following helminth-induced inflammation

Affiliations

Monocytes maintain central nervous system homeostasis following helminth-induced inflammation

Jianya Peng et al. Proc Natl Acad Sci U S A. .

Abstract

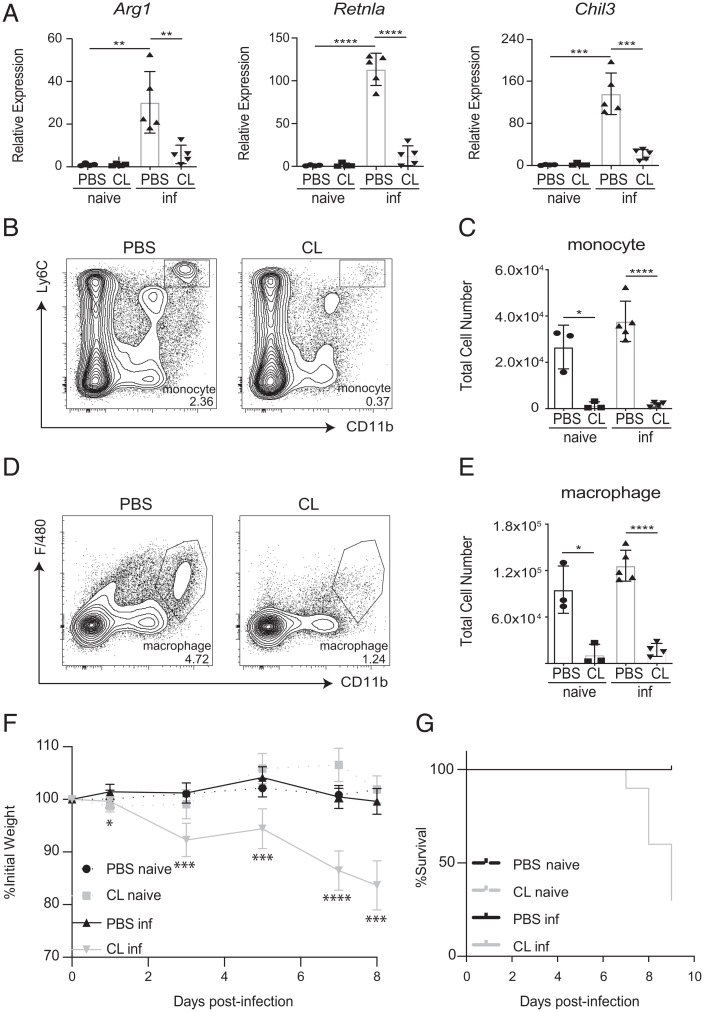
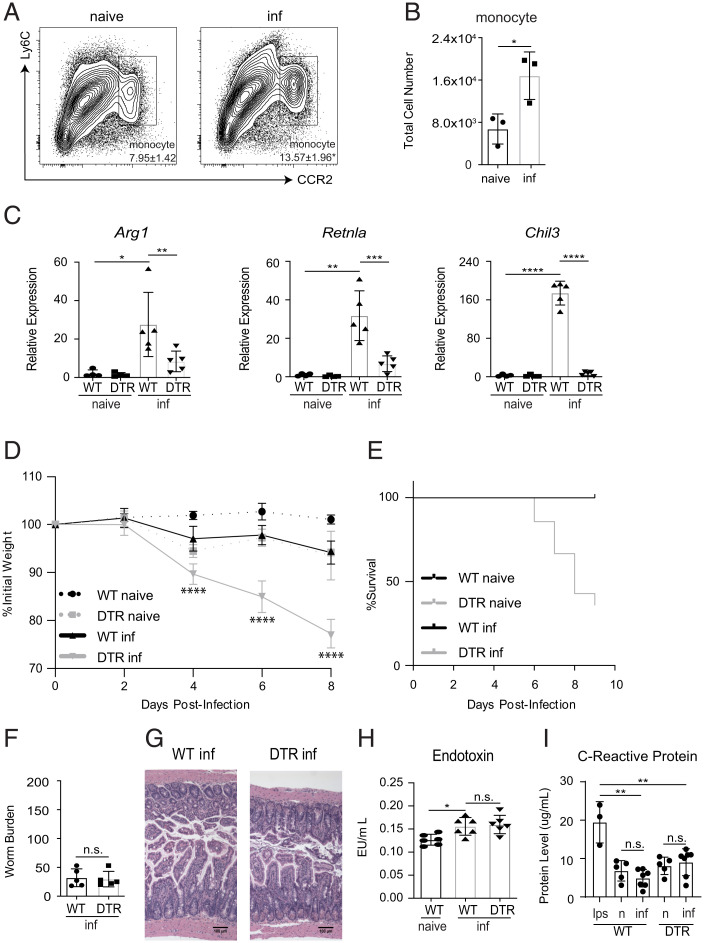
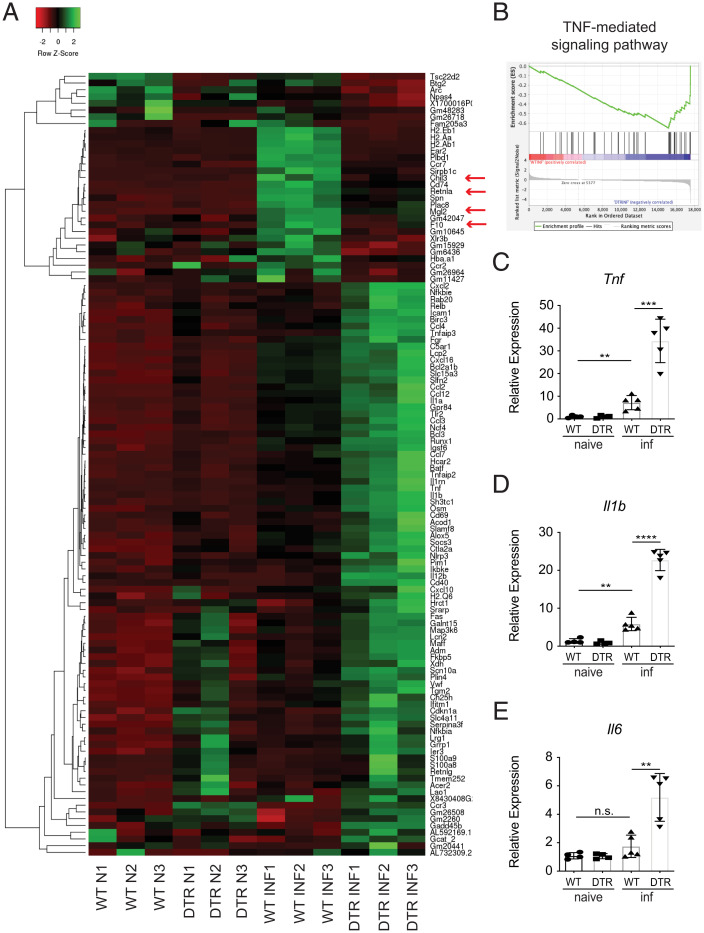
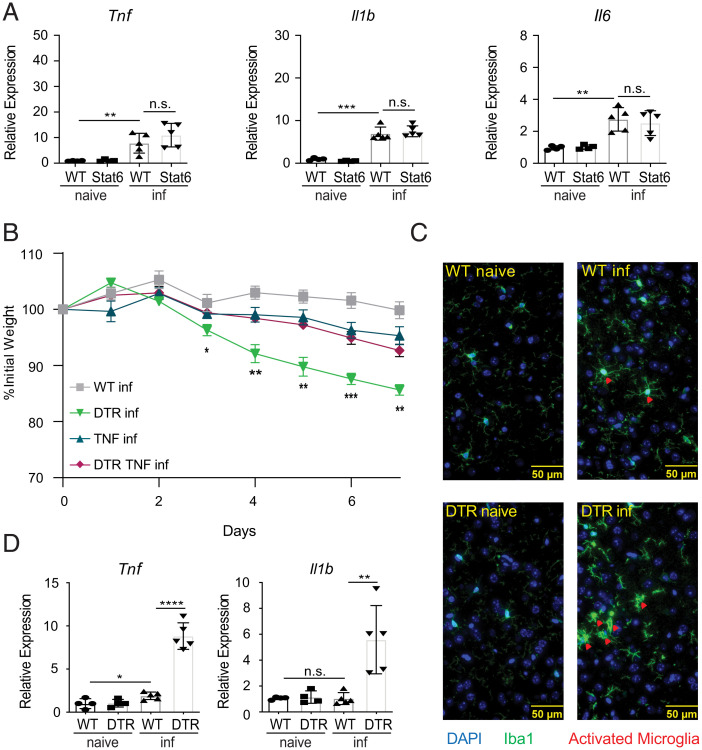
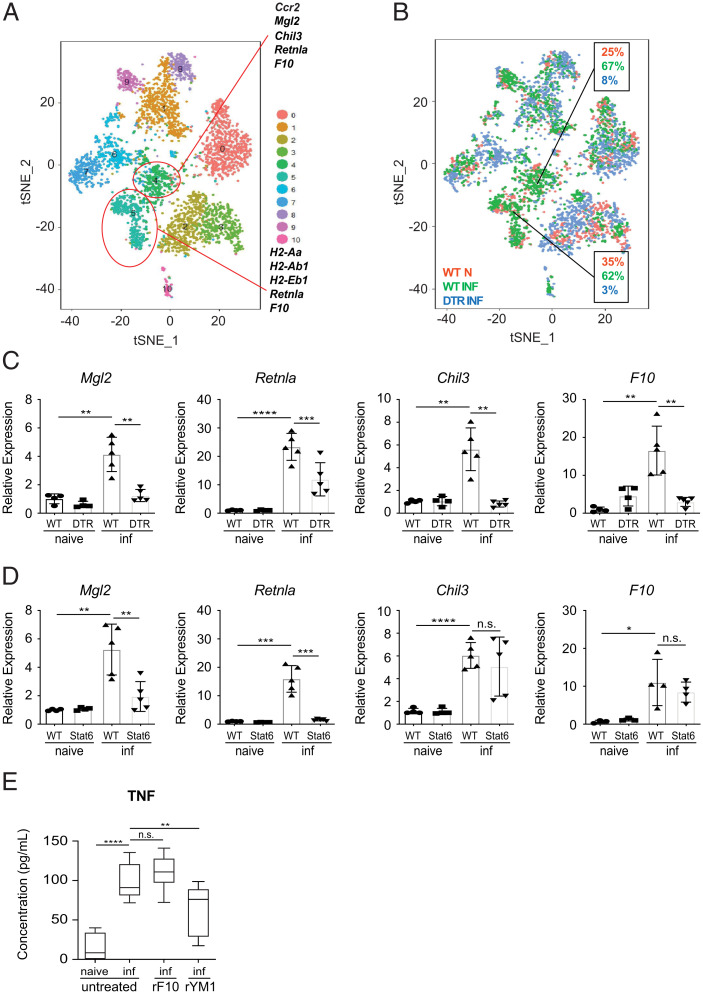
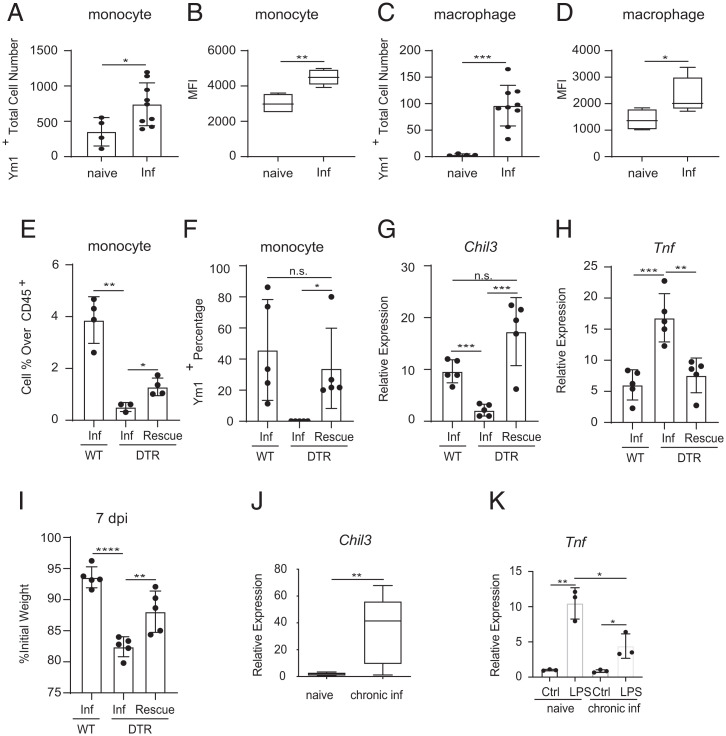
Neuroimmune interactions are crucial for regulating immunity and inflammation. Recent studies have revealed that the central nervous system (CNS) senses peripheral inflammation and responds by releasing molecules that limit immune cell activation, thereby promoting tolerance and tissue integrity. However, the extent to which this is a bidirectional process, and whether peripheral immune cells also promote tolerance mechanisms in the CNS remains poorly defined. Here we report that helminth-induced type 2 inflammation promotes monocyte responses in the brain that are required to inhibit excessive microglial activation and host death. Mechanistically, infection-induced monocytes express YM1 that is sufficient to inhibit tumor necrosis factor production from activated microglia. Importantly, neuroprotective monocytes persist in the brain, and infected mice are protected from subsequent lipopolysaccharide-induced neuroinflammation months after infection-induced inflammation has resolved. These studies demonstrate that infiltrating monocytes promote CNS homeostasis in response to inflammation in the periphery and demonstrate that a peripheral infection can alter the immunologic landscape of the host brain.

Keywords: helminth; innate immune cells; monocyte; neuroimmune cross-talk.


Conflict of interest statement

Competing interest statement: M.C.S. is the President of NemaGen Discoveries.

Figures

Fig. 1.
Fig. 1.
Loss of M2 macrophages is associated with increased morbidity and mortality post-T. spiralis infection. Mice treated with PBS- or clodronate-loaded (CL) liposomes intravenously were infected with T. spiralis and sacrificed on 8 days post-infection (dpi). (A) Intestinal expression of M2-associated markers was evaluated via RT-qPCR. The presence or absence of (B and C) monocytes (Ly6C+CD11b+) and (D and E) macrophages (F4/80+CD11b+) in the spleen was determined via flow cytometry. Populations are gated from CD45hiCD3CD19Ly6G cells. Numbers in cytometry plots represent the percentage of CD45hi cells. (F) Weights and (G) mortality were tracked throughout the course of the infection. All panels are representative of at least three independent experiments with at least three biological replicates per group per experiment. Statistical analysis was performed using Student’s t test. *P < 0.05; **P < 0.01; ***P < 0.001; ****P < 0.0001. For (F), statistics are comparing CL inf group to PBS inf group for each day. Error bars represent ± SD. inf, T. spiralis-infected.
Fig. 2.
Fig. 2.
CCR2+ monocytes are required for survival after T. spiralis infection. CCR2-GFP mice were infected with T. spiralis. On 8 dpi, small intestine tissue was made into a single-cell suspension and (A) the percent (gated on CD45hiEpCAM cells) and (B) total cell number of CCR2+ monocytes were determined via flow cytometry. Numbers in cytometry plots represent the percentage of CD45hiEpCAM cells. WT or CCR2-DTR (DTR) mice were treated with diphtheria toxin (DT) intraperitoneally (i.p.) every other day and sacrificed 8 dpi. (C) Intestinal expression of M2-associated markers was evaluated via RT-qPCR. (D) Weights and (E) mortality were tracked throughout the course of the infection. (F) Worm burden, (G) H&E staining of intestinal tissue, (H) plasma endotoxin levels, and (I) Crp levels were evaluated on 8 dpi. All panels are representative of at least three independent experiments with at least three biological replicates per group per experiment. Statistical analysis was performed using Student’s t test. *P < 0.05; **P < 0.01; ***P < 0.001; ****P < 0.0001; n.s., not significant. For (D), statistics are comparing WT-infected group to DTR-infected group. Error bars represent ± SD. inf, T. spiralis-infected. n, naive.
Fig. 3.
Fig. 3.
Loss of CCR2+ monocytes results in a proinflammatory signature in the brain. WT and CCR2-DTR (DTR) mice were infected with T. spiralis and treated with DT (i.p.) every other day. Mice were sacrificed 8 dpi. (A) Heat map includes genes that are upregulated (FC > 1.5) or downregulated (FC < −1.5) in infected WT versus infected DTR mice and includes three biological replicates per naive group (N) and three biological replicates per infected group (INF). (B) GSEA for TNF-mediated signaling pathway. (CE) RNA from brain tissue was extracted, and expression of proinflammatory-associated markers was evaluated via RT-qPCR. CE are representative of at least three independent experiments with at least three biological replicates per group per experiment. Statistical analysis was performed using Student’s t test. **P < 0.01; ***P < 0.001; ****P < 0.0001; n.s., not significant. Error bars represent ± SD. inf, T. spiralis-infected.
Fig. 4.
Fig. 4.
CCR2+ monocytes limit production of proinflammatory cytokines in the brain post-T. spiralis infection. (A) RNA from WT or STAT6KO (Stat6) mice brain tissue was extracted, and expression of proinflammatory-associated markers was evaluated via RT-qPCR. WT, DTR, TNF KO (TNF), and CCR2-DTR/TNF KO (DTR TNF) mice were treated with DT (i.p.) every other day and sacrificed 8 dpi. (B) Weights were tracked throughout the course of the infection. (C) Brains were taken from WT or DTR-infected mice 8 dpi, sectioned, and co-stained with anti-ionized calcium-binding adaptor protein-1 (anti-IBA1) and 4′,6-diamidino-2-phenylindole (DAPI). Red arrowheads indicate activated microglia from the brains of infected mice. (D) Microglia (CD45midCD11b+) were sort-purified from naive and infected WT or DTR mice, and expression of proinflammatory-associated markers was evaluated via RT-qPCR. All panels are representative of at least three independent experiments with at least three biological replicates per group per experiment. Statistical analysis was performed using Student’s t test. *P < 0.05; **P < 0.01; ***P < 0.001; ****P < 0.0001; n.s., not significant. For (B), statistics are comparing DTR-infected to DTR TNF-infected. Error bars represent ± SD. inf, T. spiralis-infected.
Fig. 5.
Fig. 5.
CCR2+ monocytes and monocyte-derived cells express immunoregulatory factors in the brain following T. spiralis infection. Single-cell RNA-seq was performed on sort-purified CD45hi cells, from the brains of naive WT and infected (8 dpi) WT and DTR mice. (A) t-SNE dimension reduction illustrating distinct cell populations in the brain. Each group includes CD45hi cells pooled from five mice. (B) The relative abundance of each cluster was determined in naive WT, infected WT mice, and infected DTR mice. (C and D) RNA from whole-brain tissue was extracted from WT, DTR, or STAT6KO mice on 8 dpi and evaluated via RT-qPCR. (E) Sort-purified microglia were pooled from naive and infected WT mice. Microglia from infected mice were incubated with rYM1 or rF10 and stimulated. TNF production was evaluated via ELISA. All panels are representative of at least three independent experiments each with at least three biological or technical replicates per group. Statistical analysis was performed using Student’s t test. *P < 0.05; **P < 0.01; ***P < 0.001; ****P < 0.0001; n.s., not significant. Error bars represent SD. Error bars represent ± SD. inf, T. spiralis-infected.
Fig. 6.
Fig. 6.
YM1 expressing monocytes are sufficient to prevent infection-induced neuroinflammation. Intracellular staining of Ym1 in brain (A and B) monocytes and (C and D) macrophages from naive and infected WT mice. (E) Monocyte percentage over total CD45+ cells in brains of infected WT, DTR, and infected DTR mice receiving WT monocytes (Rescue). (F) Ym1+ monocyte percentage in brains of infected WT, DTR, and infected DTR mice receiving WT monocytes. (G and H) RNA from whole-brain tissue was extracted from infected WT, DTR, and infected DTR mice receiving WT monocytes, and expression of Chil3 and Tnf were evaluated via RT-qPCR. (I) Weights were recorded at the end of the infection. (J) RNA from whole-brain tissue was extracted from mice up to 3 months post-infection, and expression of Chil3 was evaluated via RT-qPCR. (K) Infected WT mice were injected with LPS (i.p.) 4 wk post-infection and sacrificed 6 h post-injection. All panels are representative of at least three independent experiments with at least three biological or technical replicates per group per experiment. Statistical analysis was performed using Student’s t test. *P < 0.05; **P < 0.01; ***P < 0.001; ****P < 0.0001; n.s., not significant. Error bars represent SD. Error bars represent ± SD. inf, T. spiralis-infected. MFI, mean fluorescence intensity.

References

    1. Ibiza S., et al. , Glial-cell-derived neuroregulators control type 3 innate lymphoid cells and gut defence. Nature 535, 440–443 (2016). - PMC - PubMed
    1. Nagashima H., et al. , Neuropeptide CGRP limits group 2 innate lymphoid cell responses and constrains type 2 inflammation. Immunity 51, 682–695.e6 (2019). - PMC - PubMed
    1. Lai N. Y., et al. , Gut-innervating nociceptor neurons regulate Peyer’s patch microfold cells and SFB levels to mediate salmonella host defense. Cell 180, 33–49.e22 (2020). - PMC - PubMed
    1. Chiu I. M., et al. , Bacteria activate sensory neurons that modulate pain and inflammation. Nature 501, 52–57 (2013). - PMC - PubMed
    1. Baral P., et al. , Nociceptor sensory neurons suppress neutrophil and γδ T cell responses in bacterial lung infections and lethal pneumonia. Nat. Med. 24, 417–426 (2018). - PMC - PubMed

Publication types