. 2022 Dec:120:1-9.
doi: 10.1016/j.neurobiolaging.2022.08.001. Epub 2022 Aug 7.

Alzheimer's genetic risk effects on cerebral blood flow across the lifespan are proximal to gene expression

Affiliations

Alzheimer's genetic risk effects on cerebral blood flow across the lifespan are proximal to gene expression

Hannah Chandler et al. Neurobiol Aging. 2022 Dec.

Abstract

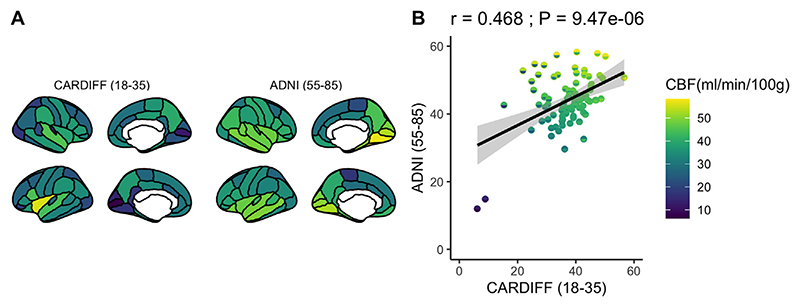
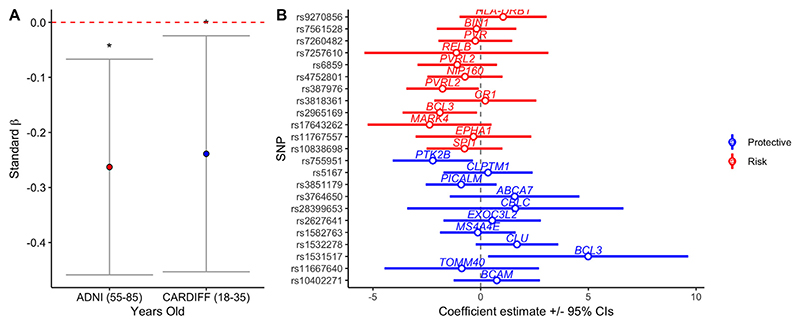
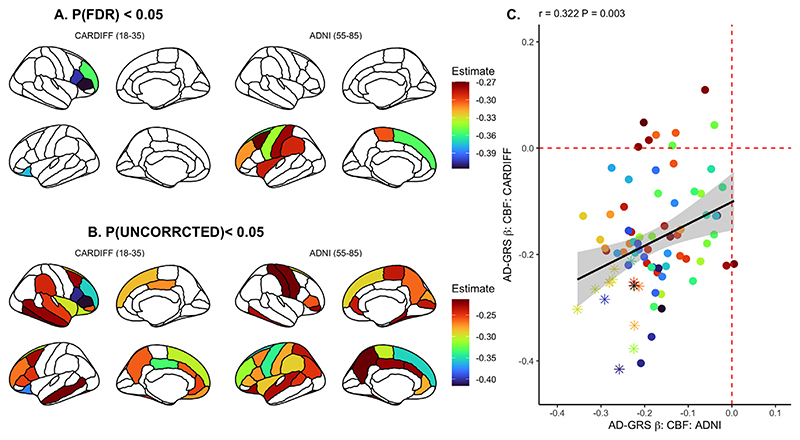
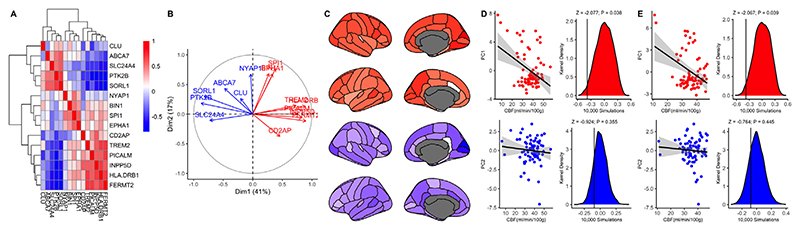
Cerebrovascular dysregulation such as altered cerebral blood flow (CBF) can be observed in Alzheimer's disease (AD) and may precede symptom onset. Genome wide association studies show that AD has a polygenic aetiology, providing a tool for studying AD susceptibility across the lifespan. Here, we ascertain whether the AD genetic risk effects on CBF previously observed (Chandler et al., 2019) are also present in later life. Consistent with our prior observations, AD genetic risk score (AD-GRS) was associated with reduced CBF in the ADNI sample. The regional association between AD-GRS and CBF were also spatially similar. Furthermore, CBF was related to the regional mRNA transcript expression of AD risk genes proximal to AD-GRS risk loci. These observations suggest that AD risk alleles may reduce neurovascular process such as CBF, potentially via mechanisms such as regional expression of proximal AD risk genes as an antecedent AD pathophysiology. Our observations help establish processes that underpin AD genetic risk-related reductions in CBF as a therapeutic target prior to the onset of neurodegeneration.

Keywords: Alzheimer's disease; Cerebral blood flow; Gene expression; Lifespan; Polygenic.


Conflict of interest statement

Declaration of Competing Interest All authors declare no conflict of interest with relevance to the current study.

Figures

Fig. 1
Fig. 1
Regional GM CBF (ml/100g/min) in (A) the younger sample (aged: 18-35) previously described in Chandler et al., 2019 and (B) an older sample (aged: 55-85) and (C) Regional GM CBF (ml/100g/min) comparison for young (x-axis) and old (y-axis) across 82 cortical / subcortical regions.
Fig. 2
Fig. 2
(A) Standardized AD-GRS effects on whole brain GM CBF for the young (18-35) and older (55-85) samples, * indicates p < 0.05, error bars represent 95% confidence intervals. (B) Diagnostic plot, demonstrating individual effects of AD risk (red) and protective (blue) SNPs on whole brain GMCBF, controlling for covariates in the older sample (55-85 years old). Circles / lines represent adjusted effect sizes and 95% confidence intervals. (For interpretation of the references to color in this figure legend, the reader is referred to the Web version of this article.)
Fig. 3
Fig. 3
Regional association between AD-GRS and CBF in both Cardiff (Chandler et al., 2019) and ADNI samples, corrected for false discovery rate (A) (PFDR < 0.05) and uncorrected (B) (PUNCORRCECTED < 0.05). (C) Linear relationship of effect sizes (standardized beta coefficients) across the brain when comparing all cortical regions between sample B & C, where data points represented as an asterisk reflect p < 0.05 in both samples. Each point in the scatter plot represents one cortical / subcortical region. Regression slope grey area represents 95% confidence intervals.
Fig. 4
Fig. 4
(A) Correlation matrix showing expression of AD risk genes. (B) Principal component analysis identified two principal modes of covariation between expression of all AD risk genes across the brain. (C) PC1-2 mapped onto the cortical regions. (D-E). Scatter plots show relationship between regional AD gene expression for PC1 (upper) and PC2 (lower) and regional CBF for the (D) Cardiff sample and (E) the ADNI sample. (D-E) Density plots for the distribution of 10,000 randomly simulated regional values (scaled to CBF range) for PC1-2 for Cardiff (D) and ADNI (E) samples. Solid black vertical lines represent the actual, observed correlation between PC1/2 AD gene expression and regional CBF.

References

    1. Alexander-Bloch AF, Shou H, Liu S, Satterthwaite TD, Glahn DC, Shinohara RT, Vandekar SN, Raznahan A. On testing for spatial correspondence between maps of human brain structure and function. Neuroimage. 2018;178:540–551. - PMC - PubMed
    1. Amen DG, Wu J, George N, Newberg A. Patterns of Regional Cerebral Blood Flow as a Function of Obesity in Adults. J Alzheimers Dis. 2020;77(3):1331–1337. - PMC - PubMed
    1. Arnatkevic Iute A, Fulcher BD, Fornito A. A practical guide to linking brain-wide gene expression and neuroimaging data. NeuroImage. 2019;189:353–367. - PubMed
    1. Bertsch K, Hagemann D, Hermes M, Walter C, Khan R, Naumann E. Resting cerebral blood flow, attention, and aging. Brain Res. 2009;1267:77–88. - PubMed
    1. Bloom GS. Amyloid-beta and tau: The trigger and bullet in Alzheimer disease pathogenesis. Jama Neurol. 2014;71(4):505–508. - PubMed

Publication types