. 2022 Sep 6;34(9):1342-1358.e7.
doi: 10.1016/j.cmet.2022.08.007.

ATF3 and CH25H regulate effector trogocytosis and anti-tumor activities of endogenous and immunotherapeutic cytotoxic T lymphocytes

Affiliations

ATF3 and CH25H regulate effector trogocytosis and anti-tumor activities of endogenous and immunotherapeutic cytotoxic T lymphocytes

Zhen Lu et al. Cell Metab. .

Erratum in

Abstract

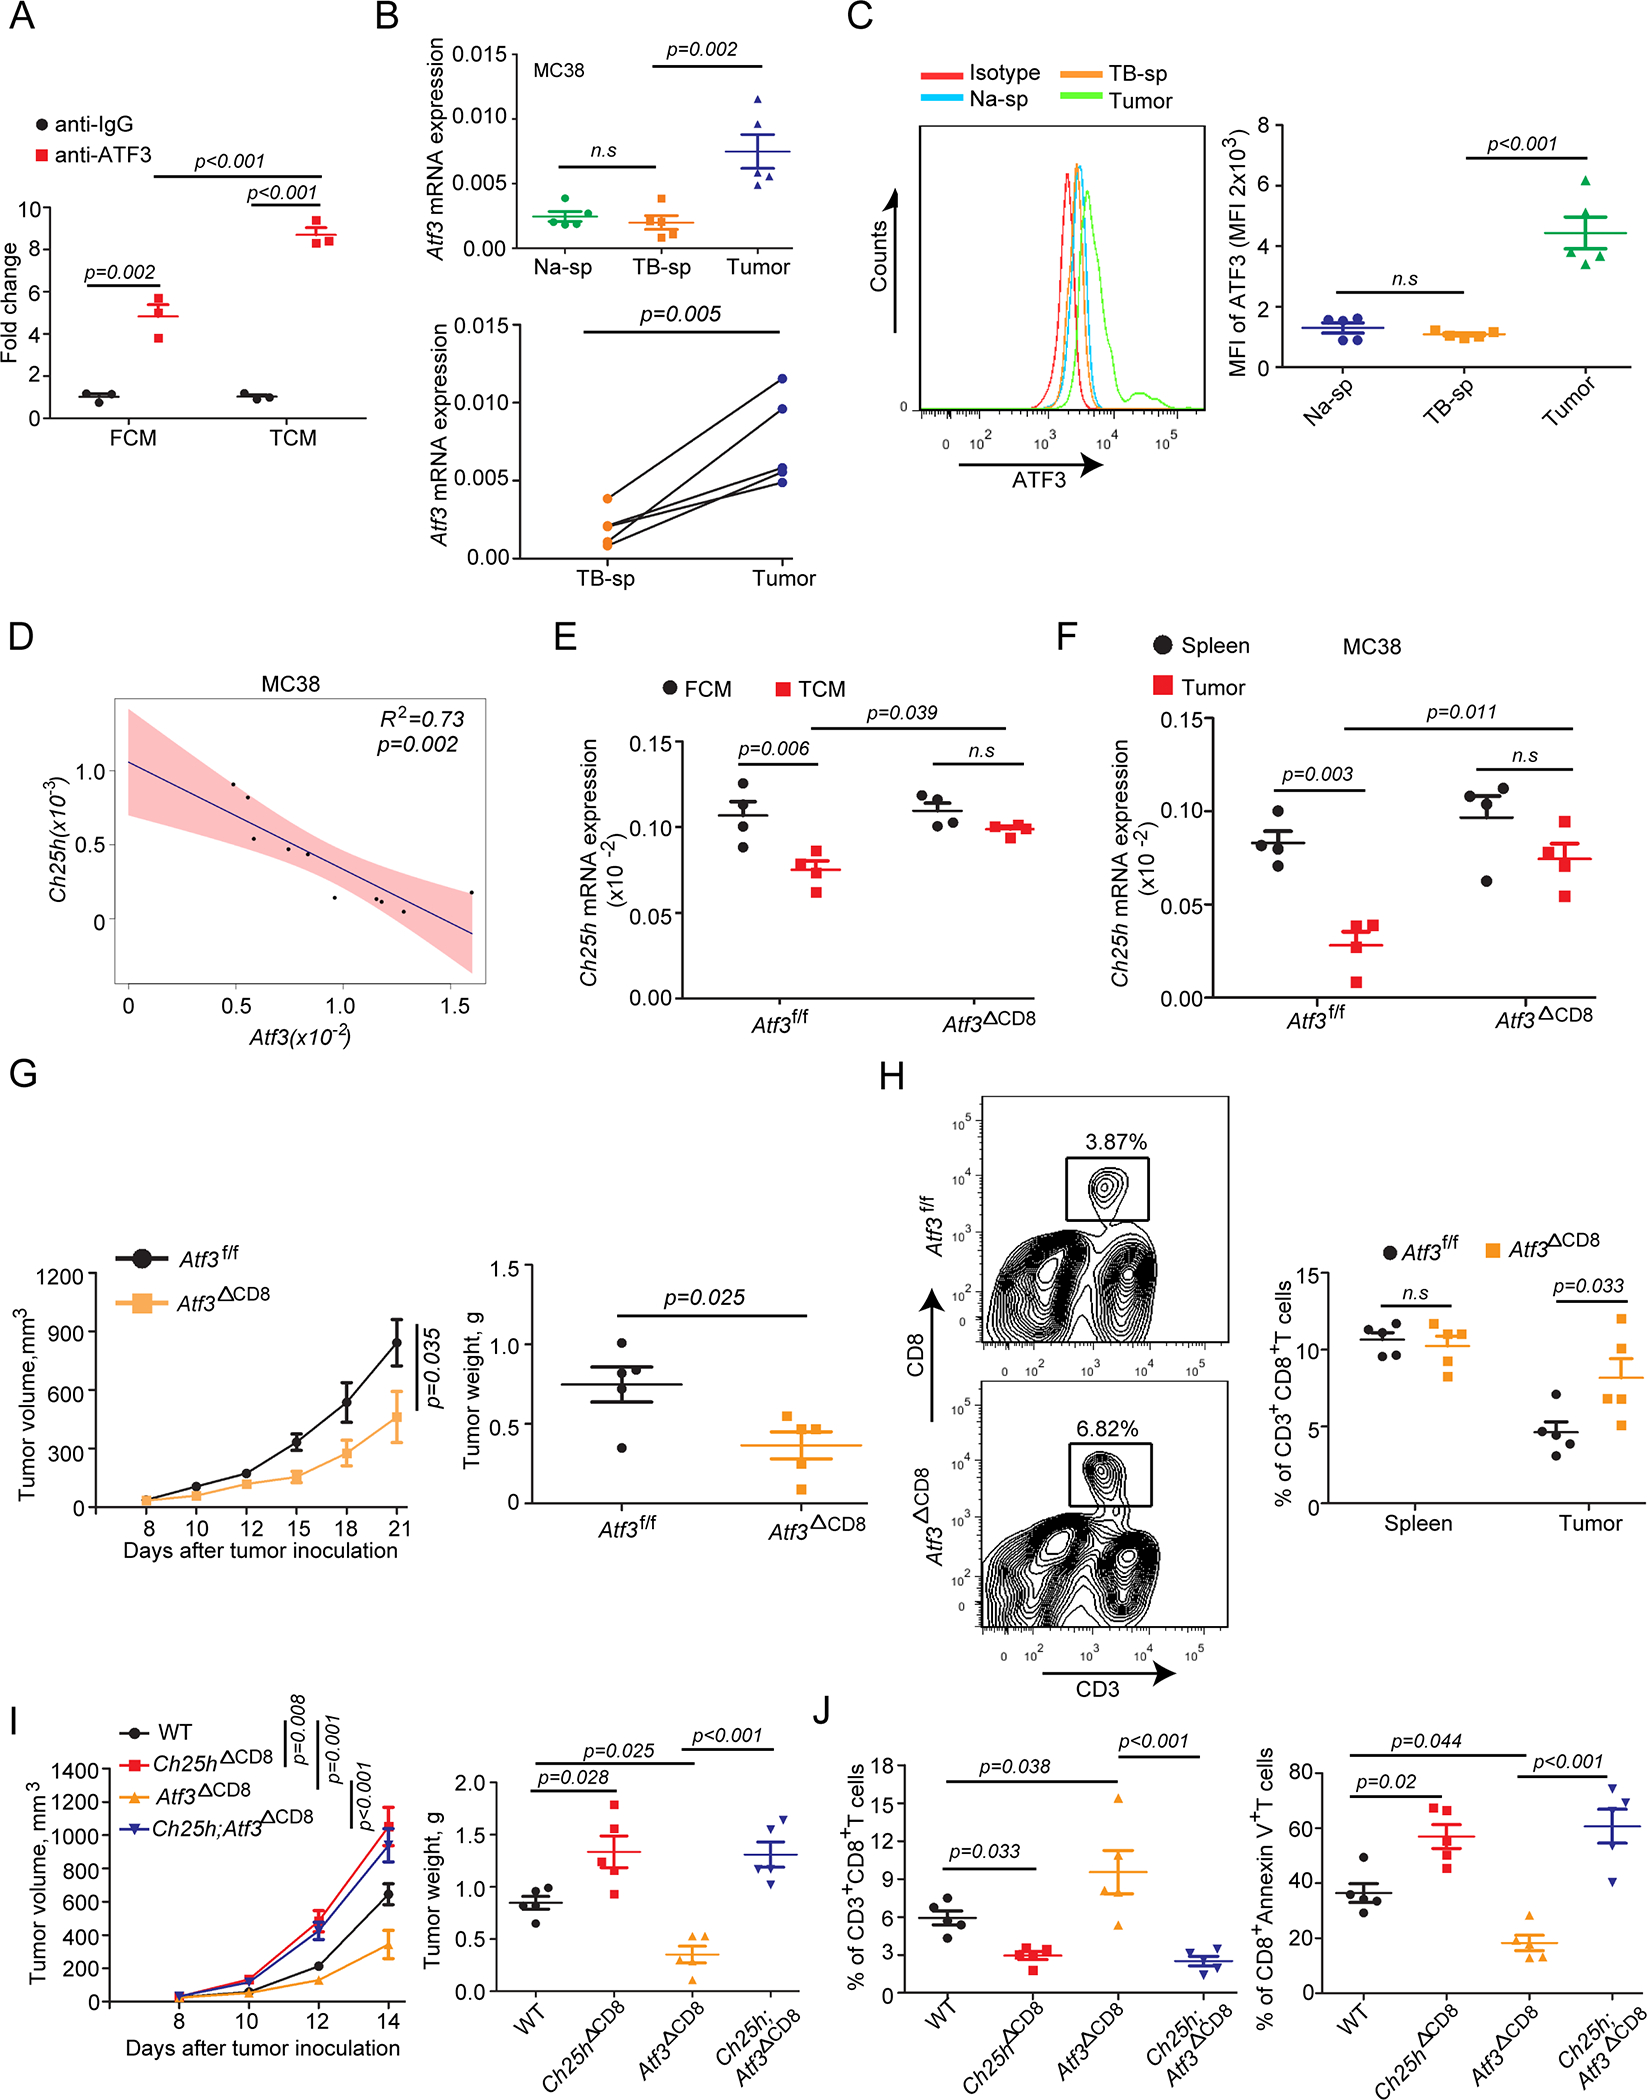
Effector trogocytosis between malignant cells and tumor-specific cytotoxic T lymphocytes (CTLs) contributes to immune evasion through antigen loss on target cells and fratricide of antigen-experienced CTLs by other CTLs. The mechanisms regulating these events in tumors remain poorly understood. Here, we demonstrate that tumor-derived factors (TDFs) stimulated effector trogocytosis and restricted CTLs' tumoricidal activity and viability in vitro. TDFs robustly altered the CTL's lipid profile, including depletion of 25-hydroxycholesterol (25HC). 25HC inhibited trogocytosis and prevented CTL's inactivation and fratricide. Mechanistically, TDFs induced ATF3 transcription factor that suppressed the expression of 25HC-regulating gene-cholesterol 25-hydroxylase (CH25H). Stimulation of trogocytosis in the intratumoral CTL by the ATF3-CH25H axis attenuated anti-tumor immunity, stimulated tumor growth, and impeded the efficacy of chimeric antigen receptor (CAR) T cell adoptive therapy. Through use of armored CAR constructs or pharmacologic agents restoring CH25H expression, we reversed these phenotypes and increased the efficacy of immunotherapies.

Keywords: ATF3; CD8(+) T lymphocytes; CH25H; cancer immunotherapy; chimeric antigen receptor; cytotoxic T lymphocytes; hydroxycholesterol; sumoylation inhibitor; trogocytosis; tumor-derived factors.


Conflict of interest statement

Declaration of interests A.B. and G.S. were employees of and stockholders in Millennium Pharmaceuticals, Inc., a wholly owned subsidiary of Takeda Pharmaceutical Company Limited producing TAK981, while engaged in the research project. Z.L., N.M., and S.Y.F. are listed as inventors on The University of Pennsylvania’s patent application related to the matter described in this manuscript.

Figures

Figure 1.
Figure 1.. Tumor-derived factors (TDFs) downregulate 25-hydroxycholesterol and stimulate trogocytosis between effector CTL and malignant cells
A. Analysis of transfer of DiD dye from DID-labeled OVA-expressing MC38 cells onto co-cultured (for 4 hr) OT-I CD8+ T cells pre-treated with VEGF (50ng/ml), PGE2 (10nM), FCM (fibroblast cell medium), IECM (intestinal epithelial cell medium) or TCM (Tumor conditioned medium) for 8 hr as indicated(n=5). B. KEGG enrichment analysis of altered pathways in CTLs treated with TCM (compared to FCM) for 8 hr (n=3). C. Volcano plot of differentially expressed genes in CTLs treated as in panel B. D. Heatmap of differentially expressed genes in CTLs treated as in panel B (n=3). E. Heatmap of changes in lipid species that occurred in CTLs treated as in panel B (n=4). F. Levels of 25HC in CTLs treated as in panel B (n=4). G. qPCR analysis of Ch25h mRNA expression in CTLs treated with Vehicle, media conditioned by primary mouse intestinal epithelial cells (IECM), or fibroblasts (FCM), or MC38 tumor cells (TCM), or PGE2 (10nM), VEGF (50ng/ml) or MC38 tumor-derived extracellular vesicles (TEVs, 20 μg/mL) for 8 hr (n=4–5). H. qPCR analysis of Ch25h mRNA expression in CD8+ T cells isolated from MC38 tumors or spleens from naïve or MC38 tumor bearing mice (n=5). Na-sp, spleen from naïve mice; TB-sp, spleen from tumor bearing mice. I. Pairwise comparison of Ch25h mRNA expression in CD8+ T cells isolated from tumor and spleen of individual mice (n=5). Data are presented as mean±SEM. Statistical analysis was performed using 2-tailed Students’ t test. n.s, not significant. See also Figure S1.
Figure 2.
Figure 2.. CH25H is a pivotal regulator of CTL trogocytosis, survival and activity
A. Analysis of transfer of OVA-MHC-I complexes from OVA-expressing MC38 cells onto co-cultured (for 4 hr) OT-I CD8+ T cells pre-treated with FCM or IECM or TCM (with or without 25HC, 4μM or GW3965, 2μM) for 8 hr (n=4). B. Number of live CD8+ CTLs after co-culture experiment described in Panel A (n=4). C. Luciferase activity-based analysis of lysis of MC38OVA-luc cells incubated with OT-I CD8+ T cells pre-treated with FCM or IECM or TCM (with or without 25HC, 4μM) for 8hr (n=5). D. A schematic of experiment for assessing the role of Ch25h in viability of CD8+ T cells in vivo (upper panel). Lower panel depicts the flow cytometry analysis of the percentage of CFSE+ CD8+or CFSE CD8+ T cells isolated from the MC38 or MC38-OVA tumors 24 hr after inoculation. E. Quantification of viable CFSE+ or CFSE CD8+ T cells (left) and of transfer of OVA-MHC-I complexes on indicated CTLs (right) from experiment described in Panel D (n=5). F. Analysis of number of live WT or Ch25h−/− OT-I CD8+ T cells cultured alone or with MC38OVA target cells for indicated time (n=3–5). G. Analysis of percentage of apoptotic (Annexin V+) T cells treated as in Panel F (n=3–5). H. Luciferase-based analysis of lysis of MC38OVA-luc cells incubated with WT or CH25H-null OT-I CD8+ T cells at indicated E:T ratios for 4 hr (n=8–10). I. Flow cytometry analysis of expression of indicated markers on the surface of WT or CH25H-null CD8+ OT-I T cells after co-culture with MC38OVA target cells or MC38 cells (as an antigen-lacking control) for 8 hr (n=5). J. Quantification of transfer of OVA-MHC-I complexes from MC38OVA target cells on WT or CH25H-null CD8+ OT-I T cells pre-treated or not with 25HC (4μM for 8 hr) (n=5). K. Numbers of live CTLs from experiment described in Panel J (n=5). L. Percentage of apoptotic CTLs from experiment described in Panel J (n=5). M. Luciferase-based analysis of lysis of MC38OVA-luc cells incubated with WT or CH25H-null OT-I CD8+ T cells pre-treated or not with 25HC (4μM for 8hr) (n=5). Data are presented as mean±SEM. Statistical analysis was performed using 2-tailed Students’ t test (A and C) or 1-way ANOVA with Tukey’s multiple-comparison test (B, E, F, G, H, I, J, K, L and M). n.s, not significant. See also Figure S2.
Figure 3.
Figure 3.. Downregulation of CH25H in CTLs attenuates the immune responses and promote tumor growth
A. Association between CH25H expression and progress free survival in human melanoma patients. B. Association between CH25H expression and overall survival in human melanoma patients. C. Growth of B16F10 melanoma tumors (inoculated s.c. at 1×10⁶) in Ch25hf/f and Ch25hΔCD8Cre mice (left; n=9–10) and survival analysis for tumor-bearing animals (right; n=7–8). D. Representative images of B16F10 tumor size (left) and weight (right)at day 15 from experiment described in panel C. E. Immunofluorescence analysis and its quantification for numbers of CD3+CD8+ T cells in MC38 tumors from Ch25hf/f and Ch25hΔCD8Cre mice (n=7–9). Scale bar: 100 μm. F. Flow cytometry analysis of numbers and percentage of CD3+CD8+ T cells in MC38 tumors and spleens from tumor bearing Ch25hf/f and Ch25hΔCD8Cre mice (n=5). G. Flow cytometry analysis of percentage of CD69-expressing CTLs from experiment described in Panel F. H. Flow cytometry analysis of percentage of PD-1-expressing CTLs from experiment described in Panel F. I. Flow cytometry analysis of percentage of Annexin V-expressing CTLs from experiment described in Panel F. Data are presented as mean±SEM. Statistical analysis was performed using 2-tailed Students’ t test (D and E ) or 1-way ANOVA with Tukey’s multiple-comparison test (F, G, H, and I ) or 2-way ANOVA with Sidak’s multiple-comparison test (C) or log-rank (Mantel-Cox) test (A, B, and C ). n.s, not significant. See also Figure S3.
Figure 4.
Figure 4.. ATF3 regulates effector trogocytosis, activity and viability of CTLs, and tumor growth in a CH25H-dependent manner.
A. ChIP-qPCR analysis of ATF3 binding to Ch25h promoter in OT-I CD8+ T cells treated or not with MC38 TCM for 12 hr (n=3). B. Overall (upper) and pairwise (below) qPCR analysis of Atf3 mRNA levels in CD8+ T cells from MC38 tumor tissue and spleen of naïve or tumor bearing mice (n=5). C. Flow cytometry analysis of ATF3 protein level in CD8+ T cells from MC38 tumor tissue and spleen of naïve or tumor bearing mice (n=5). D. Linear regression analysis of Atf3 and Ch25h mRNA expression in CD8+ T cells isolated from MC38 tumors (n=10). E. Analysis of Ch25h expression in Atf3f/f or Atf3ΔCD8 CD8+ T cells treated in vitro with TCM or FCM for 8 hr (n=5). F. Analysis of Ch25h expression in CD8+T cells isolated from MC38 tumor that grew in Atf3f/f or Atf3ΔCD8 mice (n=5). G. Volume and weight of MC38 s.c. tumors that grew in Atf3f/f or Atf3ΔCD8 mice (n=5). H. Flow cytometry assay of percentage of CD3+CD8+ T cells in MC38 tumors from Atf3f/f or Atf3ΔCD8 mice (n=5). I. Volume and weight of B16F10 tumors that grew in WT, Ch25hΔCD8, Atf3ΔCD8 or Ch25h;Atf3ΔCD8 mice (n=5). J. Percentage of CD3+CD8+ T cells and Annexin V-positive CD3+CD8+ T cells from experiment described in panel I (n=5). Data are presented as mean±SEM. Statistical analysis was performed using 2-tailed Students’ t test (B, C and G), linear regression analysis (D), 1-way ANOVA with Tukey’s multiple-comparison test (A, E, F, H, I and J) or 2-way ANOVA with Sidak’s multiple-comparison test (G and I). n.s, not significant. See also Figure S4.
Figure 5.
Figure 5.. ATF3 and CH25H control trogocytosis and activity of CAR T cells
A. Flow cytometry analysis of transfer of CD19 from B16F10-hCD19 target cells onto anti-CD19 CAR T cells (co-incubated for 4 hr) produced from WT, Ch25hΔCD8, Atf3ΔCD8 or Atf3;Ch25h ΔCD8 splenic T cells (n=5). B. Flow cytometry analysis of the percentage of CD8+Tim3+ anti-CD19-CAR T cells processed as in Panel A (n=5). C. Flow cytometry analysis of the percentage of CD8+Annexin V+ anti-CD19-CAR T cells processed as in Panel A (n=5). D. Luciferase-based analysis of lysis of B16F10-hCD19-luc cells incubated with indicated anti-CD19 CAR T cells in vitro (n=5). E. Percentage of CD19+ CD8+ T cells isolated from B16F10-hCD19 tumors that grew in Rag1−/− mice treated with WT, Ch25hΔCD8, Atf3ΔCD8 or Ch25h;Atf3ΔCD8 anti-CD19 CAR T cells (n=5). F. Percentage of CD8+ PD-1+ T cells and CD8+Tim3+ T cells isolated from B16F10-hCD19 tumors treated as in Panel E (n=5). G. Percentage and absolute number of CD8+ anti-CD19 CAR+ T cells infiltrated into B16F10-hCD19 tumors treated as in Panel E (n=5). H. Volume and weight of B16F10-hCD19 tumor that grew in Rag1−/− mice treated with indicated anti-CD19 CAR T cells (n=5). I. Survival analysis for mice described in panel H (n=5). Data are presented as mean±SEM. Statistical analysis was performed using 1-way ANOVA with Tukey’s multiple-comparison test (A, B, C, D, E, F, G and H) or 2-way ANOVA with Sidak’s multiple-comparison test (H) or Kaplan-Meier test (I). n.s, not significant. See also Figure S5.
Figure 6.
Figure 6.. TAK981 sumoylation inhibitor upregulates CH25H, inhibits trogocytosis and augments CAR T viability and anti-tumor activities
A. qPCR analysis of Ch25h expression in CTLs treated with FCM or TCM in the presence or absence of TAK981 (0.1μM for 8 hr) (n=4). B. Transfer of OVA-MHC-I complexes from MC38OVA cells onto WT or Ch25h−/− OT-I CTLs pre-treated or not with FCM or TCM (in presence or absence of 0.1μM TAK981) (n=4). C. Expression of CD69 by the intratumoral CTLs isolated from MC38 tumors that grew in Ch25hf/f or Ch25hΔCD8 mice treated with Vehicle (PBS), anti-PD1 antibody (i.p, 5mg/kg every 4 days) and/or TAK981 (i.v, 15mg/kg once a week) as indicated (n=5). D. Expression of PD-1 and Annexin V by the intratumoral CTLs from experiments described in Panel C (n=5). E. Volume of MC38 tumors from experiments described in Panel C (n=5). F. Weight of MC38 tumors from experiments described in Panel C (n=5). G. Survival analysis of animals from experiments described in Panel C. Mice were euthanized when tumor volume reached ~2000 mm3 (n=5). Data are presented as mean±SEM. Statistical analysis was performed using 1-way ANOVA with Tukey’s multiple-comparison test (A, B, C, D, and F) or 2-way ANOVA with Sidak’s multiple-comparison test (E) or Kaplan-Meier test (G). n.s, not significant. See also Figure S6.
Figure 7.
Figure 7.. CARs designed to re-express CH25H inhibit trogocytosis and increase therapeutic efficacy
A. Design of anti-Meso-CAR, anti-Meso-Ch25h CAR, anti-CD19 CAR and anti-CD19-Ch25h CAR constructs. B. Transfer of MESO from EM-Meso-GFP-Luc cells onto WT or CH25H-null anti-MESO or anti-MESO-Ch25h CAR T cells co-cultured for 4 hr (n=5). C. Numbers of live WT or CH25H-null anti-MESO or anti-MESO-Ch25h CAR T cells after co-culture with EM-Meso-GFP-Luc target cells for 8 hr (n=5). D. Luciferase-based analysis of killing of EM-Meso-GFP-Luc target cells by WT or CH25H-null anti-MESO or anti-MESO-Ch25h CAR T cells (n=5). E. A schematic of experiment for comparing the efficacy of anti-Meso-CAR and anti-MESO-Ch25h T cells in vivo. F. Volume of EM-Meso-GFP-Luc tumors (inoculated s.c. at 1×10⁶) in NSG mice treated with vehicle, Meso-CAR T cells or Meso-Ch25h CAR T cells as indicated in Panel E (n=6). Kaplan-Meier survival analysis of survival of tumor–bearing mice (euthanized when tumors reached 1000 mm3) is shown on the right (n=7). G. Quantification of percentage (left) and absolute numbers (right) of CD3+CD8+ T cells (i.e. CAR T cells) in EM-Meso-GFP-Luc tumors (upper panels) and blood (bottom panels) from NSG mice treated as in Panel E (n=5). H. Volume of B16F10-hCD19 tumors (inoculated s.c. at 0.3×10⁶) growing in Rag1−/− mice treated with vehicle or indicated CAR T cells generated from WT or Ch25h−/− splenocytes using anti-CD19 CAR or anti-CD19-Ch25h CAR constructs as indicated (upper panel). Kaplan-Meier survival analysis of survival of tumor–bearing mice (euthanized when tumors reached 1000 mm3) is shown on the bottom (n=5). I. A schematic of experiment for comparing the efficacy of human anti-CD19 and anti-CD19-Ch25h CAR T cells in the model of NALM6 acute lymphoblastic leukemia in NSG mice. J. Numbers of indicated CAR T cells in blood of NSG mice at day 17, 24 and 31 after injection of NALM6 leukemic cells (n=6). K. Numbers of NALM6 cell in blood of NSG mice at day 17, 24 and 31 after injection of NALM6 leukemic cells (n=5–6). L. Survival analysis of NALM6 leukemia cells-bearing mice treated with PBS or indicated CAR T cells (n=5). Data are presented as mean±SEM. Statistical analysis was performed using 1-way ANOVA with Tukey’s multiple-comparison test (B, C and D) or 2-way ANOVA with Sidak’s multiple-comparison test (F, H and L) or Kaplan-Meier test (F, H and L) or 2-tailed Students’ t test (G, J and K). n.s, not significant. See also Figure S7.

References

    1. Ahmed KA, Munegowda MA, Xie Y, and Xiang J (2008). Intercellular trogocytosis plays an important role in modulation of immune responses. Cell Mol Immunol 5, 261–269. 10.1038/cmi.2008.32. - DOI - PMC - PubMed
    1. Amorim CF, Novais FO, Nguyen BT, Misic AM, Carvalho LP, Carvalho EM, Beiting DP, and Scott P (2019). Variable gene expression and parasite load predict treatment outcome in cutaneous leishmaniasis. Sci Transl Med 11. 10.1126/scitranslmed.aax4204. - DOI - PMC - PubMed
    1. Anggakusuma Romero-Brey I, Berger C, Colpitts CC, Boldanova T, Engelmann M, Todt D, Perin PM, Behrendt P, Vondran FW, et al. (2015). Interferon-inducible cholesterol-25-hydroxylase restricts hepatitis C virus replication through blockage of membranous web formation. Hepatology 62, 702–714. 10.1002/hep.27913. - DOI - PubMed
    1. Baek AE, Yu YA, He S, Wardell SE, Chang CY, Kwon S, Pillai RV, McDowell HB, Thompson JW, Dubois LG, et al. (2017). The cholesterol metabolite 27 hydroxycholesterol facilitates breast cancer metastasis through its actions on immune cells. Nat Commun 8, 864. 10.1038/s41467-017-00910-z. - DOI - PMC - PubMed
    1. Barysch SV, Stankovic-Valentin N, Miedema T, Karaca S, Doppel J, Nait Achour T, Vasudeva A, Wolf L, Sticht C, Urlaub H, and Melchior F (2021). Transient deSUMOylation of IRF2BP proteins controls early transcription in EGFR signaling. EMBO Rep 22, e49651. 10.15252/embr.201949651. - DOI - PMC - PubMed

Publication types

Substances