. 2022 Sep 6;34(9):1394-1409.e4.
doi: 10.1016/j.cmet.2022.08.014.

3D chromatin maps of the human pancreas reveal lineage-specific regulatory architecture of T2D risk

Affiliations

3D chromatin maps of the human pancreas reveal lineage-specific regulatory architecture of T2D risk

Chun Su et al. Cell Metab. .

Abstract

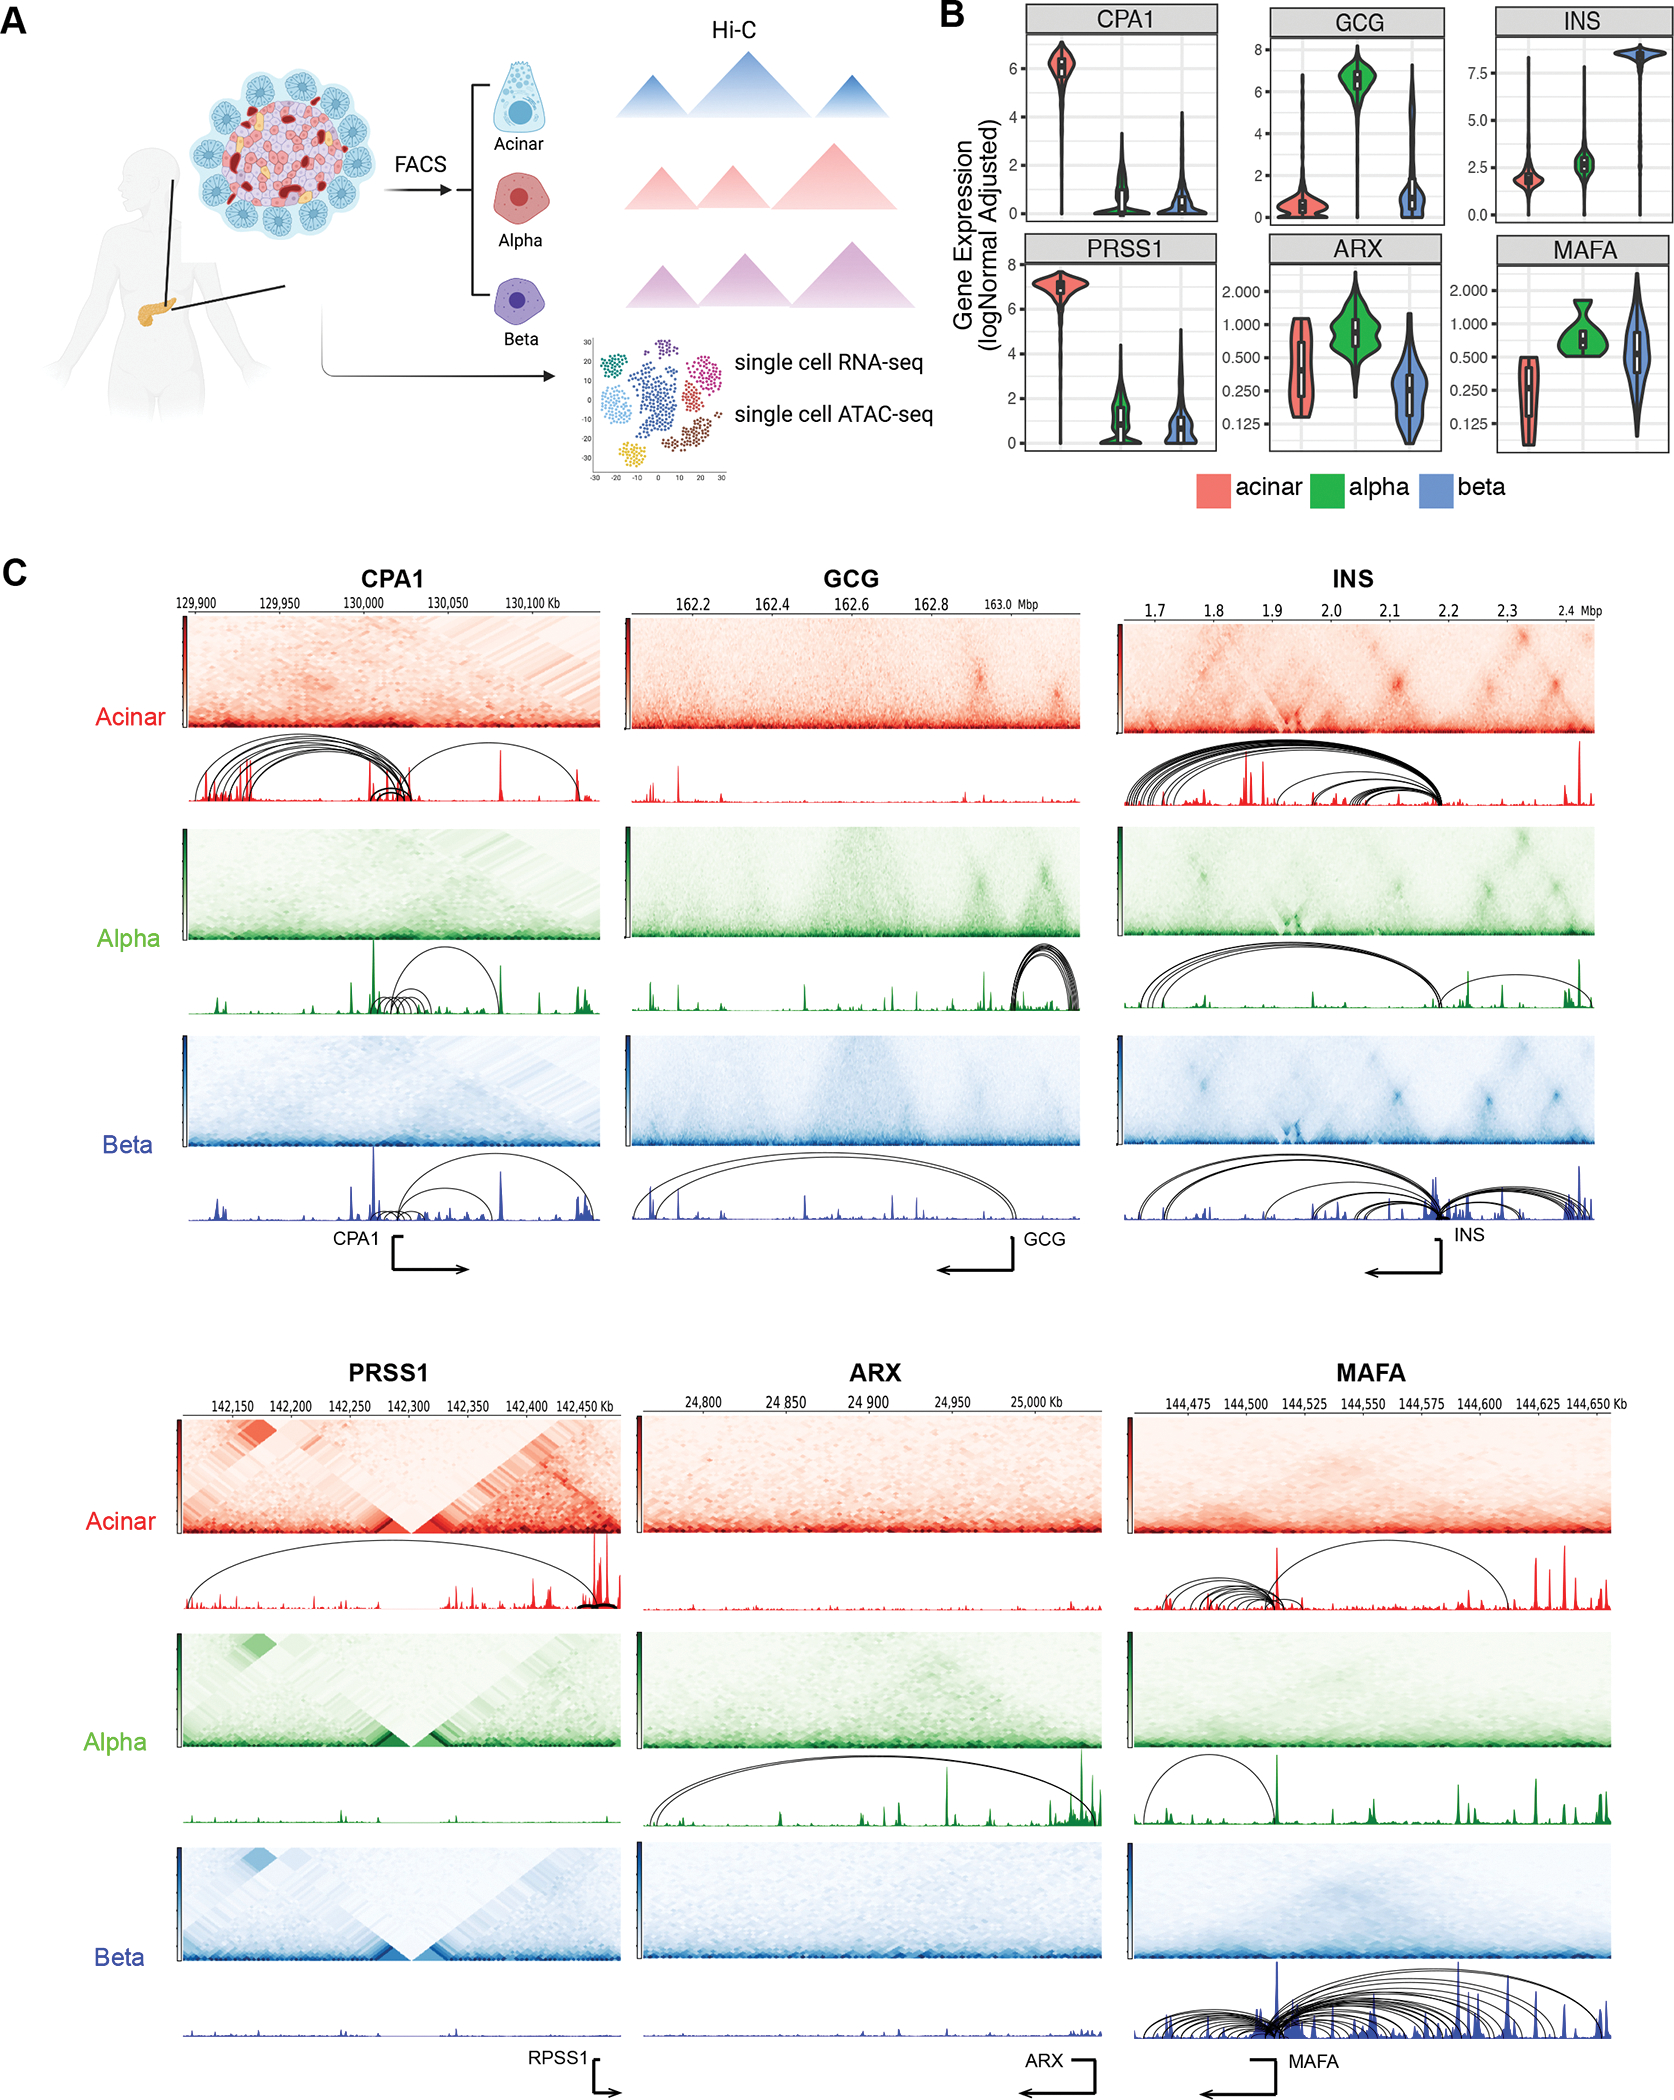
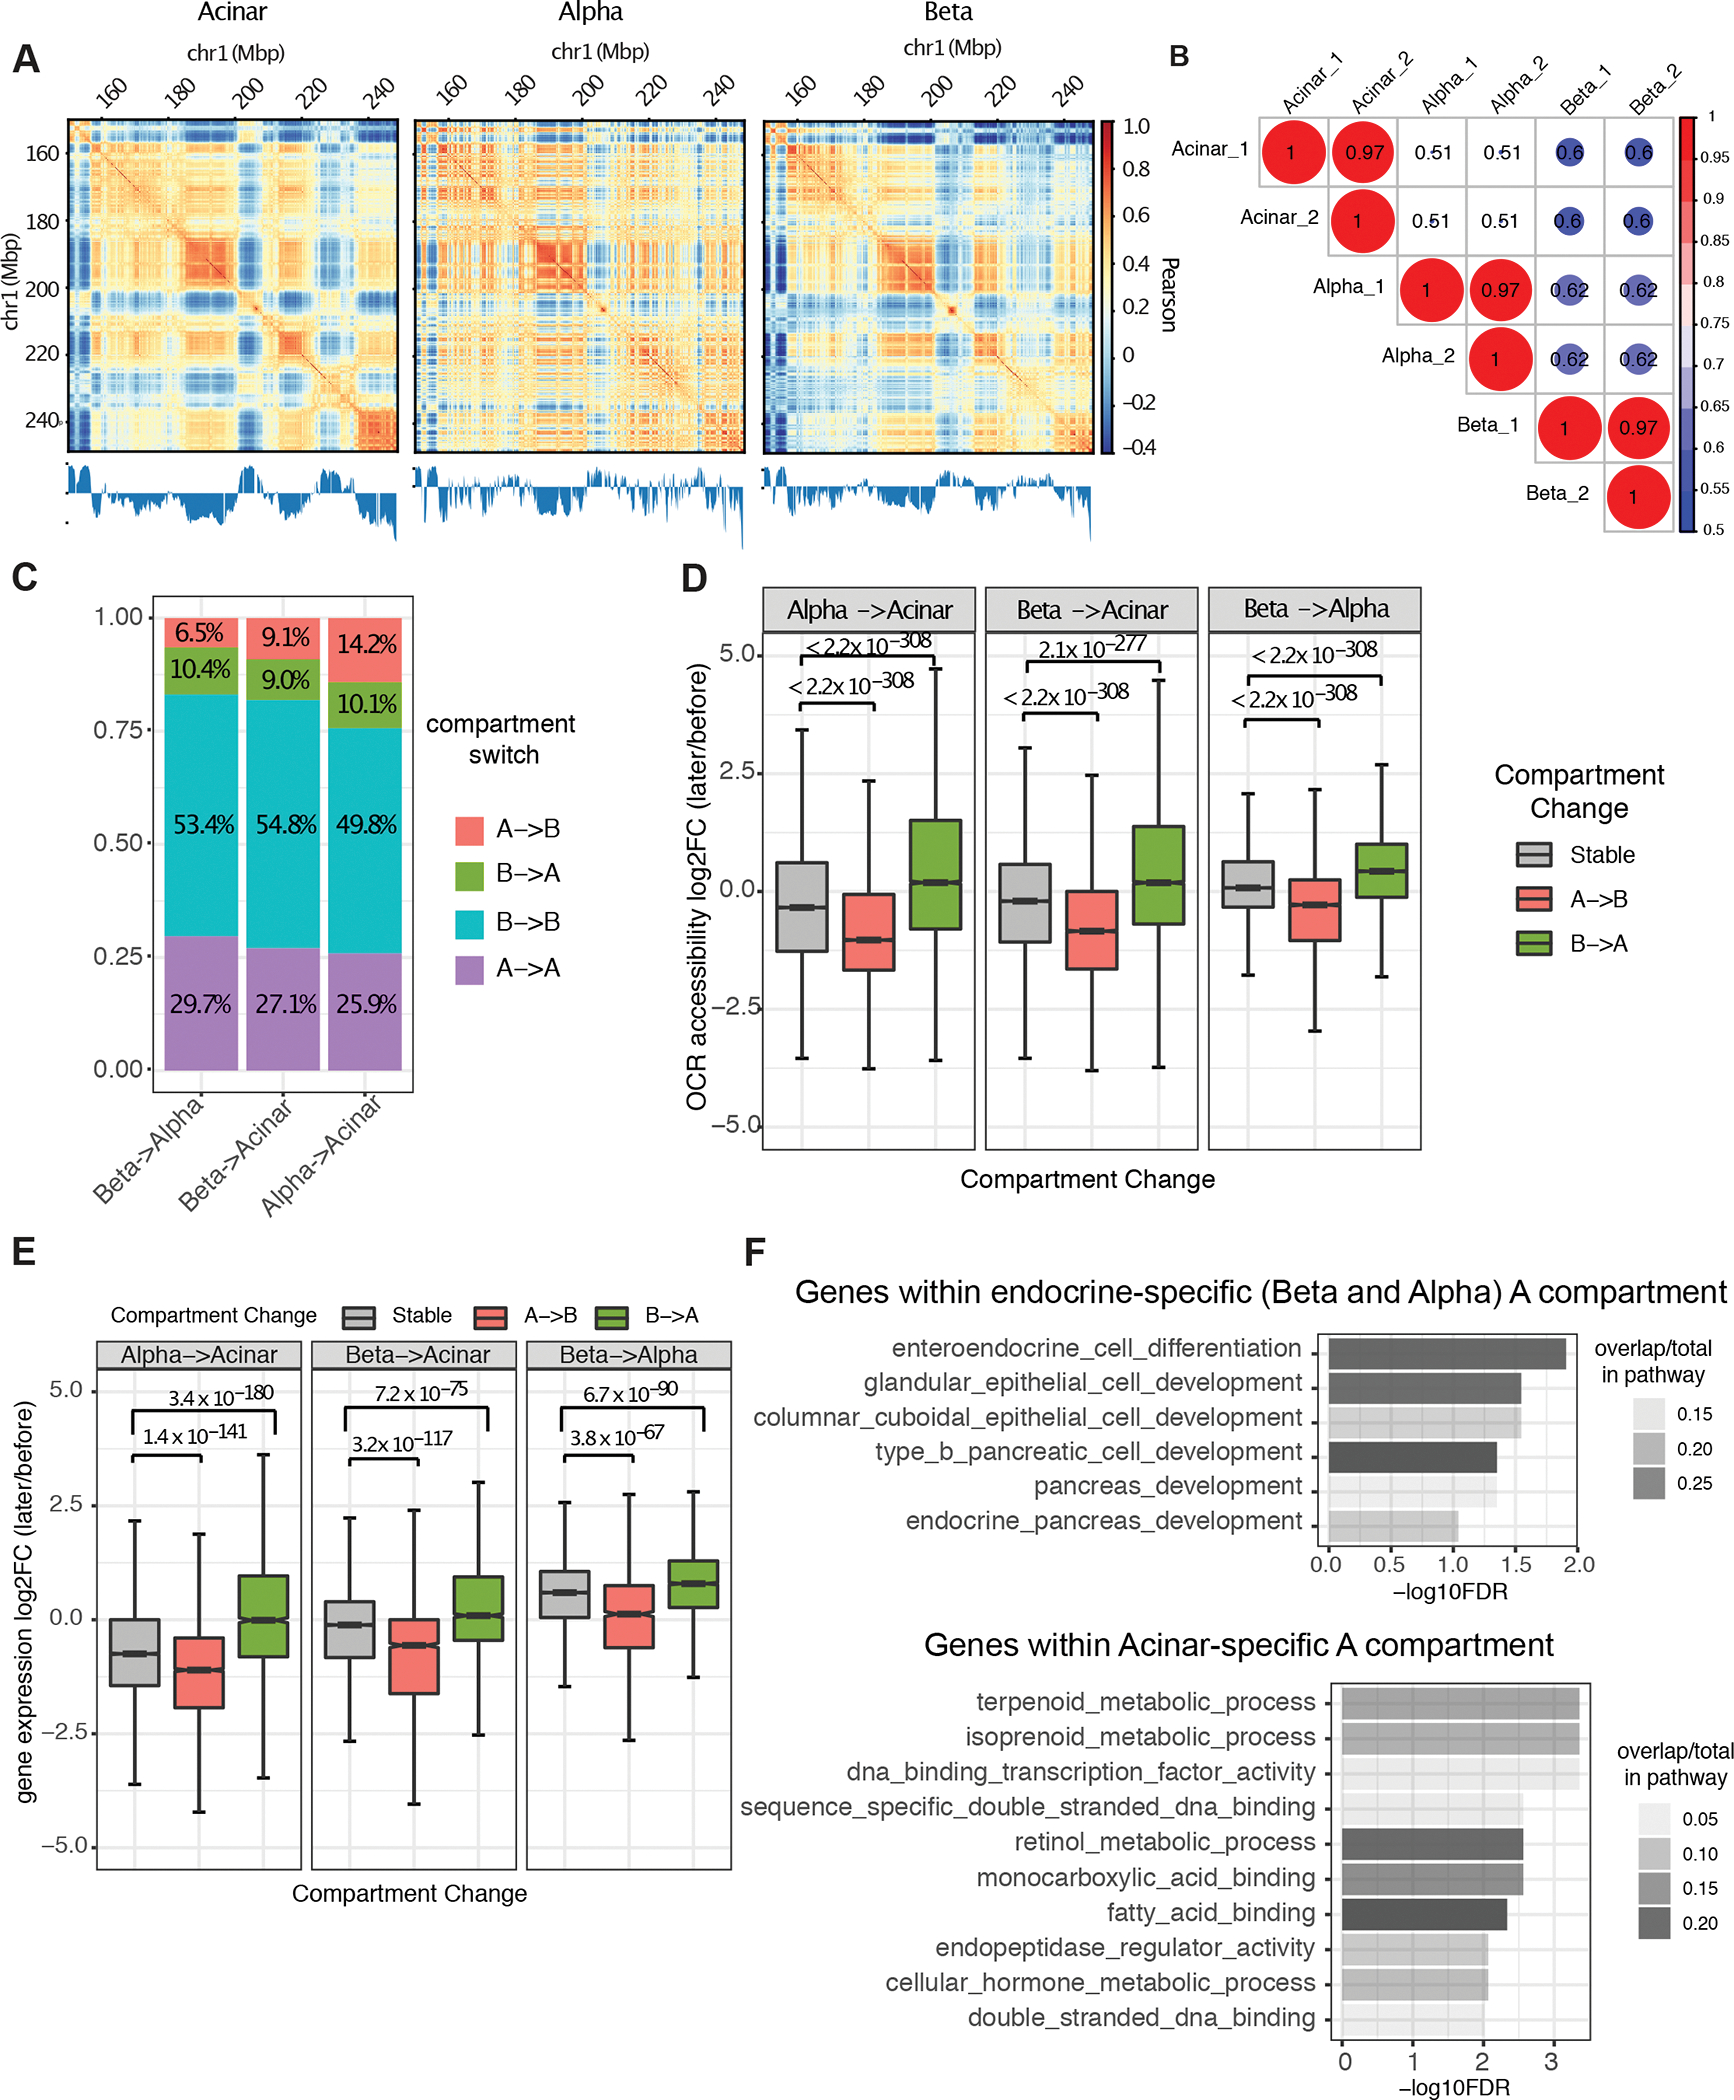
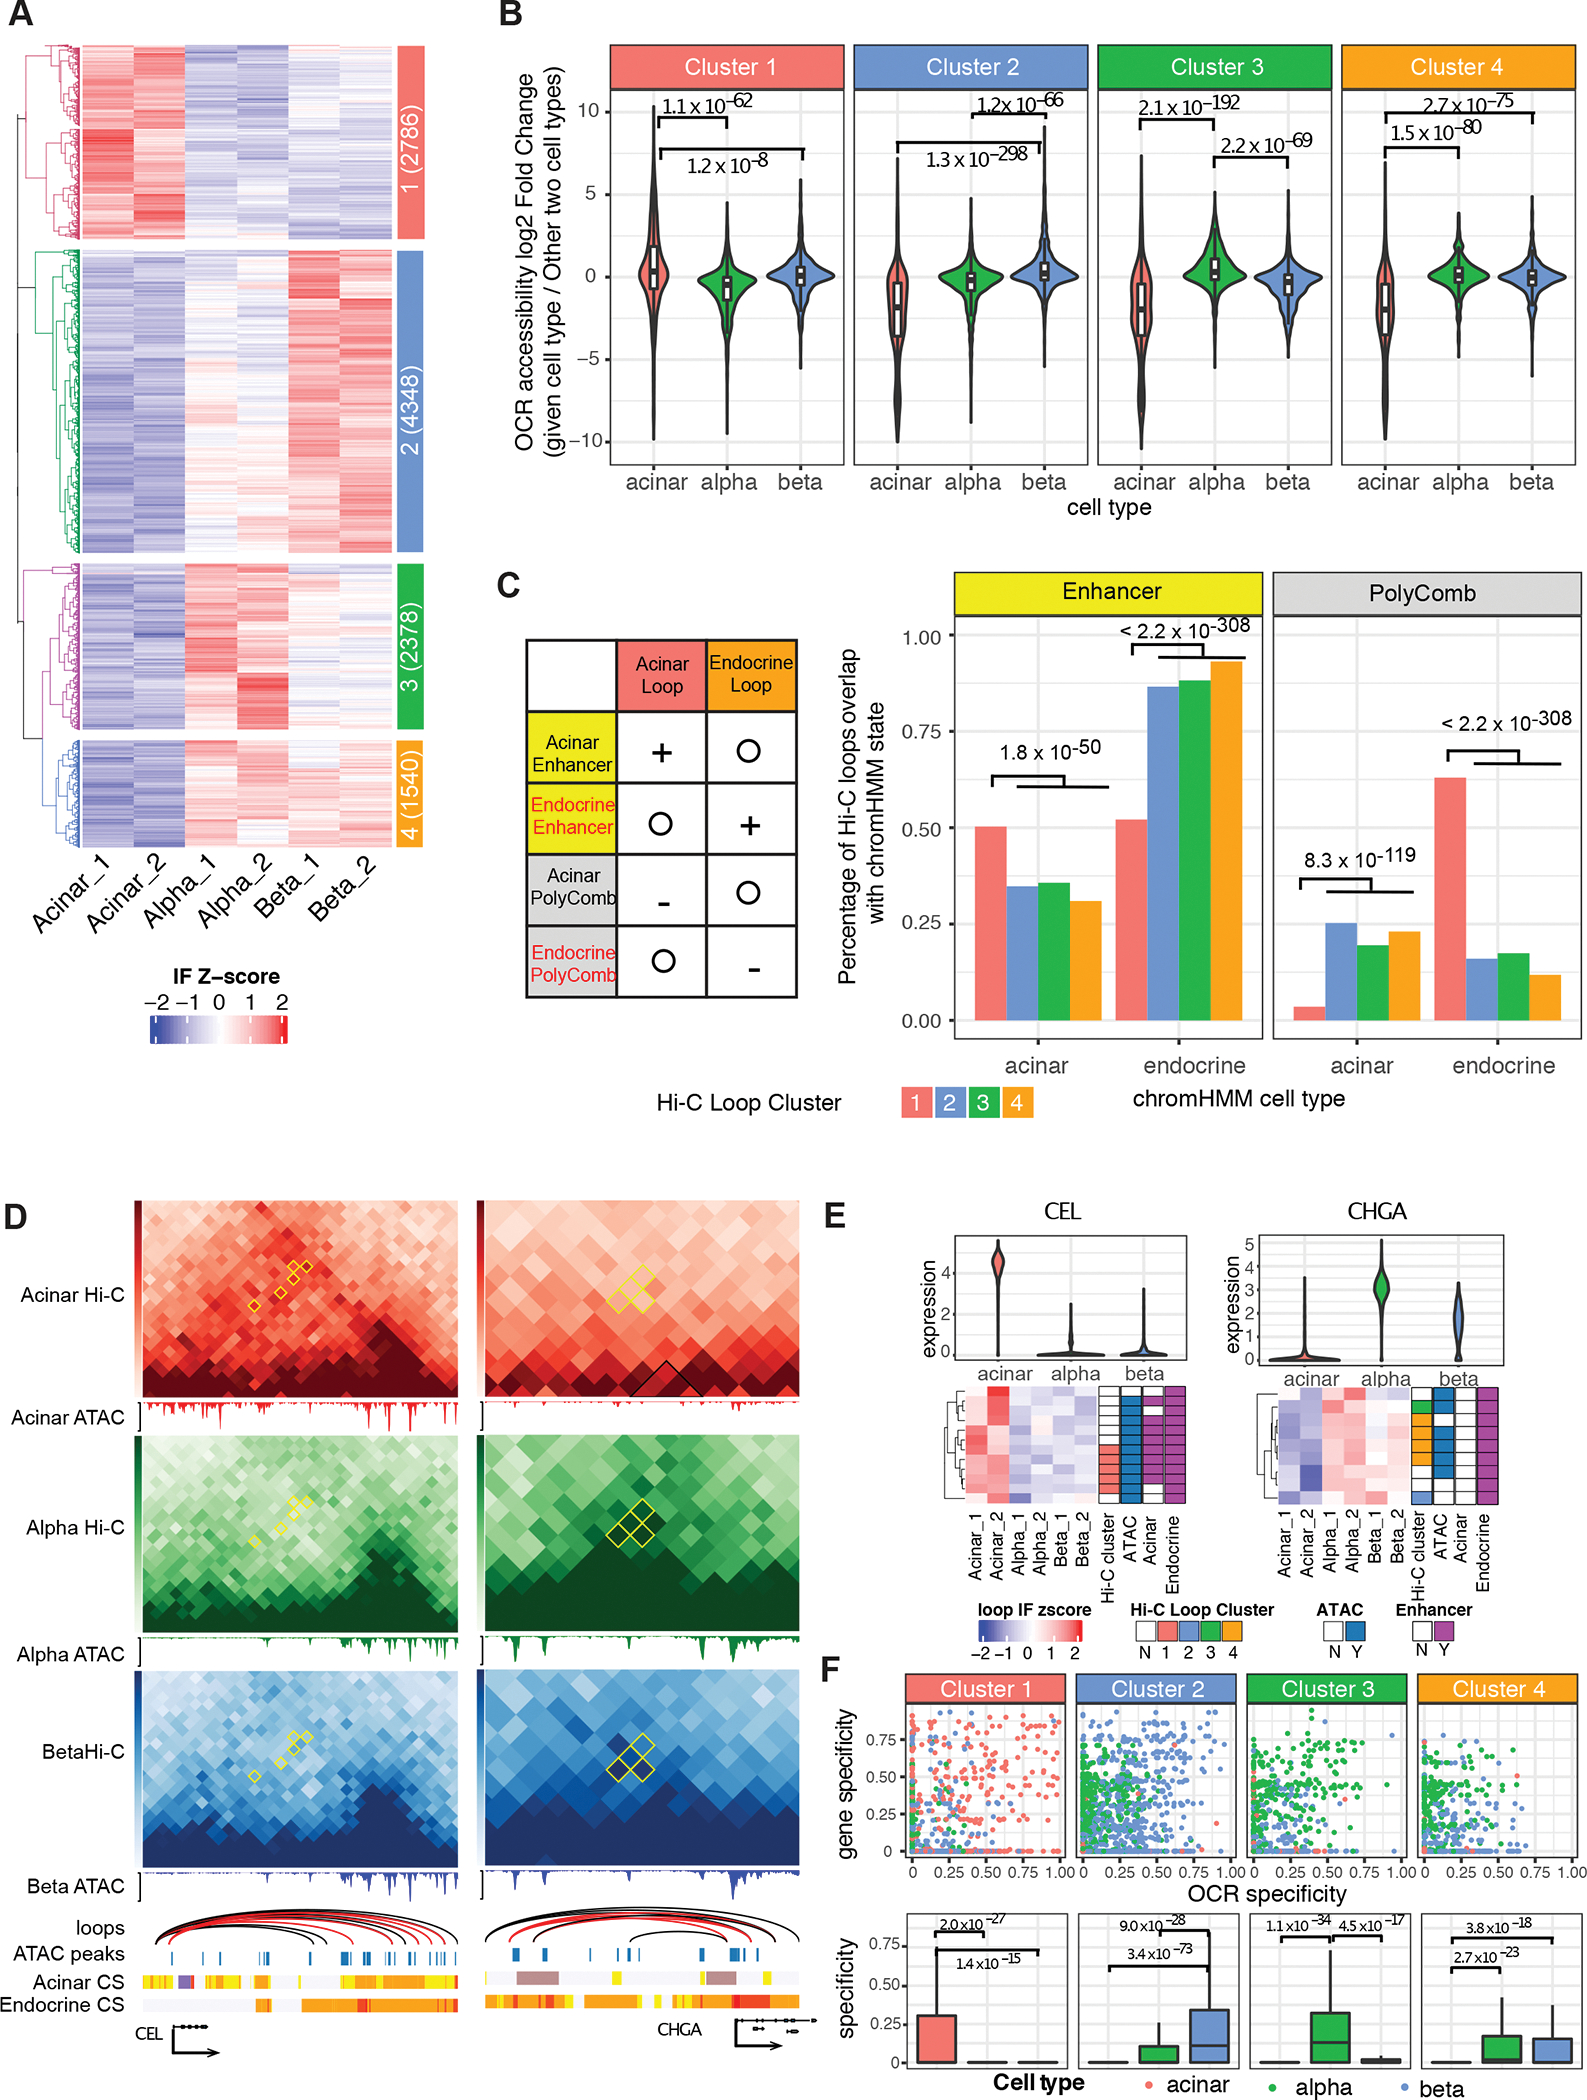
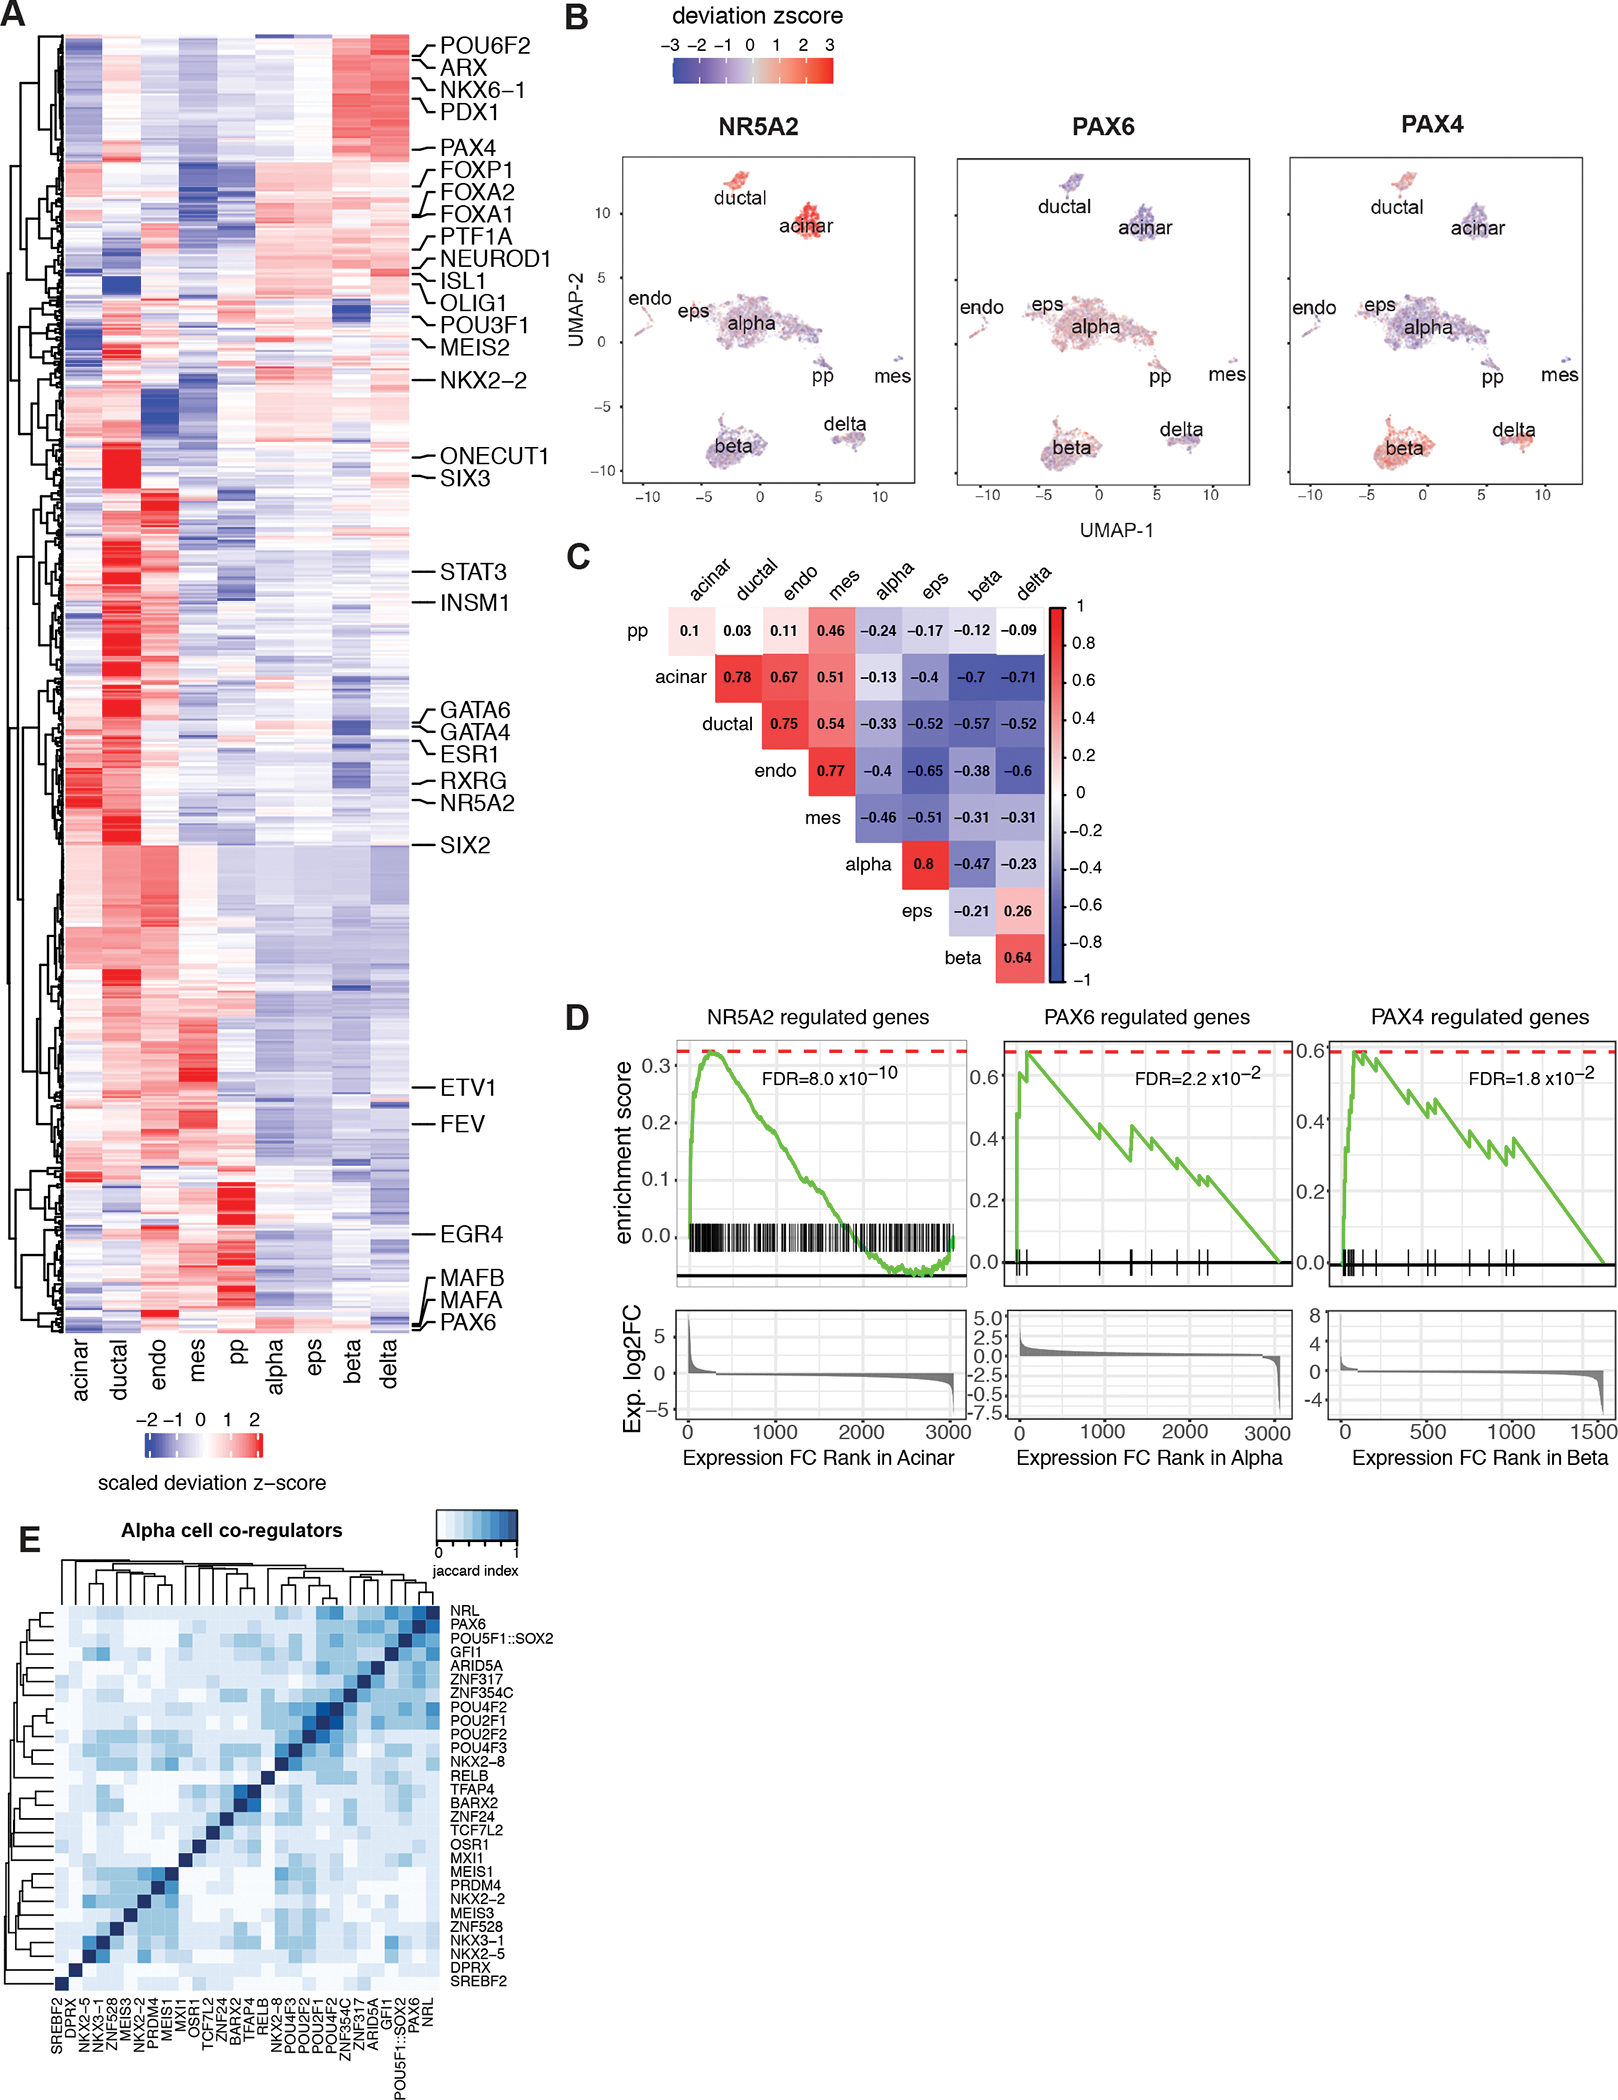
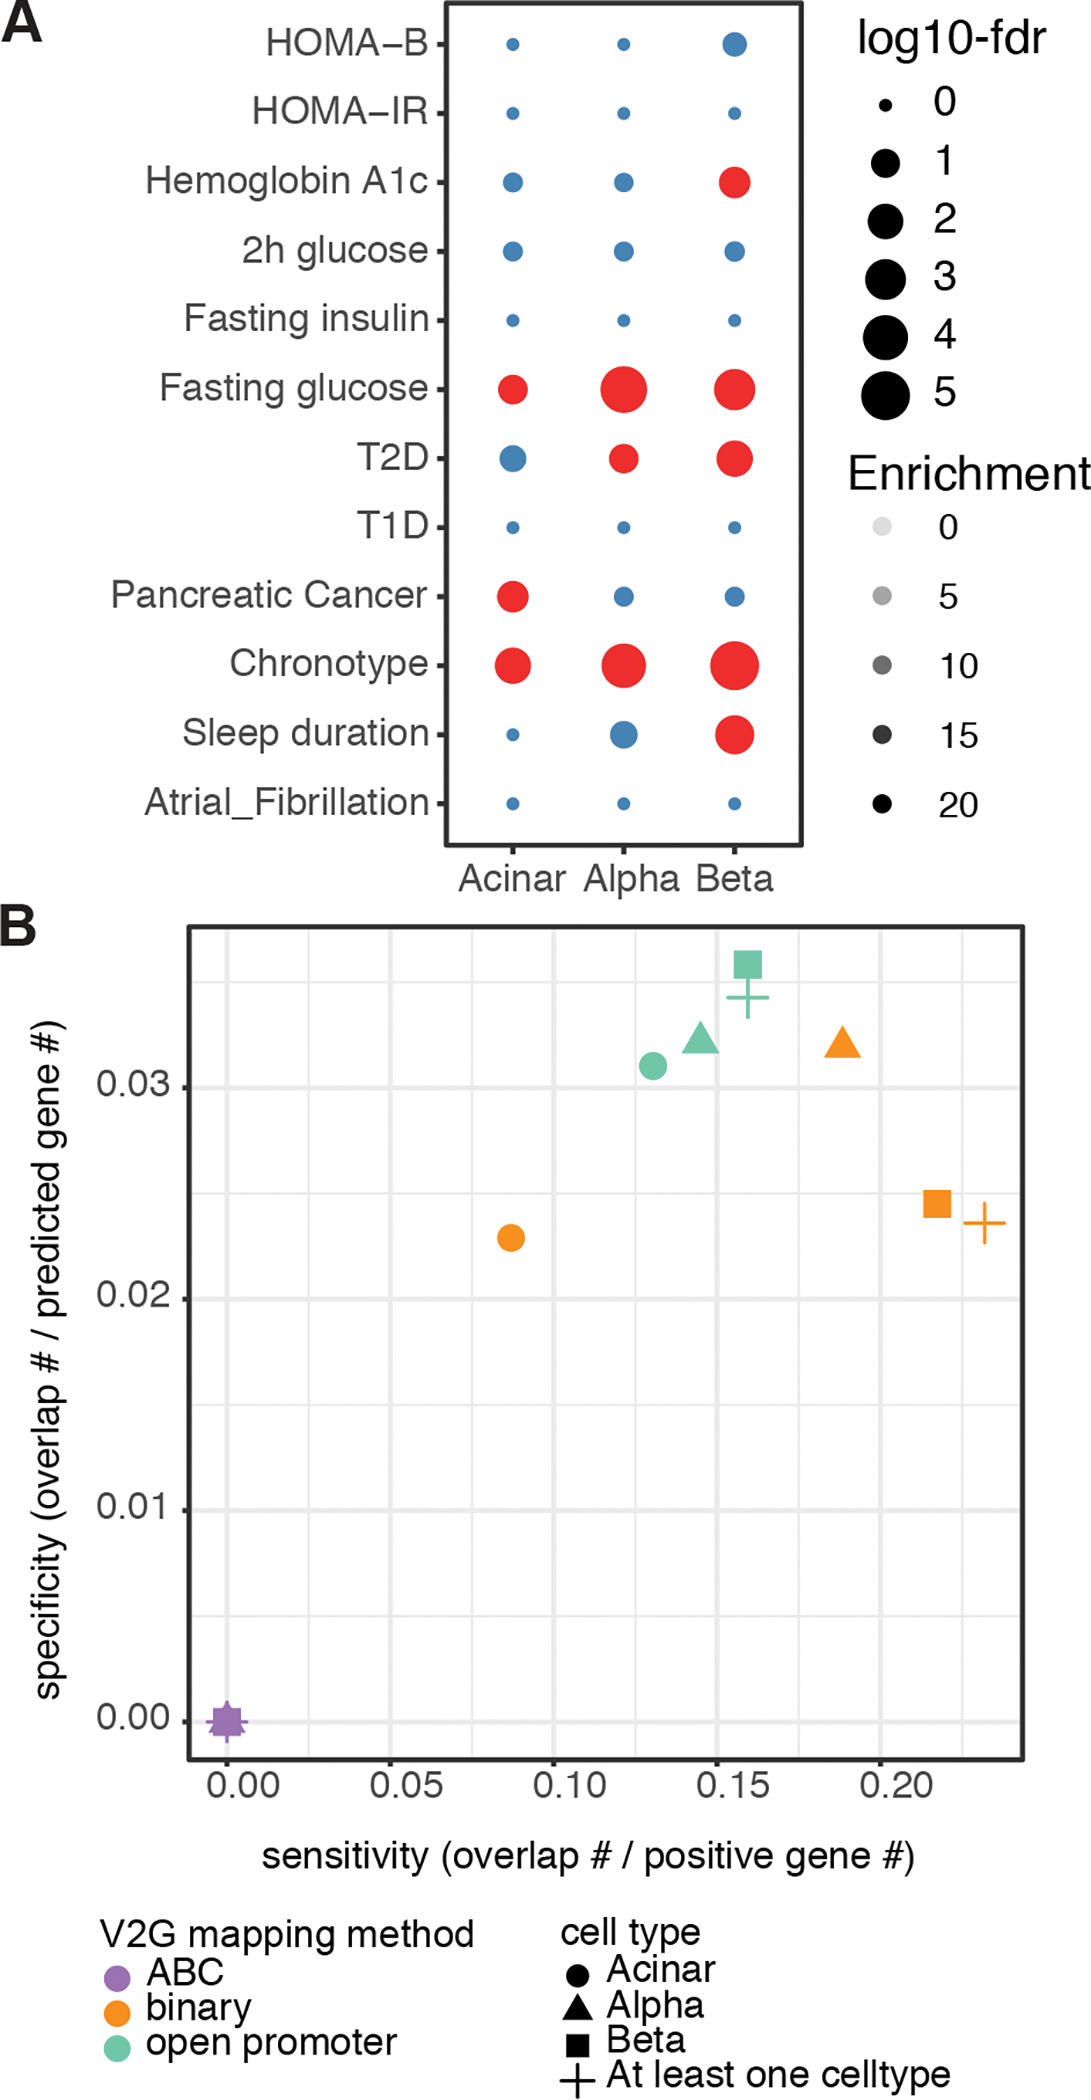
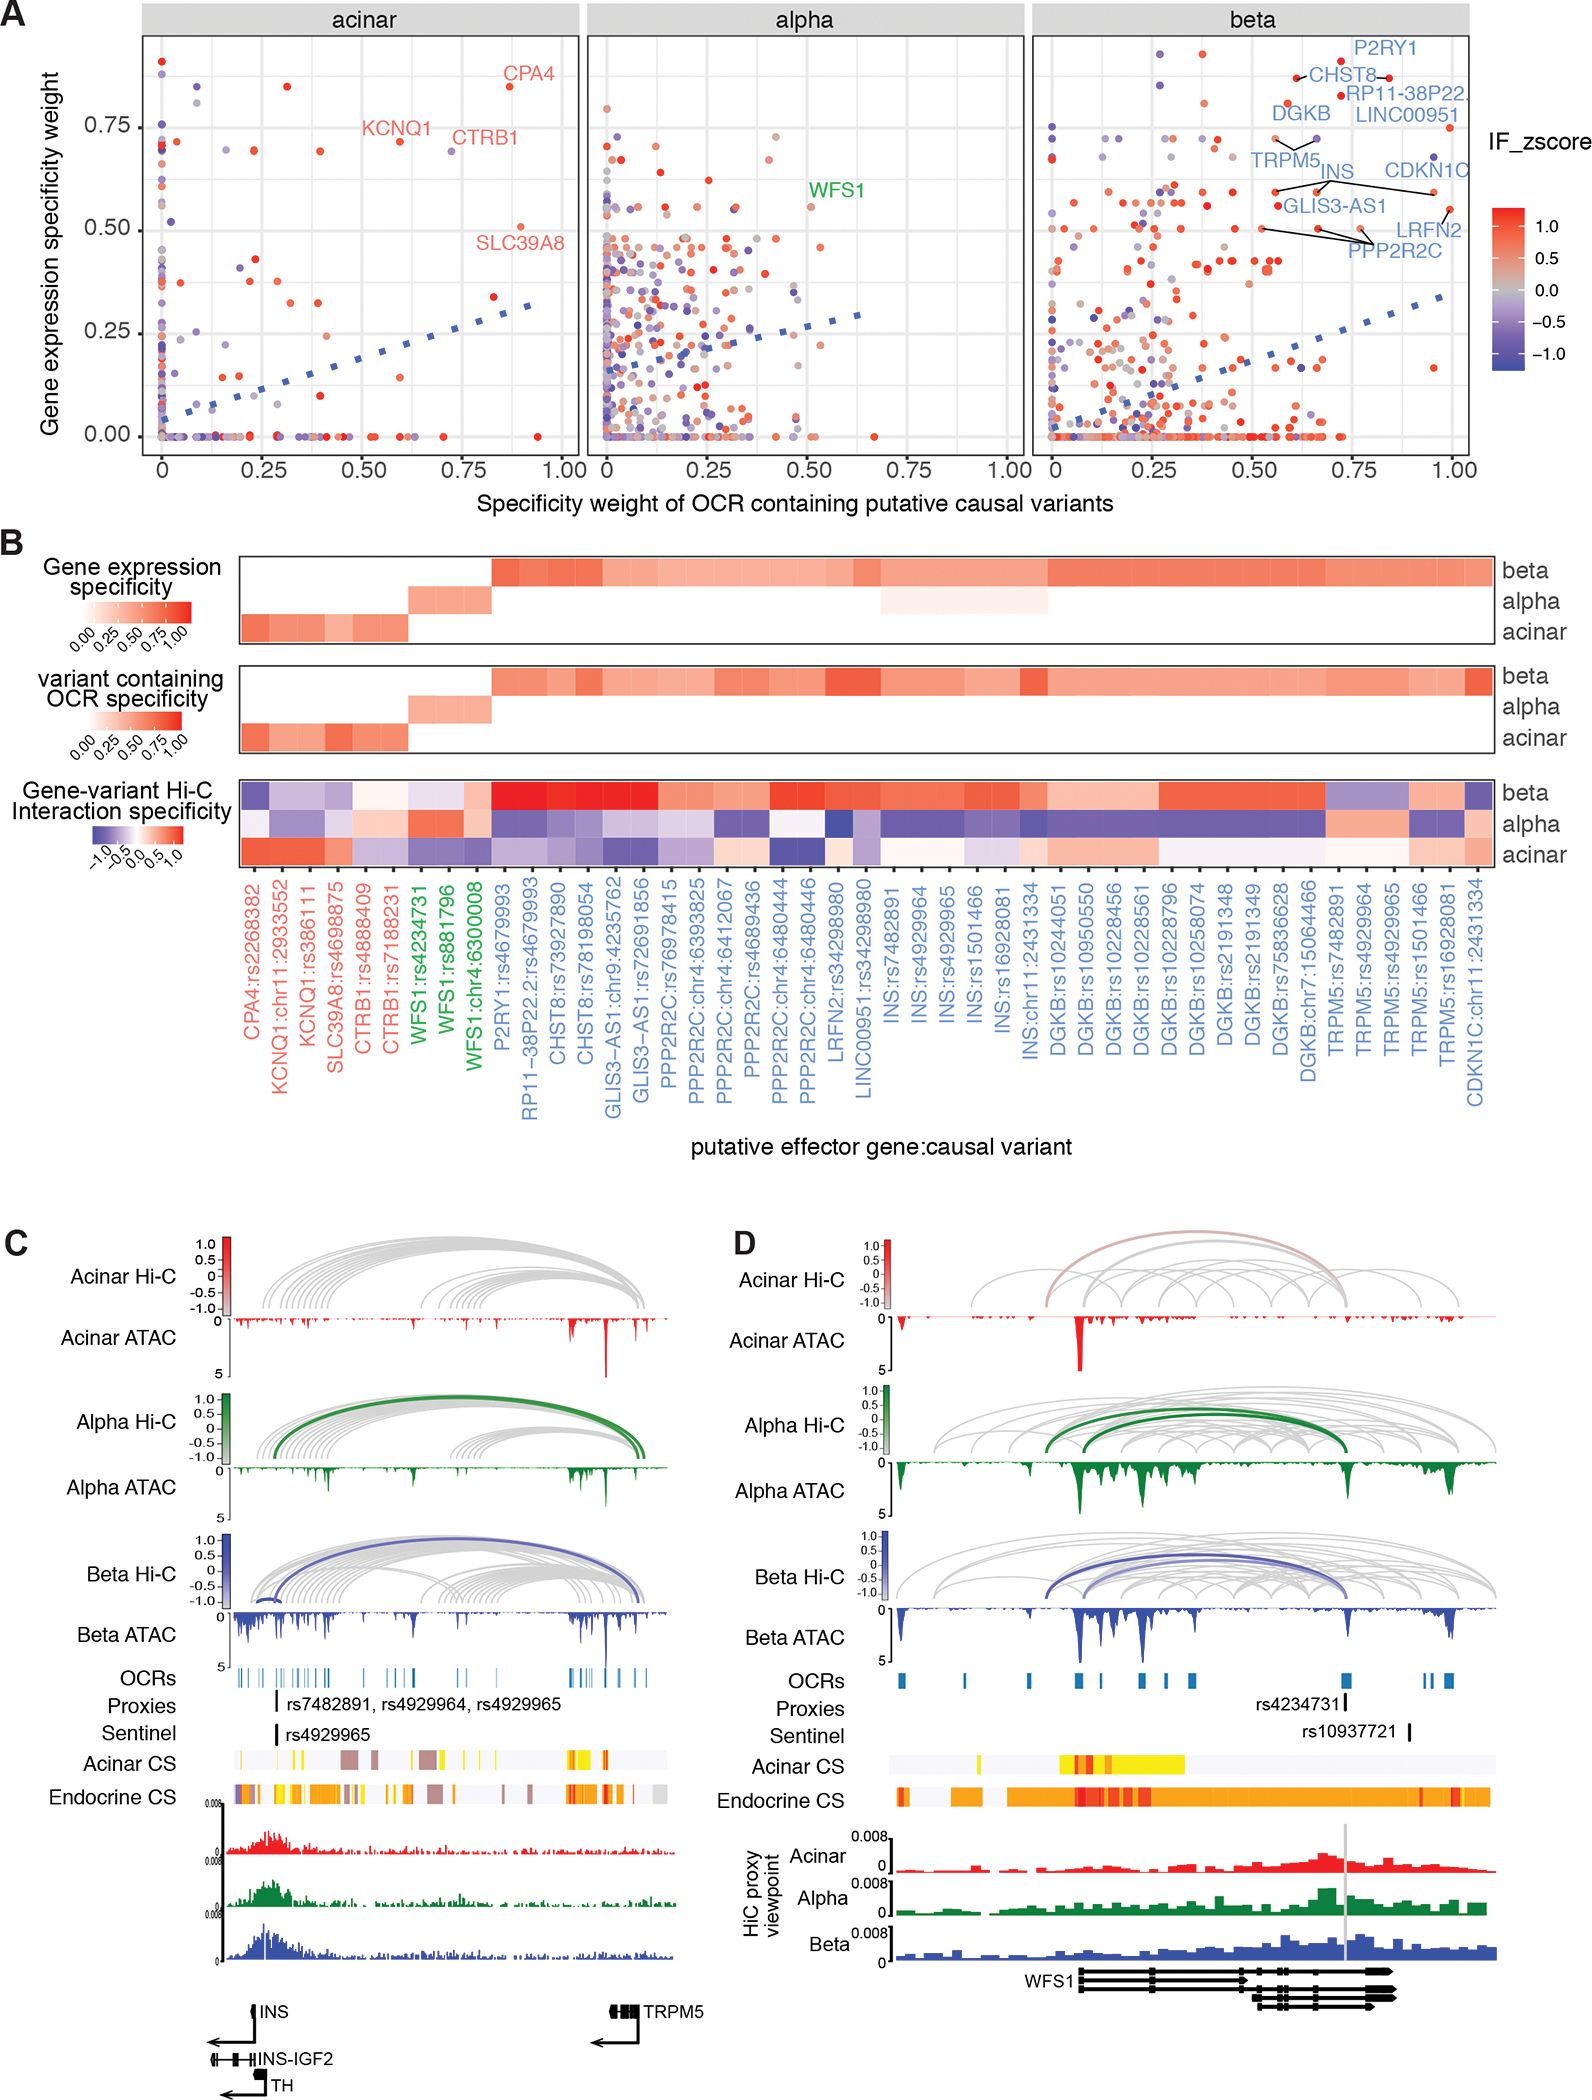
Three-dimensional (3D) chromatin organization maps help dissect cell-type-specific gene regulatory programs. Furthermore, 3D chromatin maps contribute to elucidating the pathogenesis of complex genetic diseases by connecting distal regulatory regions and genetic risk variants to their respective target genes. To understand the cell-type-specific regulatory architecture of diabetes risk, we generated transcriptomic and 3D epigenomic profiles of human pancreatic acinar, alpha, and beta cells using single-cell RNA-seq, single-cell ATAC-seq, and high-resolution Hi-C of sorted cells. Comparisons of these profiles revealed differential A/B (open/closed) chromatin compartmentalization, chromatin looping, and transcriptional factor-mediated control of cell-type-specific gene regulatory programs. We identified a total of 4,750 putative causal-variant-to-target-gene pairs at 194 type 2 diabetes GWAS signals using pancreatic 3D chromatin maps. We found that the connections between candidate causal variants and their putative target effector genes are cell-type stratified and emphasize previously underappreciated roles for alpha and acinar cells in diabetes pathogenesis.

Keywords: 3D chromatin maps; acinar cell; alpha cell; beta cell; islets of Langerhans; type 2 diabetes.


Conflict of interest statement

Declaration of interests The authors declare no competing interests.

Figures

Figure 1.
Figure 1.. General validation of transcriptomic, chromatin accessibility and 3D architecture profiles in human pancreas cell subsets.
A, Experimental design used in this study. Pancreatic islets obtained from 3 human donors were used for single cell experiments. Acinar, alpha and beta cells from 5 human donors were purified using FACS and followed by Arima Hi-C assays. See also Supplemental Table S1B, Single-cell expression profiles for selected marker genes. Acinar: CPA1 and PRSS1; alpha: GCG and ARX; beta: INS and MAFA. C, Aggregate single-cell chromatin accessibility, Hi-C contact frequency matrix and chromatin loops for selected marker genes. Hi-C contact heatmaps represent the interaction frequency between regions along chromosome following along the diagonal from a given point on the track (darker color indicates higher interaction frequency). Genomic tracks represent chromatin accessibility and significant loops.
Figure 2.
Figure 2.. Cell type-specific A/B compartments and their relations to gene expression and regulatory chromatin.
A, Example of A/B compartment identification using Pearson correlation matrix at 40kb resolution on chr1:150,000,000–250,000,000. The plaid pattern suggests that chromatin spatially segregates into two compartments. The first eigenvector of the correlation matrix is shown below to derive compartment type, with genomic GC content as reference. B, Jaccard coefficient of A/B compartment assignment in pairwise comparison of each replicate sample derived from acinar, alpha, and beta cells. A/B compartment assignment was defined by the sign of first eigenvector for each 40kb bin and compared between Hi-C samples. C, Composition of genomic regions that change compartment status or remain the same in pairwise comparisons between cell-types. D and E, Distribution of fold-change in OCR (open chromatin region) accessibility (D) and gene expression (E) at dynamic (A to B or B to A) or stable (A to A or B to B) compartmentalized regions. P value was calculated by two-sided Wilcoxon sum rank test; whiskers correspond to interquartile range. F, Pathway enrichment for genes located at endocrine and acinar-specific A compartment. P-values are calculated by hypergeometric test with FDR correction.
Figure 3.
Figure 3.. Cell-type differential loops (CTDLs) and their effect on gene regulation.
A, The interaction frequency (IF) heatmap shows distinct clustering of cell-type enriched loops (CTELs). Each row represents a unique CTEL, and individual samples are organized in columns; four clusters are defined by hierarchical clustering. Cluster notion and number of differential chromatin loops are indicated in colored annotation box at left of heatmap. B, Distribution of accessibility fold-change of OCRs located at anchors of CTELs. P value is calculated by two-sided Wilcoxon sum rank test; whiskers correspond to interquartile range. C, The ratio of clustered CTELs overlapped with enhancer and polycomb-binding chromatin (PolyComb) from acinar and endocrine cells. Left panel illustrates the expected result based on chromatin enrichment of all chromatin loops in Supplemental Figure 3I. Plus sign means “enrichment”, minus sign means “depletion” and circle means “irrelevant”. Right panel shows the observed result in terms of the percentage of clustered CTELs overlapping with given chromatin state. P value is calculated by two-side two sample proportion test. D, CTELs connecting promoters of CEL and CHGA to distal regulatory elements. The Hi-C contact frequency matrix is shown in heatmap with CTDLs (cell type differential loops) in yellow diamonds. Consensus chromatin loops are represented as arcs, with CTELs labelled in red. scATAC-seq is shown as normalized aggregated fragment abundance in each cell type with consensus peaks highlighted by blue bars. Chromatin states (CS) for both acinar and endocrine cells are represented by the color scheme explained in Supplemental Figure 3H. E, The gene regulation scheme of CEL and CHGA. The interaction frequency (IF) heatmap is shown for all the chromatin loops that connect the gene promoters to distal chromatin, with CTELs annotated with corresponding cluster color scheme below. The chromatin loops are also annotated based on whether distal chromatin anchors are overlapped with consensus ATAC-seq peaks (union of the aggregated ATAC-seq peaks called from acinar, alpha, and beta cells) and cell-type enhancer chromatin. F, Cell-specificity of gene and OCRs connected by CTELs. The specificity of genes and OCRs in each cell type are calculated using scRNA-seq and scATAC-seq data. The overall specificity of gene-OCR pair is represented by the geometric mean of specificity values of each gene and plotted in the boxplots. P-value is calculated by two-sided Wilcoxon sum rank test; whiskers correspond to interquartile range. Red:Acinar cell, Green:Alpha cell, Blue:Beta cell, Orange: Alpha-Beta shared.
Figure 4.
Figure 4.. Cell-type specific transcription factor (TF) motif enrichment and TF-gene network.
A, chromVAR motif enrichment for 438 cell-type-specific TFs. The identification of cell-type-specific TFs is explained in Methods, for full list see Supplemental Table 6. The enrichment was measured by deviation z-score. B, The enrichment for NR5A2, PAX6 and PAX4 motifs for each cell projected onto UMAP. C, Pearson correlation of TF enrichment between cell types. The deviation z-score was used for correlation. D, GSEA pre-rank enrichment of cell type-specific expressed genes identified as NR5A2, PAX6 and PAX4 downstream genes by motif analysis. Genes are ranked by gene expression log2 fold change in the given cell type from highest to the lowest. Gene sets are defined by TF downstream genes of which either promoters or distal cis-regulatory elements contain the given TF motif. Details of enrichment are given in Supplemental Table 7. E, Association index analysis reveals alpha-specific TF modules. TF sets are defined cell-specific TFs with significant GSEA enrichment (Supplemental Table 7). Matrices show the Jaccard similarity between TF pairs based on occurrence of co-regulated downstream gene.
Figure 5.
Figure 5.. Chromatin contacts link T2D risk variants to target genes with cell-type specific stratification.
A, Partitioned LD score regression enrichment of gene-connected regulatory chromatin for T2D and related relevant traits. Significant enrichment FDR < 0.1 is indicated with red. B, Specificity and sensitivity of variant-to-gene mapping approaches using chromatin maps from pancreatic cells to detect positive control genes previously defined for T2D. The approaches “ABC” and “binary” are detailed in Methods. The “open promoter” approach defined candidate genes as the proximal genes whose promoter regions (−1,500bp to +500bp of TSS) overlapped with proxies located in open chromatin regions (Supplemental Figure 4, right branch), while the “open nearest genes” were defined by proximal genes closest to open proxies regardless of distance.
Figure 6.
Figure 6.. Chromatin contacts link T2D risk variants to target genes with cell-type specific stratification.
A, Cell type-specificity of putative causal variants and their target gene. The variant-containing gene-OCR pairs with high cell-specificity (specificity >= 0.5) were labelled with target gene name for each cell type B, The gene-causal-variant pairs were clustered based on cell-type specificity C, Cell type-specific chromatin looping between causal variants (rs7482891, rs4929964 and rs4929965) and target genes INS and TRPM5 and the T2D TH (rs4929965) locus. The chromatin loops that connect causal variants and target genes are highlighted with cell-type specific color (acinar: red, alpha: green and beta: blue), with hue scale indicating Hi-C interaction frequency. D, Cell-specific chromatin looping between variant rs4234731 and the target gene WFS1 at the T2D rs10937721 locus. The chromatin loops that connect putative causal variants and target genes are highlighted with cell-type specific color (acinar: red, alpha: green and beta: blue) with the hue scale indicating the Hi-C interaction frequency.

References

    1. Ackermann AM, Wang Z, Schug J, Naji A, and Kaestner KH (2016). Integration of ATAC-seq and RNA-seq identifies human alpha cell and beta cell signature genes. Mol Metab 5, 233–244. - PMC - PubMed
    1. Altshuler D, Daly MJ, and Lander ES (2008). Genetic mapping in human disease. Science 322, 881–888. - PMC - PubMed
    1. Alvarez-Dominguez JR, Donaghey J, Rasouli N, Kenty JHR, Helman A, Charlton J, Straubhaar JR, Meissner A, and Melton DA (2020). Circadian Entrainment Triggers Maturation of Human In Vitro Islets. Cell Stem Cell 26, 108–122 e110. - PubMed
    1. Arda HE, Tsai J, Rosli YR, Giresi P, Bottino R, Greenleaf WJ, Chang HY, and Kim SK (2018). A Chromatin Basis for Cell Lineage and Disease Risk in the Human Pancreas. Cell Syst 7, 310–322 e314. - PMC - PubMed
    1. Beumer J, Puschhof J, Bauza-Martinez J, Martinez-Silgado A, Elmentaite R, James KR, Ross A, Hendriks D, Artegiani B, Busslinger GA, et al. (2020). High-Resolution mRNA and Secretome Atlas of Human Enteroendocrine Cells. Cell 182, 1062–1064. - PubMed

Publication types

MeSH terms